Australian Capital Territory Climate change snapshot - Environment ...
←
→
Page content transcription
If your browser does not render page correctly, please read the page content below
Australian Capital Territory Climate change snapshot
Overview of
Australian
Capital Territory
climate change
Based on long-term (1910–2011)
observations, temperatures in the
Australian Capital Territory (ACT) have
been increasing since about 1950, with
higher temperatures experienced in
recent decades.
The ACT is projected to continue to
warm during the near future (2020–2039)
and far future (2060–2079), compared to
recent years (1990–2009). The warming
is projected to be on average about
0.7°C in the near future, increasing to
about 2°C in the far future. The number
of hot days is projected to increase,
with fewer cold nights.
The warming trend projected for the
ACT is large compared to natural
variability in temperature and is similar
to the rate of warming projected for
NSW.
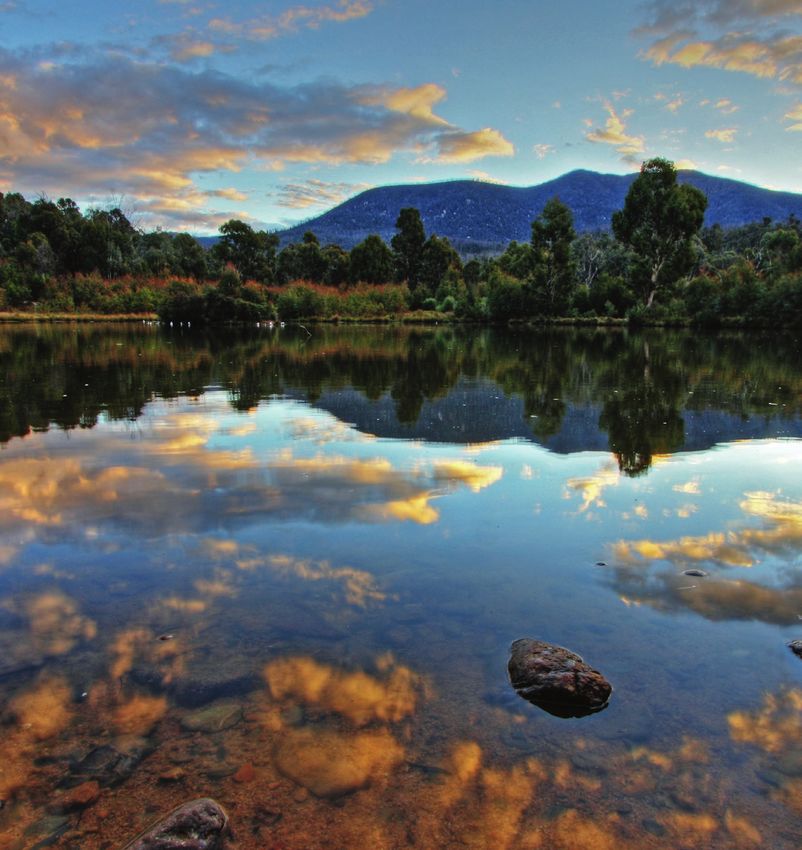
Front Cover: Tidbinbilla Nature Reserve in Canberra. Copyright:
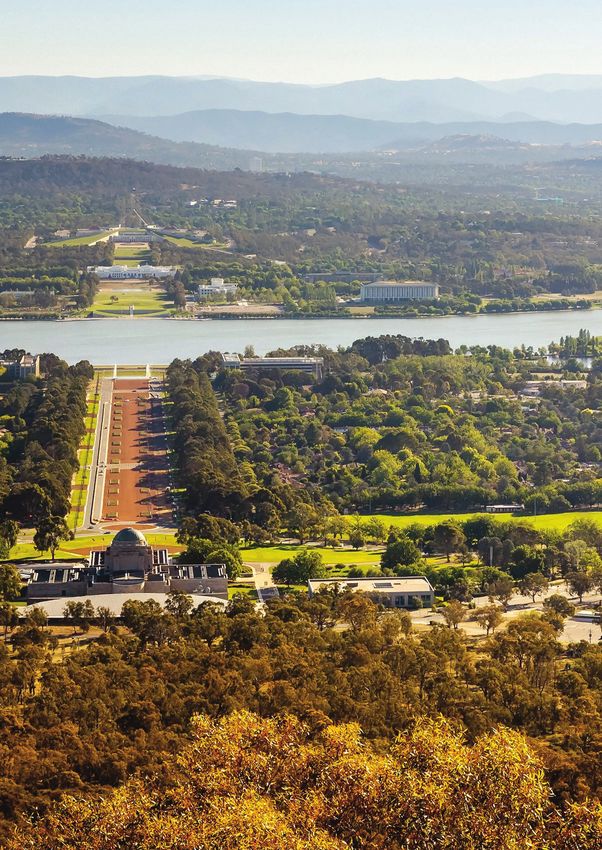
Christopher Meder. Page 2: An image of the capital city of Australia –
Canberra. Copyright: Markus Gann. Page 4: View over Canberra CBD.
Copyright: FiledIMAGE. Page 9: Sunset landscape in Canberra, the
capital of Australia. Copyright: Christopher Meder.
2
Projected changes
                                                           INCREASING
                                                            IN SPRING

          DECREASING
           IN SPRING                                                       INCREASING

                                                            INCREASING
                                                             IN AUTUMN
       INCREASING
        MINIMUMS

          DECREASING

 Projected temperature changes

 Maximum temperatures are projected to         Maximum temperatures are projected to
 increase in the near future by 0.6 – 0.9°C    increase in the far future by 1.4 – 2.3°C

 Minimum temperatures are projected to         Minimum temperatures are projected to
 increase in the near future by 0.4 – 0.7°C    increase in the far future by 1.4 – 2.3°C

 The number of hot days will increase          The number of cold nights will decrease

 Projected rainfall changes

                                               Rainfall is projected to increase
 Rainfall is projected to decrease in spring
                                               in summer and autumn

 Projected Forest Fire Danger Index (FFDI) changes

 Average fire weather is projected to          The number of severe fire weather days is
 increase in spring, summer and winter         projected to increase in summer and spring

                                                                                            3
Regional snapshots

    NSW and ACT Regional Climate                                Interpreting climate projections can be challenging due
                                                                to the complexities of our climate systems. ‘Model
    Modelling project (NARCliM)                                 agreement’, that is the number of models that agree
                                                                on the direction of change (for example increasing or
    The climate change projections in this snapshot are
                                                                decreasing rainfall) is used to determine the confidence
    from the NSW and ACT Regional Climate Modelling
                                                                in the projected changes. The more models that agree,
    (NARCliM) project. NARCliM is a multi-agency research
                                                                the greater the confidence in the direction of change.
    partnership between the NSW and ACT governments
    and the Climate Change Research Centre at the               In this report care should be taken when interpreting
    University of NSW. NSW Government funding comes             changes in rainfall that are presented as the average of
    from the Office of Environment and Heritage (OEH),          all of the climate change projections, especially when
    Sydney Catchment Authority, Sydney Water, Hunter            the model outputs show changes of both wetting and
    Water, NSW Office of Water, Transport for NSW, and          drying. To understand the spread of potential changes
    the Department of Primary Industries.                       in rainfall the bar charts should be considered along
                                                                with the maps provided in this document. Help on
    The NARCliM project has produced a suite of twelve
                                                                how to interpret the maps and graphs in this report is
    regional climate projections for south-east Australia
                                                                provided in Appendix 1.
    spanning the range of likely future changes in climate.
    NARCliM is explicitly designed to sample a large range      Summary documents for each of the state planning
    of possible future climates.                                regions of NSW are also available and provide climate
                                                                change information specific to each region.
    Over 100 climate variables, including temperature,
    rainfall and wind are available at fine resolution (10km    The snapshots provide descriptions of climate change
    and hourly intervals). The data can be used in impacts      projections for two future 20-year time periods:
    and adaptation research, and by local decision              2020–2039 and 2060–2079.
    makers. The data is also available to the public and will
    help to better understand possible changes in NSW           1.2 The climate projections for 2020–2039
    climate.                                                         are described in the snapshots as
                                                                     NEAR FUTURE, or as 2030, the latter
    Modelling overview                                               representing the average for the 20-
    The NARCliM modelling was mainly undertaken and
                                                                     year period.
    supervised at the Climate Change Research Centre.
                                                                2.2 The climate projections for 2060–2079
    NARCliM takes global climate model outputs and
    downscales these to provide finer, higher resolution             are described in the snapshots as
    climate projections for a range of meteorological                FAR FUTURE, or as 2070, the latter
    variables. The NARCliM project design and the                    representing the average of the 20-year
    process for choosing climate models has been peer-               period.
    reviewed and published in the international scientific
    literature (Evans et. al. 2014, Evans et. al. 2013, Evans   Further information about the regions will be released
    et. al. 2012).                                              in 2015.
    Go to climatechange.environment.nsw.gov.au for more
    information on the modelling project and methods.

4
Introduction
This snapshot presents climate change                       The population of the ACT is projected to increase
                                                            by 50,350 persons, to a total population of 390,100
projections for the Australian Capital
                                                            persons by 2019. Much of the territory's population
Territory (ACT). It outlines some key                       growth is projected to occur in the new development
characteristics of the territory, including                 areas of Gungahlin and Molonglo (ACT
its current climate, before detailing the                   Government 2014).
projected changes to the region’s
climate in the near and far future.                         Natural ecosystems
                                                            The Namadgi National Park, with its mountainous
Location and topography                                     and forested areas, covers about 46 per cent of
                                                            the ACT, protecting part of the northern end of the
The ACT is home to Australia’s capital city, Canberra.      Australian Alps (Snowy Mountains). Despite the small
The territory lies between 35° and 36° latitude south       size of the territory, it is home to a variety of habitats
at the northern extent of the Australian Alps bioregion,    including open grasslands, low open woodlands
as an enclave within NSW. The total area of the             and tall wet forests. Of particular importance are
ACT is about 2352 km2, of which 60 per cent is hilly        the sub-alpine heathlands and wetlands containing
or mountainous with northern parts of the territory         sedge ferns and sphagnum moss that are vital for the
comprising more undulating terrain. Elevations range        endangered northern corroboree frog. The Ginini Flats
from 450 m along the Murrumbidgee River to 1911 m           Wetlands Ramsar Site is of particular importance for
above sea level at the top of Mount Bimberi. Situated       the protection of the northern corroboree frog and
on the Eastern Lachlan Fold Belt, the ACT includes the      the only such site in the ACT. There are 12 additional
eastern edge of the Brindabella Ranges with Bimberi         threatened species in the region.
Peak located on the NSW–ACT border (ABS 2007).
Notable physical features are timbered mountains
located in the south and west of the territory, and
plains and hill country in the north. The ACT is situated
within the upper Murrumbidgee River catchment, in
the Murray–Darling Basin. The Murrumbidgee flows
through the territory from the south, and its tributary,
the Molonglo, from the east. Other tributaries of the
Murrumbidgee include the Cotter, Paddys, Naas
and Gudgenby Rivers. The Molonglo River was
dammed in 1964 to form Lake Burley Griffin
(ABS 2007).

Population and settlements
In 2011, the population of the ACT was
approximately 357,000, with Canberra the only city
(ABS 2011). Smaller communities in the territory
include Williamsdale, Tharwa, Hall, Naas and
Uriarra. Public administration, health care and social
assistance and education and training are the major
employers of the 195,890 strong
work force.

                                                                                                                         5
Climate of the ACT
The varied topography of the ACT results Long term temperature records show an increase
in temperatures in the ACT since approximately
in a large range of climate conditions over
1950, with an acceleration in the rate of increase in
a relatively small area. In the north of the temperatures observed in the last two decades.
territory around Canberra it is relatively dry
and warm compared to the much cooler Temperature extremes
and wetter south-western area around the
Temperature extremes, both hot and cold, occur
northern Australian Alps. Northern parts
infrequently but can have considerable impacts on
of the territory experience mild summers, health, infrastructure and our environment. Changes to
with cold winters experienced in the Alps. temperature extremes often result in greater impacts
More mild conditions are experienced in than changes to average temperatures.
the central part of the ACT with warmer
winters than the south, but cooler Hot days
summers than the north of the territory. On average, the ACT experiences fewer than 10 hot
A more detailed account of seasonal days each year (maximum temperatures above 35°C).
and spatial variations in temperature and A marginally greater number of hot days occur in the
north of the ACT, and there are typically no days with
rainfall is given below.
temperatures greater than 35°C in the alps.
CU R REN T CL IM ATE
Temperature Cold nights
Average annual temperatures range from 16°C in
The number of nights per year with minimum
the north-west to 6°C in the Alps. Average daily
temperatures below 2°C varies considerably across
temperatures in summer range from 20–22°C in
the territory, generally increasing southwards.
northern parts of the territory to 12–14°C in higher
Canberra typically experiences 70–90 cold nights per
altitudes of the Alps. During winter, average daily
year, and in the mountainous areas have on average
temperatures range from 6–8°C in the north to 0–2°C
over 170 cold nights per year.
at higher elevations in the alps.
10-ACT
Average daily maximum temperatures during summer
range from 26–28°C across the north of the ACT to
90 30
between 18–20°C in the alps. The average minimum
temperature in winter ranges from 2–4°C in the north, 80
25
Monthly rainfall and temperature
to between –4 and –2°C in the south and the alps. 70
20
The territory experiences distinct seasons. Seasonal 60
variations are illustrated by the monthly changes 15
rainfall
50
in average, minimum and maximum temperatures Maximu
(Figure 1). The average monthly temperature in the 40 10 Minimum
ACT ranges from approximately 18°C in January to 30
5 Mean te
around 4°C in July. The ACT has a large variation
20 Annual m
in temperature across the region with average
0
temperatures decreasing as you move south. 10
0 -5
1 2 3 4 5 6 7 8 9 10 11 12
Month
Annual
Rainfall Tmax Tmin Tmean Tmean
Figure 1: Seasonal rainfall and temperature variations (AWAP1 data for 1960–1991).
1. Australian Water Availability Project, see www.csiro.au/awap/.
6
Rainfall                                                               Fire weather
Rainfall varies considerably across the Australian                     The risk of bushfire in any given region depends on
Capital Territory. This variability is due to the complex              four ‘switches’. There needs to be enough vegetation
interactions between weather patterns in the region,                   (fuel), the fuel needs to be dry enough to burn, the
the influence of larger-scale climate patterns such as                 weather needs to be favourable for fire to spread,
El Niño Southern Oscillation, and the topography of                    and there needs to be an ignition source (Bradstock
the Australian Alps and Great Dividing Range.                          2010). All four of these switches must be on for a fire
                                                                       to occur. The Forest Fire Danger Index (FFDI) is used
Rainfall ranges from over 1200 mm in the alps to
                                                                       in NSW to quantify fire weather. The FFDI combines
400–800 mm in the north and east of the territory
                                                                       observations of temperature, humidity and wind speed
(including Canberra). Central and western parts of the
                                                                       with an estimate of the fuel state.
ACT receive an average of 800–1200 mm of rainfall
each year.                                                             Long-term observations of FFDI come from daily
                                                                       measurements of temperature, rainfall, humidity and
Rainfall is uniform throughout the year across the
                                                                       wind speed at only a small number of weather stations
north and central parts of the territory, which generally
                                                                       in Australia, with 17 stations located in NSW and the
receives between 100 and 300 mm each season.
                                                                       ACT (Lucas 2010). FFDI values below 12 indicate
Parts of the alps receive 300–400 mm in winter and
                                                                       low to moderate fire weather, 12-25 high, 25-49 very
spring.
                                                                       high, 50-74 severe, 75-99 extreme and above 100
During much of the first half of the 20th century the                  catastrophic.
ACT has experienced drier conditions. There is more
                                                                       Long term FFDI estimates show average daily FFDI is
year-to-year variability in rainfall from the 1950s to
                                                                       7 in Canberra.
1990s. The first decade of the 21st century was
characterised by below average rainfall during the                     Fire weather is classified as ‘severe’ when the FFDI
Millennium Drought.                                                    is above 50. Canberra has on average 1.1 severe fire
                                                                       weather days each year.

 Average FFDI
 Station                      Annual                Summer                 Autumn             Winter             Spring
 Canberra                              6.9                  11.4                 7.2                   2.6                6.4
 Number of severe fire weather days (FFDI>50)
 Canberra                              1.1                   0.8                 0.2                    0                 0.2

Table 1: Baseline FFDI values for meteorological stations within the ACT

                                                                                                                                 7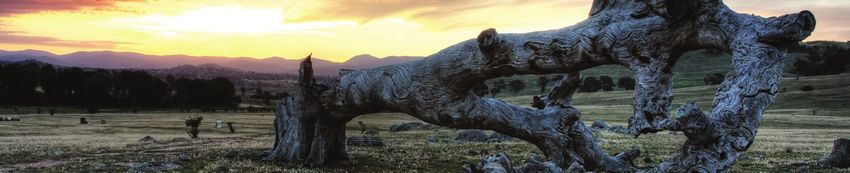
Temperature
                          Climate change projections are presented                Projected regional climate changes
                          for the near future (2030) and far future
                                                                                  The ACT is expected to experience an
                          (2070), compared to the baseline climate
                                                                                  increase in all temperature variables
                          (1990–2009). The projections are based
                                                                                  (average, maximum and minimum) for the
                          on simulations from a suite of twelve
                                                                                  near future and the far future (Figure 2).
                          climate models run to provide detailed
                          future climate information for NSW and                  Maximum temperatures are projected to
                          the ACT.                                                increase by 0.7°C in the near future and by
                          Temperature is the most reliable indicator of climate   2°C in the far future. Spring will experience
                          change. Across the ACT all of the models agree          the greatest changes in maximum
                          that average, maximum and minimum temperatures          temperatures, increasing by 2.5°C in the
                          are increasing.
                                                                                  far future (Figure 2b). Increased maximum
                                                                                  temperatures are known to impact human
                              Summary temperature                                 health through heat stress and increasing
                              Maximum temperatures are                            the number of heatwave events.
                              projected to increase in the
                                                                                  Minimum temperatures are projected to
                              near future by 0.7oC
F UT U RE CL IM ATE

                                                                                  increase by 0.6°C in the near future by 2°C in
                              Maximum temperatures are                            the far future (Figure 2c). Increased overnight
                              projected to increase in the                        temperatures (minimum temperatures) can
                              far future by 2.0oC                                 have a considerable effect on human health.

                              Minimum temperatures are                            These increases are projected to occur
                              projected to increase by                            across the ACT (Figures 3–6).
                              near future by 0.6oC

                              Minimum temperatures are
                              projected to increase by
                              far future by 2.0oC

                              There are projected to be more
                              hot days and fewer cold nights.

                      8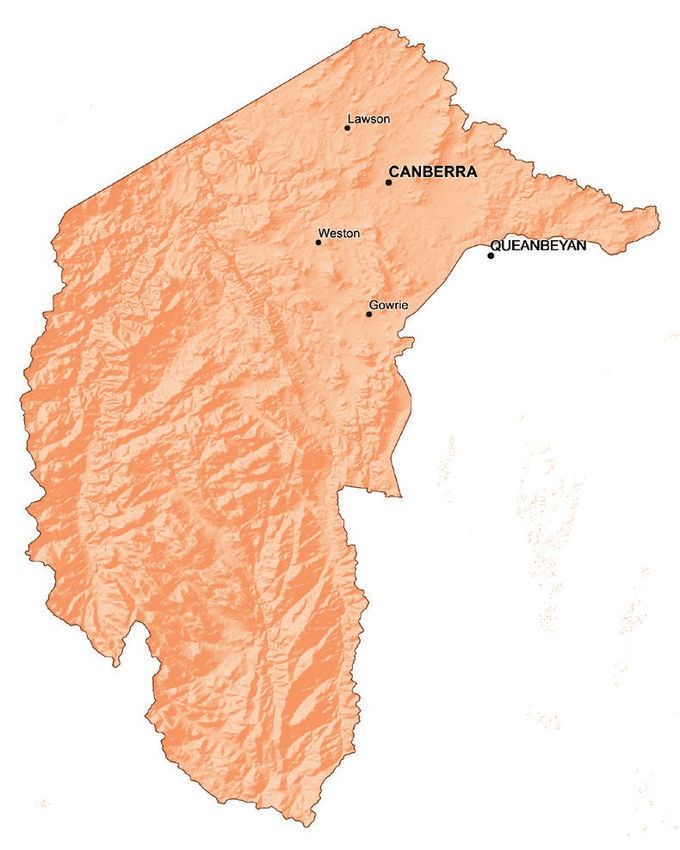
The long-term temperature trend indicates that temperatures in the
  region have been increasing since approximately 1950, with the largest
  increase in temperature variables coming in the most recent decades.

  a) Average air temperature                      b) Daily maximum temperature                    c) Daily minimum temperature

Figure 2: Projected air temperature changes for the ACT, annually and by season (2030 yellow; 2070 red):
a) average, b) daily maximum, and c) daily minimum. (Appendix 1 provides help with how to read and interpret these graphs).

 Near future change in maximum temperature                             Far future change in maximum temperature

Figure 3: Near future (2020–2039) change in annual average            Figure 4: Far future (2060–2079) change in annual average
maximum temperature, compared to the baseline period                  maximum temperature, compared to the baseline period
(1990–2009).                                                          (1990–2009).

 Near future change in minimum temperature                             Far future change in minimum temperature

                                                                                                                                  ACT
                                                                                                                                  Change in annual
                                                                                                                                  average daily
                                                                                                                                  temperature (°C)

                                                                                                                                        2.5 – 3.0
                                                                                                                                        2.0 – 2.5
                                                                                                                                        1.5 – 2.0
                                                                                                                                        1.0 – 1.5
                                                                                                                                        0.5 – 1.0
                                                                                                                                        0.0 – 0.5
Figure 5: Near future (2020–2039) change in annual average            Figure 6: Far future (2060–2079) change in annual average
minimum temperature, compared to the baseline period                  minimum temperature, compared to the baseline period
(1990–2009).                                                          (1990–2009).
                                                                                                                                            9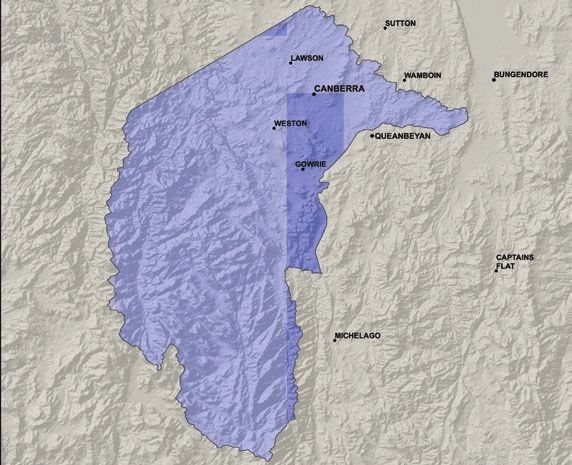
Hot days
                           DAYS PER YEAR ABOVE 35°C

                           Currently the ACT experiences fewer than 10 days
                           each year (temperatures above 35°C). International
                           and Australian experiences show that prolonged hot
                           days increase the incidence of illness and death –
                           particularly among vulnerable population groups such
                           as people who are older, have a pre-existing medical
                           condition or who have a disability. Seasonal changes
                           are likely to have considerable impacts on bushfire
                           danger, infrastructure development and native species
                           diversity.

                           Projected regional climate changes
                                                                                   Figure 7: Projected changes in the number of hot days (with
                                                                                   daily maximum temperature of above 35°C) for the ACT,
                           The ACT is expected to experience more                  annually and by season (2030 yellow; 2070 red). (Appendix 1
                                                                                   provides help with how to read and interpret these graphs).
                           hot days in the near future and the far future
                           (Figure 7).                                              Near future change in days per year above 35°C

                           There are minor changes projected for much
                           of the region with the greatest increase
                           around Canberra where there are projected
F UT U RE CL IM ATE

                           to be an additional 1-5 hot days in the near
                           future (Figure 8) expanding to over 10–20
                           more hot days by 2070 (Figure 9).

                           The region, on average, is projected to
                           experience an additional two hot days in the
                           near future (0–3 days per year across the 12
                           models) and six more hot days in the far future         Figure 8: Near future (2020–2039) projected changes in
                                                                                   the number of days per year with maximum temperatures
                           (3–8 days per year across the 12 models)                above 35°C.

                           (Figure 7).
                                                                                    Far future change in days per year above 35°C
                           These increases are being seen mainly in
                           spring and summer though in the far future                                                                            ACT
                           hot days are also extending into autumn                                                                               Change in annual
                                                                                                                                                 average number
                           (Figure 7).                                                                                                           of days with
                                                                                                                                                 temperatures
                                                                                                                                                 greater than 35°C

                                                                                                                                                       >40
                                                                                                                                                       30 – 40
                                                                                                                                                       20 – 30
                                                                                                                                                       10 – 20
                                                                                                                                                       5 – 10
                                                                                                                                                       1–5
                                                                                                                                                       0–1
                                                                                   Figure 9: Far future (2060–2079) projected changes in the
                                                                                   number of days per year with maximum temperatures
                                                                                   above 35°C.

                      10
Cold nights
DAYS PER YEAR BELOW 2°C
Most of the emphasis on changes in temperatures
from climate change has been on hot days and
maximum temperatures, but changes in cold nights
are equally important in the maintenance of our
natural ecosystems and agricultural/horticultural
industries; for example, some common temperate
fruit species require sufficiently cold winters to
produce flower buds. The Snowy Mountains is also
home to alpine ecosystems reliant on long cold
periods and snow.
Projected regional climate changes
Figure 10: Projected changes in the number of low
The ACT is expected to experience fewer temperature nights for the ACT, annually and by season
(2030 yellow; 2070 red). (Appendix 1 provides help with how
cold nights in the near future and the far to read and interpret these graphs).
future (Figure 10). Near future change in number of cold nights
(below 2°C) per year
The decreases are projected to occur
equally across the whole region
(Figures 11 and 12).
All models agree that the region as a whole
will see a decrease in cold nights with an
average of approximately 13 fewer cold
nights per year by 2030, ranging from
10–17 nights across the individual models.
The decrease in cold nights is projected
to be even greater in the far future, with
Figure 11: Near future (2020–2039) change in the number
an average of 43 fewer cold nights per of days per year with minimum temperatures below 2°C,
compared to the baseline period (1990–2009).
year (ranging from 32–53 nights across the
individual models) (Figure 12). Far future change in number of cold nights
(below 2°C) per year
A decrease in the number of cold nights ACT
is projected for all seasons, dominated by Change in annual
average number
decreases in winter and spring (Figure 10). of days with
temperatures
less than 2°C
-1 – 0
-5 – -1
-10 – -5
-20 – -10
-30 – -20
-40 – -30
< -40
Figure 12: Far future (2060–2079) change in the number
of days per year with minimum temperatures below 2°C,
compared to the baseline period (1990–2009).
11Rainfall
Changes in rainfall patterns have the potential for Projected regional climate changes
widespread impacts. Seasonal shifts can often
impact native species’ reproductive cycles as well as In the ACT all models agree that spring
impacting agricultural productivity, for example crops
rainfall will decrease in the near future and
that are reliant on winter rains for peak growth.
the far future. Winter rainfall is also projected
Rainfall changes are also associated with changes in
to decrease, with the majority of models
the extremes, such as floods and droughts, as well
as secondary impacts such as water quality and soil agreeing (8 out of 12) in the near future
erosion that occur as a result of changes to rainfall (Figure 13).
intensity.
The ACT currently experiences considerable
Modelling rainfall is challenging due to the complexities
of the weather systems that generate rain. ‘Model rainfall variability across the region, seasons
agreement’, that is the number of models that agree and from year-to-year and this variability is
on the direction of change (increasing or decreasing also reflected in the projections.
rainfall) is used to determine the confidence in the
projected change. The more models that agree, the Autumn rainfall is projected to increase by
greater the confidence in the direction of change.
the majority of models in the near future
Care should be taken when interpreting changes in (8 out of 12) and the far future (7 out of 12)
rainfall from averaging climate change projections
(Figure 13). These increases are uniform
when the model outputs project changes of both
F UT U RE CL IM ATE
wetting and drying. To understand the spread of across the region (Figures 14 and 15)
potential changes in rainfall the bar charts should
be considered along with the maps provided in this All models agree that spring rainfall is
document. projected to decrease across the whole
region in the near future and that the
Rainfall is projected to decrease continues into the far future
decrease in spring and (Figures 14 and 15).
increase in autumn Seasonal rainfall projections for the near future span
both drying and wetting scenarios for summer (–19–%
to +28%), autumn (–12% to +48%) and winter (–17%
to +12%); in the far future the projected changes are
summer (–7% to +28%), autumn (–9% to +54%), and
winter (–23% to +13%) (Figure 13).
All models agree that spring rainfall will decrease
(Figure 13) but the size of the decrease varies between
models for both the near future (-18% to -4%) and the
far future (-6% to -19%).
Projections for the region’s annual average rainfall
range from a decrease (drying) of 11% to an increase
(wetting) of 8% by 2030 and still span both drying and
wetting scenarios (–9% to +13%) by 2070.
Figure 13: Projected changes in average rainfall for the ACT,
annually and by season (2030 yellow; 2070 red). (Appendix 1
provides help with how to read and interpret these graphs).
12Summer 2020–2039 Summer 2060–2079
Autumn 2020–2039 Autumn 2060–2079
Winter 2020–2039 Winter 2060–2079
Spring 2020–2039 Spring 2060–2079
ACT
Change in average
rainfall (%)
> 30
20 – 30
10 – 20
5 – 10
0–5
-5 – 0
-10 – -5
-20 – -10Fire weather
The Bureau of Meteorology issues Fire Weather Projected regional climate changes
Warnings when the FFDI is forecast to be over 50.
High FFDI values are also considered by the Rural Fire The ACT is projected to experience an
Service when declaring a Total Fire Ban.
increase in average and severe FFDI in the
Average FFDI values are often used to track the status near future (2020–2039) and the far future
of fire risk. These values can be used when planning
(2060–2079) (Figures 16 and 17).
for prescribed burns and help fire agencies to better
understand the seasonal fire risk. The FFDI is also The increases in average fire weather are
considered an indication of the consequences of a fire
projected to occur mainly in summer and
if one was to start – the higher the FFDI value the more
dangerous the fire could be.
spring. The northern ACT has the greatest
increases, and these increases occur across
FFDI values below 12 indicate low to moderate fire
weather, 12-25 high, 25-49 very high, 50-74 severe,
all seasons (Figures 18 and 19)
75-99 extreme and above 100 catastrophic.
Increases in severe fire weather are
projected in summer and spring. Although
Severe and average fire weather
these changes are relatively small in
is projected to increase magnitude (three more days every decade)
they are projected to occur in prescribed
burning periods (spring) and the peak fire
F UT U RE CL IM ATE
risk season (summer) (Figure 17).
Autumn is projected to have a decreased severe fire
risk in the near future but there is less confidence
in the projections for the far future. As fire weather
measurements take into account rainfall, it is likely that
the decrease in autumn FFDI is due to the increase in
autumn rainfall across the region (see Figures
14 and 15).
Figure 16: Projected changes in the average daily forest fire Figure 17: Projected changes in average annual number of days
danger index (FFDI) for the ACT, annually and by season (2030 with a forest fire danger index (FFDI) greater than 50 for the ACT,
yellow; 2070 red). (Appendix 1 provides help with how to read and annually and by season (2030 yellow; 2070 red).
interpret these graphs).
14Summer Autumn
ACT
Winter Spring
Change in
average FFDI
3.0 – 3.5
2.5 – 3.0
2.0 – 2.5
1.5 – 2.0
1.0 – 1.5
0.5 – 1.0
0 – 0.5
0.0
-0.5 – 0
-1.0 – -0.5
-1.5 – -1.0Appendix 1 Guide to reading the maps and graphs
This document contains maps and bar graphs of the climate change projections. The maps present the results
of the twelve models as an average of all twelve models. The bar graphs show projections averaged across the
entire state and do not represent any particular location within the state. The bar graphs also show results from
each individual model. See below for more information on what is displayed in the maps and bar graphs.
How to read the maps How to read the bar graphs
The maps display
a 10km grid. The thin grey lines are the
individual models. There are
NSW has been divided into 12 thin lines for each bar.
State Planning Regions
and each region has a The thick line is the average of
Local Snapshot report. all 12 models for the region.
The colour of each grid The length of the bar shows the
is the average of all spread of the 12 model values
12 models outputs for the region
for that grid.
Each line is the average for the
region. They do not represent a
single location in the region.
Note: The yellow bars represent the near future (2020–2039), while the
red bars represent the far future (2060–2079)..
References
ABS 2012, Australian Bureau of Statistics, Canberra.
ACT Government 2014, Population Projections 2007-2019, http://www.cmd.act.gov.au/__data/assets/pdf_
file/0007/119734/suburb-population-projection.pdf
Blanchi, R, Lucas, C, Leonard, F and Finkele, K (2010), ‘Meteorological conditions and wildfire-related house loss
in Australia’, International Journal of Wildland Fire, vol. 19, pp. 914–926.
Bradstock, R (2010), ‘A biogeographic model of fire regimes in Australia: current and future implications’, Global
Ecology and Biogeography, vol. 19, pp. 145–158.
vans, J. P., Ji, F., Lee, C., Smith, P., Argüeso, D., and Fita, L. (2014) A regional climate modelling projection
E
ensemble experiment – NARCliM, Geoscientific Model Development, 7(2), 621-629, doi: 10.5194/gmd-7-621-
2014.
Evans, J.P., F. Ji, G. Abramowitz and M. Ekström (2013) Optimally choosing small ensemble members to produce
robust climate simulations. Environmental Research Letters 8, 044050, DOI: 10.1088/1748-9326/8/4/044050.
Evans, J. P., M. Ekström, and F. Ji (2012) Evaluating the performance of a WRF physics ensemble over South-
East Australia. Climate Dynamics, 39(6), 1241-1258, DOI: 10.1007/s00382-011-1244-5.
Disclaimer: OEH has prepared this report in good faith, exercising all due care and attention, but no representation or
warranty, express or implied, is made as to the relevance, accuracy, completeness or fitness for purpose of this information
in respect of any particular user’s circumstances. With respect to the content of this report, it should also be noted that
some projections currently involve a considerable degree of uncertainty.
This material may be reproduced for educational or non-commercial purposes, in whole or in part, provided the meaning is
unchanged and the source is acknowledged. © Copyright State of NSW and the NSW Office of Environment and Heritage.
Published by: Phone: Canberra connect 132281
Office of Environment and Heritage Email: environment@act.gov.au
59–61 Goulburn Street
PO Box A290
Sydney South 1232
Report pollution and environmental incidents
Environment Line: 131 555 (NSW only) or
info@environment.nsw.gov.au
See also www.environment.nsw.gov.au
OEH 2014/0831 – 978 1 74359 831 3
ISSN 1837–5650
November 2014
Printed on environmentally sustainable paperYou can also read