Perceptual Font Manifold from Generative Model
←
→
Page content transcription
If your browser does not render page correctly, please read the page content below
Perceptual Font Manifold from Generative Model

                                           Yuki Fujita, Haoran Xie, and Kazunori Miyata
                                        Japan Advanced Institute of Science and Technology
                                                          Ishikawa, Japan

Figure 1: The perceptual manifolds of fonts. We show all manifolds of causal, formal and POP styles, and separated the manifold from
left to right. In this research, perceptual manifolds are obtained from the results of a perceptual study of the feature space of fonts. The
feature space is learned from the latent space of a generative model of the font generation.

   Abstract—Though in recent times, various fonts are available
online for public usage, it is difficult and challenging to
generate, explore, and edit the fonts to meet the preferences of
all users. To address these issues, we propose in this paper, a
font manifold interface to visualize the perceptual adjustment
in the latent space of a generative model of fonts. In this
paper, we adopt the variational autoencoder network for font
generation. Then, we conducted a perceptual study on the
generated fonts from the multi-dimensional latent space of the
generative model. After we obtained the distribution data of
specific preferences, we utilized a manifold learning approach
to visualize the font distribution. As a case study of our                         Figure 2: Search results from Google Fonts.
proposed method, we developed a user interface for generated
font exploration in the designated user preference using a heat
map representation.
                                                                        2 shows the user-searching interface of Google Fonts. In
  Keywords-Character Fonts; Generative Model; Manifold
Learning; Perceptual Study;                                             order to search for the desired fonts, the user is asked to
                                                                        select different image features of font, the image features
                                                                        include thickness, slant, and width. This exploring approach
                      I. I NTRODUCTION
                                                                        is inefficient because humans font perceptions cannot easily
   Character fonts play crucial role in the representation of           be separated into specific features. For example, it is difficult
information. A user may choose the preferred types and                  to clarify which font features are the most appropriate for
shapes of fonts for special purposes. However, the fonts                creating an appealing festival poster. The same issues also
used in festival posters and business documents may be                  arise in Font Squirrel where tags are used to display the font
entirely different from each other. Usually, the choice of              features; moreover, understanding the meaning of these tags
fonts requires the skill and experience of a professional               may be challenging.
designer as it is always challenging to choose the most                    Recent research presents the font manifold in two-
suitable fonts from online sources or font lists in document            dimension (2D) by learning the nonlinear mapping from
files to meet the user’s perception need. In recent times,              existing fonts [3]. In this approach, a casual user can easily
several kinds of character fonts such as Google Fonts [1]               explore and edit fonts using the manifold with smooth
and Font Squirrel [2] are widely used.                                  interpolations. However, it is still challenging to explore the
   Exploring and editing to obtain the desired fonts from the           fonts with specific perception because all the font features
font libraries are usually challenging to casual users. Figure          are only geometrically displayed. To address this issue, in
Figure 3: The framework of our proposed perceptual font manifolds. In the offline process, we employed the VAE generative model
obtained the latent space of font generation. The generated result revealed that perceptual study in the latent space is explored for three
types of perception. We remark that the perceptual manifolds are obtained by the manifold learning approach. Finally, a casual user can
explore the desired fonts on the user interface proposed in the paper.

this paper, we propose a perceptual font manifold with                    •   We propose a perceptual font manifold to meet specific
different perception purposes. Moreover, it is worthy of note                 perceptual requirement in font exploration and editing.
that the authors adopted the font matching with energy-                   •   We provide a font-exploring user interface based on our
based optimization process in the research, which is time-                    proposed perceptual font manifolds, which is efficient
consuming and difficult to implement. Thanks to the rapid                     and user-friendly.
development of generative models based on deep learning
                                                                                          II. R ELATED W ORKS
approaches, with which we directly applied the latent space
from the generative model to construct the font manifold. In              Generative Model and Character Fonts. Paul et al.
contrast to the previous work [3], the approach proposed in            [4] proposed a neural network architecture, which creates
this paper is more straightforward and easier to implement.            a character font dataset from a single input font image. This
                                                                       dataset contains 62-letter fonts (from ”A” to ”Z”, ”a” to ”z”,
   In this paper, we propose the perceptual font manifolds
                                                                       and ”0” to ”9”). Samaneh et al. [5] proposed an end-to-end
from a generative model based on a deep learning approach
                                                                       system, called Multi-Content GAN, which generates a set
of the capital letter ”A” fonts. The results of the perceptual
                                                                       of font images using two networks; ”Glyph Network” and
studies in the latent space of the generative model were visu-
                                                                       ”Ornamentation Network”. Besides, this system can transfer
alized. Furthermore, we utilized the variational autoencoder
                                                                       the typographic stylization as well as the textual stylization
(VAE) network for font generation. As an advantage of the
                                                                       (color gradients and effects). Mehta et al. [6] proposed a
VAE model, the latent space is continuous such that similar
                                                                       character recognition system using artificial neural network
images are classified close to each other; hence, enabling
                                                                       and nearest neighbour approach from scanned images. We
the exploring of the perception distribution of fonts.
                                                                       observed that researches that deal with the combination of
   Besides, in this paper, based on the generation results             a generative model and character fonts focus mainly on
of the VAE model, we propose a user interface for the                  the generation of character font images; however, they do
perceptual study. When the user changes the latent variables           not put the perceptions of font images into consideration.
in the multi-dimensional space from the learning results, the          Therefore, in this paper, we bridge the gap observed above
user interface displays the corresponding font image as an             by considering the perception distribution in the latent space
output. In order to investigate perceptions of font images,            of the generative model.
we surveyed using three perceptions of casual, formal,                    Character Fonts and Perception. Choi et al. [7] pro-
and POP types of fonts. Finally, based on the perceptual               posed a system, which shows the character font correspond-
font manifolds presented in this paper, we propose a user              ing to an input image. A large number of character fonts are
interface. The proposed interface is shown to be efficient and         mapped on the semantic space in advance, and the system
easy to use in contrast to other widely used font searching            examines which character font corresponds to the input
interfaces.                                                            image on the space. The research carried out in [7] dealt with
  The main contributions of this research are as follows.              a combination of character fonts and perception. Regarding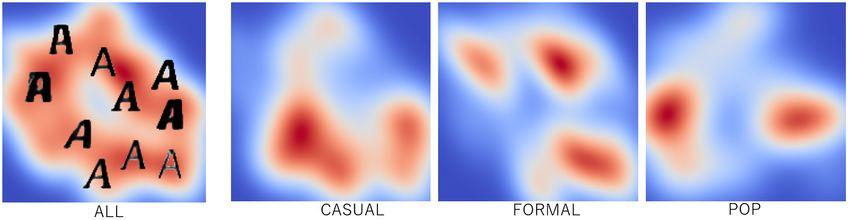
Figure 4: The architecture of our VAE network.

mapping on the semantic space, the authors did not consider                           IV. F ONT G ENERATION
the acquiring of the image feature values. However, in this            This paper adopts the generative model for font genera-
paper, we utilized the generative model for mapping to the          tion. We clarified the learning network; moreover, the details
latent space and considered the feature values of character         of our dataset are as follows.
images.
   Distribution of Character Fonts. Campbell et al. [3]             A. Generative Model
visualized the distribution of character fonts using the man-          In this paper, we utilized the VAE, which is the most
ifold. The user can move on this manifold with a mouse              representative generative model in the deep learning field
and transform the font image continuously. Guo et al. [8]           (see [9] and [10]). Figure 4 shows the network architecture
visualized Chinese font manifold. This system is learned            of the VAE model employed in this paper. The number under
using the feature of shape and skeleton; hence, it can gener-       each layer indicates the size of each array. The encoder
ate new fonts (not existing fonts). Furthermore, the systems        has four convolutional layers, and a flatten layer, while the
display the distribution of the character fonts such that one       decoder has a lambda layer and two convolutional layers.
can generate and search the fonts using that distribution.          The lambda layer calculates the latent variables using a mean
However, they also do not consider any perception from              and a deviation. For the implementation of the VAE model,
font images. In this paper, besides the display distribution,       we used the Keras library [11].
we considered the perception.
                                                                    B. Training Dataset
                                                                       To construct the training dataset for the VAE network, we
                  III. S YSTEM OVERVIEW                             downloaded 2244 TrueType font files from Google Fonts.
                                                                    Among all these files, the valid image data includes 2169
   Figure 3 illustrates the framework of the system proposed        PNG image files because 75 files could not be converted
in this paper. Contrary to the conventional generative model        into image files. Then, we executed the data cleansing of
based on deep learning approaches, in our proposed system,          the font images ready for machine learning.
the human effort is involved in the font generation processes.         Figure 5 illustrates the data cleansing process. The goal
Therefore, our framework includes two main components:              of the data cleansing process is to create 28 × 28 images for
machine computation and human involvement.                          our learning network. Similar to MNIST dataset, we utilized
   At the machine computation stage, we adopt generative            the same learning image sizes. Usually, the training image
network to generate the latent space of various fonts, while        has a white margin part except for the font body. We erased
at the human involvement stage, we ask the participant to           the white margin of font images and maintained the font
respond to font perception using the perceptual font user           body as much as possible for all image data.
interface proposed in this paper. In this interface, the user can      In the data cleansing process, we first converted the
adjust the latent variables to achieve the desired perception.      downloaded TrueType font files into grayscale image files.
In the case study considered, we recorded all latent variables      At the beginning of the process, the image files were set in a
related to causal, formal, and POP feelings. Furthermore, the       resolution with 256 × 256 pixels and sufficiently large size.
perceptual study revealed that the perceptual manifold of           Then, the rectangle-bounding box of the font is calculated.
fonts is obtained via manifold learning. Finally, we propose        To convert the rectangular image into a square size, we
a user interface for font exploration, which is based on the        added the white row (column) to the shorter side of the
approach proposed in this paper.                                    rectangle alternately. Finally, we scaled the image to 28×28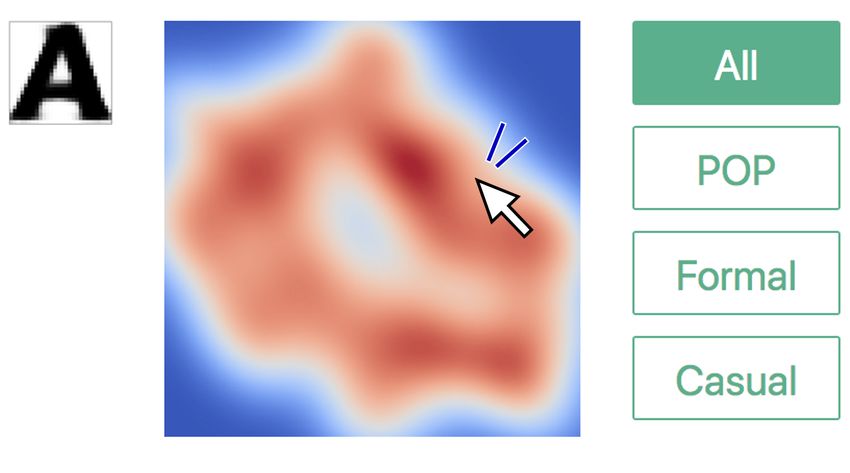
Figure 5: Data Cleansing Process

                                                                  Figure 7: The proposed user interface (a) used in our perceptual
                                                                  study (b).

                                                                  variables as shown in Figure 7 (b). Observe that each latent
        Figure 6: Font examples in our training dataset.          variable can be operated from 0 to 99. However, because
                                                                  the latent space is calculated based on Gaussian distribution,
                                                                  we adopt the percent point function and divide the variable
pixels using bilinear interpolation. Figure 6 shows examples      range from 5% to 95% into one hundred equal parts. In our
of font images in our font training dataset.                      proposed user interface, the output font image corresponding
                                                                  to the selected latent variable is displayed in real time.
            V. P ERCEPTUAL F ONT M ANIFOLD
                                                                     To classify the fonts into different user perceptions, we
   In this section, we propose the perceptual font manifold
                                                                  adopted three styles of font perception in this paper, includ-
considering the user perception in the font generation and
                                                                  ing POP, formal, and casual styles. Whenever the user feels
exploration. To effectively analyze the user perception of
                                                                  the right perception from the font image, the user was asked
font images, we conducted a perceptual study of font styles
                                                                  to click the perception buttons on the user interface, and the
based on the generated results from the VAE network. In this
                                                                  system will save the selected latent variables. To achieve a
study, the participants can choose the latent variables with
                                                                  good starting point, the user can also click the ”Changing a
the output of the font image generated in the latent space.
                                                                  Starting Font” button to change all latent variables randomly.
The latent space will have enough information if the latent
dimensions are high. However, it is difficult to obtain data         The purpose of this perceptual study is to classify the
from the perceptual study in high-dimensional latent space.       font images into three designated user perceptions. At the
Considering the trade-off between the computation cost and        beginning of the perceptual study, we showed examples of
the perception evaluation load, in our study, we chose five-      feature font of three user perceptions as shown in Figure
dimensional latent space.                                         8. Besides, we invited 17 graduate students to join our
                                                                  perceptual study. The survey time was limited to five minutes
A. Perceptual Study                                               because the user may feel exhausted to repeat the same task
   Figure 7 (a) shows the user interface for the perceptual       for a long time period. Finally, a total of 884 latent variable
study. The participants were asked to select their favorite       sets were collected including 273 POP, 311 formal, and 298
fonts using the five sliders to change the values of the latent   casual styles.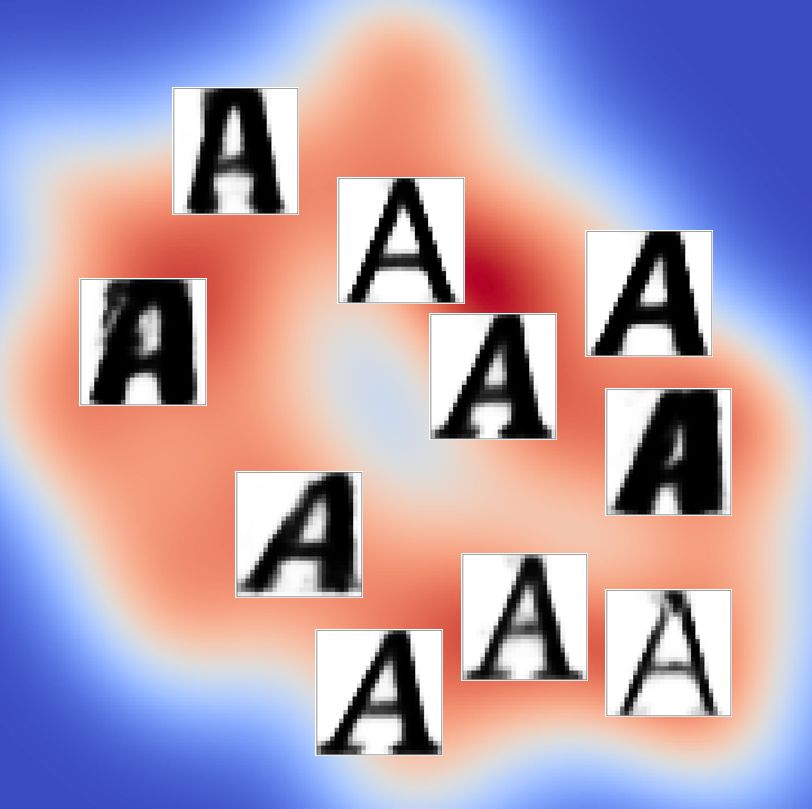
(1)POP               (2)Formal             (3)Casual
                  Figure 8: Feature Examples

                                                                    Figure 10: Our proposed user interface using the perceptual font
                                                                    manifold.

                                                                    interface in our case study, which is implemented as a Web
                                                                    application for easy usage.
                                                                       The proposed user interface is simple and easy to use.
                                                                    The interface shows the corresponding font image on the
                                                                    upper-left window continuously while moving the control
                                                                    point on the heatmap. To help choose the font in different
                                                                    user perceptions, the user can select the perception buttons
                                                                    on the right side of the user interface (All, POP, Formal,
                                                                    and Casual). The corresponding heatmap (Figure 1), from
                                                                    a different perspective is presented to the end user. When
                                                                    the user finds the desired font image, the user can click
                                                                    on it, and the modal window will be displayed for further
Figure 9: Results of dimensionality reduction from our perceptual   confirmation.
study. Blue points indicate the POP style, green points denote
formal style, and yellow points for causal style of fonts. tSNE-
1 and tSNE-2 are the dimensions of the reduced distribution data.
                                                                                          VI. C ASE S TUDY
                                                                    A. Comparison Study
B. Manifold Learning                                                   In our case study, we compared the user interface pro-
   The outcome of the perception study of font images               posed here with the traditional user interface for font search-
revealed that one could obtain distribution data in a latent        ing as used in online font libraries such as Font Squirrel.
space of five dimensions. To reduce the distribution data in        Note that we only focused on ”A” font in this research
two dimensions, we adopted a manifold learning approach.            for simplicity purpose. Figure 11 shows the traditional user
In this paper, we utilized the t-distributed Stochastic Neigh-      interface for font exploration, which displays 1592 font
bor Embedding (tSNE) method for model reduction [12].               images from the generation results of the VAE network. All
Figure 9 shows the result of the dimensionality reduction of        these font images are arranged in 10 columns and 160 rows
the distribution data from our perceptual study.                    with the scrollbar in a web application.
   To visualize the two dimensional distribution data from             Our case study, we randomly selected 10 target font
the manifold learning, we adopted the kernel density es-            images from the generated results as shown in Figure 12.
timation method to obtain a heatmap representation of               In both the traditional and the proposed user interfaces, the
the perceptual manifold of fonts [13]. Consequently, we             target font images are located on the upper-left side of the
achieved the heatmaps of all perception styles; POP, formal,        interface windows. The participants were asked to look for
and casual styles of fonts as shown in Figure 1. The high-          the target font images on both user interfaces and click on
density area is displayed in red color, while the low-density       the explored position with a confirmation window. Figure
area is displayed in blue color.                                    12 shows the distribution of target images on the proposed
                                                                    user interface.
C. User Interface                                                      We conducted the comparison study with 20 graduate
   Using the perceptual manifold of fonts introduced in this        students and randomly divided them into two groups; group
paper, we propose a user interface for font exploration from        1 and group 2. The members in group 1 were asked to use
the VAE generative network. Figure 10 shows the user                the traditional user interface first, and after that, to use the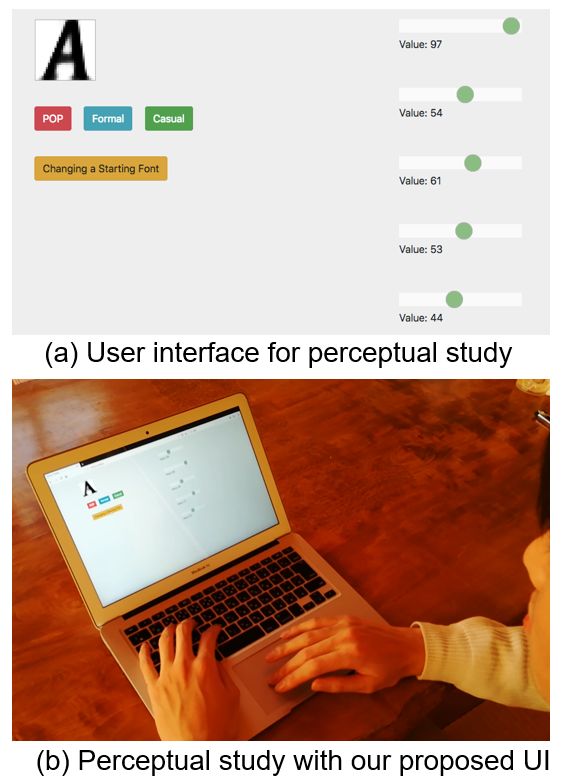
Figure 11: Traditional user interface for font exploration in a
comparison study.

                                                                     Figure 13: Comparison of SSIM scores between traditional (red)
                                                                     and our proposed user interface (green).

Figure 12: Test dataset used in our case study and their distribu-
tions in the manifold of fonts.                                      Figure 14: Comparison of time usage between traditional (red)
                                                                     and our proposed user interface (green).

proposed interface (Figure 10). The members in group 2
were asked to use the proposed user interface first, and then        where x and y are pixel positions on two font images. µx
the traditional user interface.                                      and µy denote mean pixel values, σx and σy are standard
                                                                     deviations of pixel value on two images, and σxy is the
                                                                     covariance value. C1 = 6.5 and C2 = 58.5 are constant
B. Discussion                                                        values. SSIM score is expressed between 0 and 1, and the
   In the case study carried out in this paper, regarding the        closer to 1, the higher the similarity.
usage of the two user interface considered here, we com-                Figure 13 shows the comparison results of exploration
pared the exploration accuracy and time cost. Regarding the          accuracy in SSIM score using the traditional and our pro-
exploration accuracy, we used structural similarity (SSIM)           posed user interface. Regarding SSIM scores, there is no
to quantify the similarity between two images [14]. In our           apparent difference between the two interfaces. In details,
research, SSIM scores are calculated between the target font         the user interface proposed in this paper achieved a little
images and the explored images from user operation. The              higher median and maximum values in SSIM scores than
formulation of SSIM score is given as follows.                       the traditional interface.
                                                                        Figure 14 shows the comparison results of time cost
                         (2µx µy + C1 )(2σxy + C2 )                  in seconds in using the traditional and our proposed user
    SSIM (x, y) =                                             (1)
                      (µ2x + µ2y + C1 )(σx2 + σy2 + C2 )             interface. Regarding the average of times cost, the partici-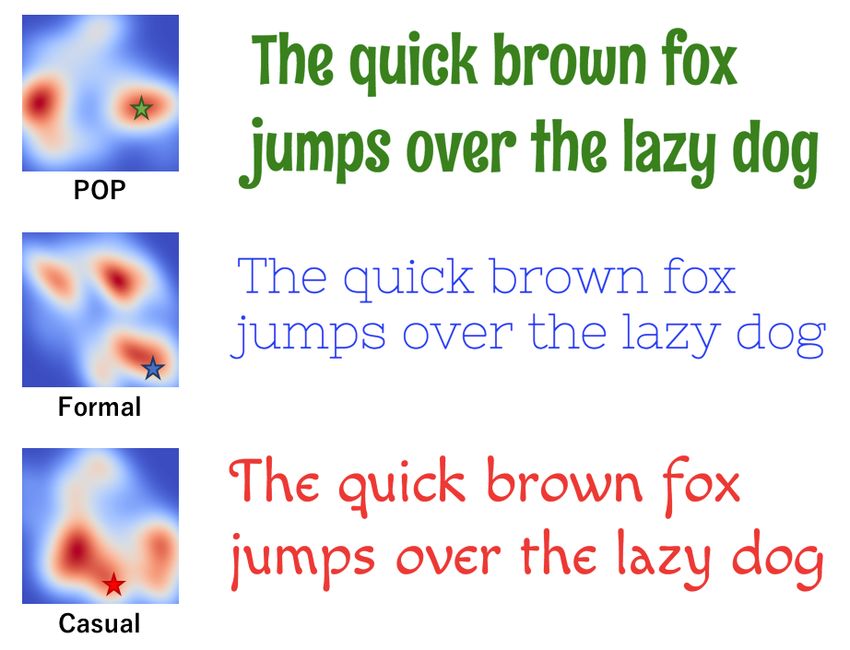
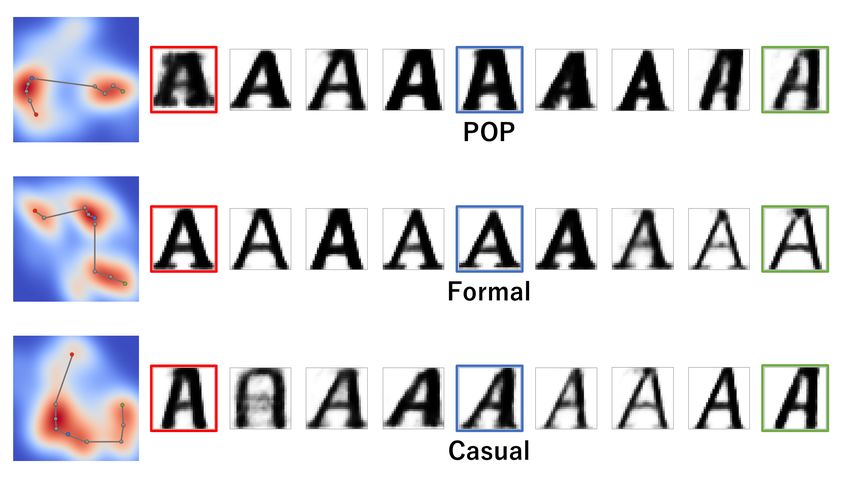
Figure 15: Explorations of font manifolds with three perception style demonstrating our matching results.

                                                                                             VII. R ESULTS
                                                                       The proposed system was implemented on a desktop
                                                                    computer with ubuntu 16.04 LTS, Intel Core i7-7700 CPU
                                                                    @ 3.60GHz ×8, GeForce GTX 1060 3GB GPU, and pro-
                                                                    grammed in Python 3.5 with CUDA 8.0, CuDNN 6.0 and
                                                                    Keras-gpu 2.1.6. The utilized VAE model was trained for 50
                                                                    epochs.
                                                                       Figure 15 shows the exploration results of fonts in three
                                                                    perceptual font manifolds. For POP perception of font im-
                                                                    ages, it is clear that these fonts are in bold and slant styles,
                                                                    whereas they are all in slim shape without slant styles in
                                                                    the formal perception. Also, for casual perception, there is
                                                                    an apparent feature of circular curves in the font styles. All
                                                                    these exploration results agree well with the common sense
                                                                    of these user perceptions as shown in Figure 8 (examples of
Figure 16: Application of our results with mapping from A to Z      images).
of test words.                                                         Though the perception study conducted in this research
                                                                    only handles ”A” fonts for simplicity, we can map the
                                                                    explored fonts into all character fonts. Figure 16 shows the
                                                                    text application of our results from ”A” to ”Z” which are
                                                                    obtained by matching the closest SSIM scores of ”A” fonts
pants operated 1.7 times slower in the traditional interface        in existing fonts to our generated font manifolds. The star
(97 seconds) than in our proposed interface (54 seconds).           points on the left figures of the font manifolds denote the
To confirm the difference between the two interfaces, we            font positions. We observed that the perception of the three
utilized the student’s t-test to verify the time cost. The result   font styles is apparently correct for common users.
revealed a score of 0.71 %, which shows that there is a
significant difference between the two interfaces. Hence, the                             VIII. C ONCLUSION
user interface proposed in this paper is more efficient than          In this paper, we proposed the perceptual font manifolds
the traditional interface.                                          using latent space from a generative model and the percep-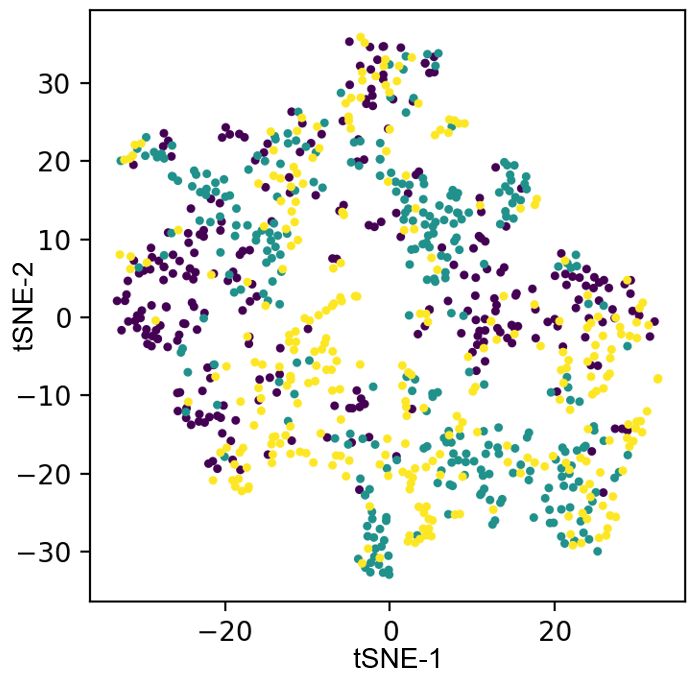
tual study carried out in this research. For the generative           [7] Saemi Choi, Kiyoharu Aizawa, and Nicu sebe: FontMatcher:
model, we employed the VAE network architecture with five                 Font Image Paring for Harmonious Digital Graphic Design,
latent dimensions of ”A” dataset, whereas for the perceptual              ACM, pp.37–41 (2018).
study, we obtained the distribution data of POP, formal,              [8] Yuan Guo, Zhouhui Lian, Yungmin Tang, and Jianguo Xiao:
and casual styles of a font in the latent space. We reduced               Creating New Chinese Fonts Based on Manifold Learning
the data dimensions into two dimensions using manifold                    and Adversarial Networks, EUROGRAPHICS (2018).
learning and made the heat maps of each distribution using
kernel density estimation method. Finally, we proposed a              [9] Diederik P. Kingma, Max Welling: Auto-Encoding Variational
                                                                          Bays, In Proceeding of the International Conference on Learn-
user interface for font exploration using our perceptual font             ing Representations (ICLR). (2014).
manifolds.
   In the case study of this research, the participants were         [10] Danilo J. Rezende, Shakir Mohamed, and Daan Wierstra:
asked to explore the target font images using the traditional             Stochastic Back-propagation and Approximate Inference in
font exploration interface and the user interface proposed in             Deep Generative Models, Technical report, arXiv: 1401.4082.
                                                                          (2014).
this paper. It was verified that our proposed user interface
requires less time cost while keeping good exploration               [11] Keras: The Python Deep Learning Library (online),
accuracy. Furthermore, the exploration results of different               https://keras.io/
perception styles revealed that our proposed system could
achieve the desired style of fonts suitable for not only ”A”         [12] Laurens van der Maaten, Geofferey Hinton: Visualizing Data
                                                                          using t-SNE, Journal of machine Learning Research 9,
font but also all character fonts.                                        pp.2579–2605. (2008).
   As limitations of this research, the system proposed in this
paper only handles ”A” fonts. Though we have matched all             [13] B. W. Silverman: Density estimation for statistics and data
the fonts by finding the closest position in ”A” font, the                analysis, (1986).
accuracy for other character fonts may be lost. In order
                                                                     [14] Zhou Wang, Alan Conrad Bovik, Hamid Rahim Sheikh and
to address this issue, the supervised font style transfer                 Euro P. Simoncelli: Image Quality Assessment: From Error
employed in [4] should be uitlized. Besides, there are many               Visibility to Structural Similarity, IEEE Transaction on Image
fonts defined in the shapes of outline fonts represented by               Processing, Vol.13, No.4. (2004).
TrueType font. The outline font expresses the font data as the
curve parameters and responds appropriately to scaling. We
also considered the exploration of the perceptual manifold
of the outline fonts.
   As possible future research, the concept of the perceptual
study of generative models may be applied to other research
targets such as human faces and foods.
                         R EFERENCES
 [1] Google Fonts (online),
     https://fonts.google.com/

 [2] FONT SQUIRREL (online),
     https://www.fontsquirrel.com/

 [3] Neill D.F. Campbell, Jan Kautz: Learning a Manifold of
     Fonts, ACM Transactions on Graphics, Vol 33, 4 (2014).

 [4] Paul Upchurch, Noah Snavely, and Kavita Bala: From A to Z:
     Supervised Transfer of Style and Content Using Deep Neural
     Network Generators, arXiv: 1603.02003 (2016).

 [5] Samaneh Azadi, Matthew Fisher, Vladimir Kim, Zhaowen
     Wang, Eli Shechtman, and Trevor Darrell: Multi-Content
     GAN for Few-Shot Font Style Transfer, arXiv: 1712.00516
     (2017).

 [6] H. Mehta, S. Singla and A. Mahajan: Optical character recog-
     nition (OCR) system for Roman script English language us-
     ing Artificial Neural Network (ANN) classifier, International
     Conference on Research Advances in Integrated Navigation
     Systems (RAINS), Bangalore, 2016.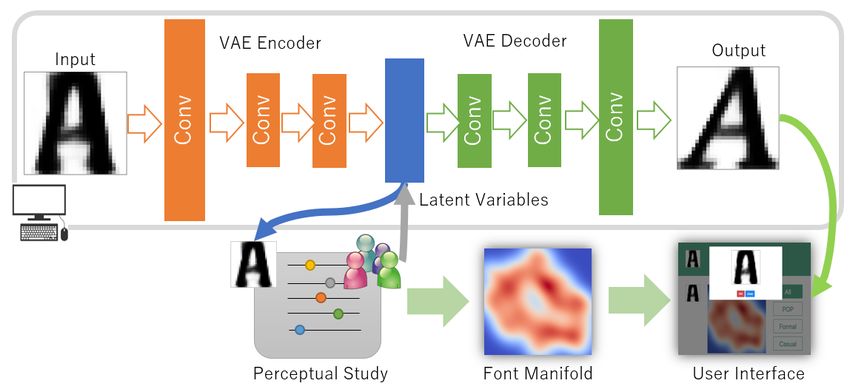
You can also read