South East and Tablelands Climate change snapshot - Adapt NSW
←
→
Page content transcription
If your browser does not render page correctly, please read the page content below
South East and Tablelands Climate change snapshot
Overview of
South East
and Tablelands
Region climate
change
Based on long-term (1910–2011)
observations, temperatures in the South
East and Tablelands Region have been
increasing since about 1960, with higher
temperatures experienced in recent
decades.
The region is projected to continue to
warm in the near future (2020–2039)
and far future (2060–2079), compared to
recent years (1990–2009). The warming
is projected to be on average about
0.6°C in the near future, increasing to
about 2°C in the far future. There will be
more hot days and fewer cold nights.
The warming projected for the region is
large compared to natural variability in
temperature.
The South East and Tablelands currently
experiences considerable rainfall
variability across the region and from
year-to-year - this variability is also
reflected in the projections. However, all
of the models agree that spring rainfall
will decrease in the future.
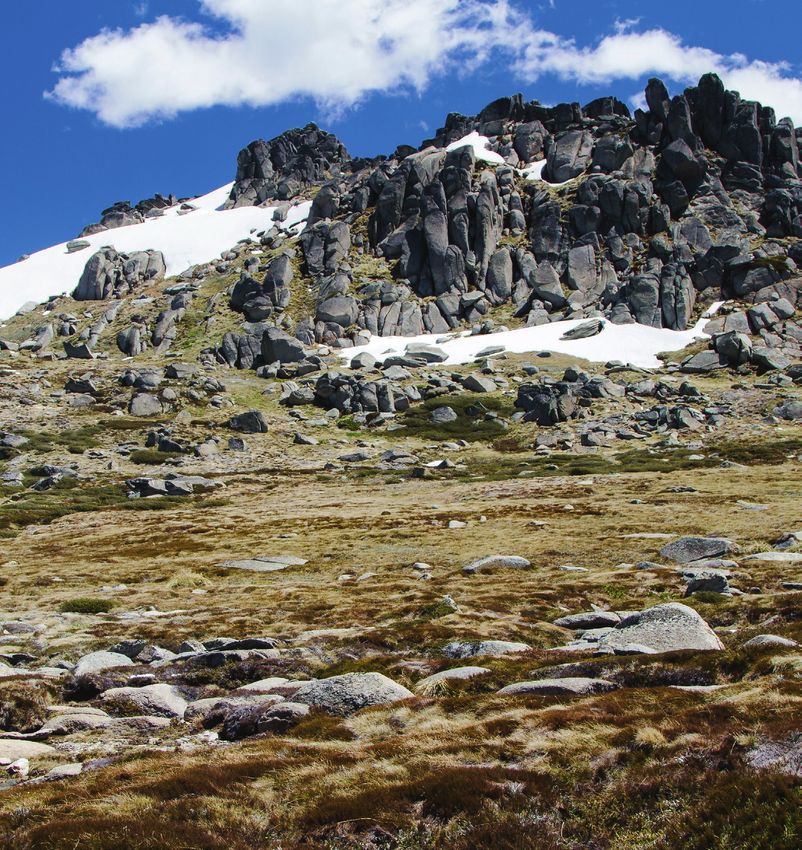
Front cover photograph: Kosciuszko National Park, NSW, Australia.
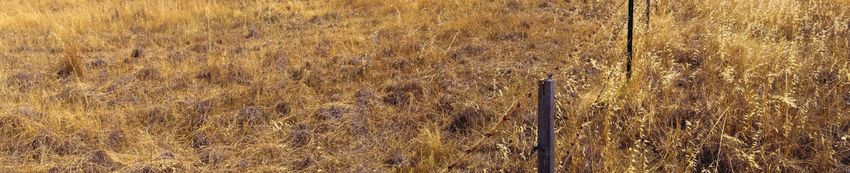
Copyright: Milosz_M. Page 2: A rural landscape with dead tree.
Near Oberon, NSW, Australia. Copyright: Ilia Torlin. Page 4: Batemans
Bay, NSW, Australia. Copyright: Alexandra Lang. Page 7: Sheep,
standing in the snow, near Laggan, NSW, Australia. Copyright: Phillip
Minnis. Page 9: Clyde River Bridge. Copyright: Christopher Meder.
2
Projected changes
                                                INCREASING

 INCREASING

                                                             INCREASING

          DECREASING
           IN SPRING

                                                         INCREASING
                                                          IN AUTUMN

            DECREASING

 Projected temperature changes

 Maximum temperatures are projected to      Maximum temperatures are projected to
 increase in the near future by 0.5–1.0°C   increase in the far future by 1.8–2.5°C

 Minimum temperatures are projected to      Minimum temperatures are projected to
 increase in the near future by 0.4–0.7°C   increase in the far future by 1.4–2.3°C

 The number of hot days will increase       The number of cold nights will decrease

 Projected rainfall changes

 Rainfall is projected to decrease          Rainfall is projected to increase
 in spring and winter                       in summer and autumn

 Projected Forest Fire Danger Index (FFDI) changes

 Average fire weather is projected to       Number of days with severe fire weather is
 increase in summer and spring              projected to increase in summer and spring

                                                                                         3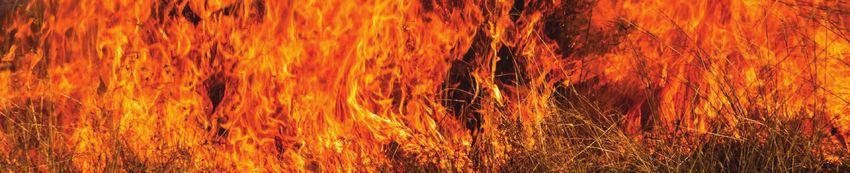
Regional snapshots

    NSW and ACT Regional Climate                                Interpreting climate projections can be challenging due
                                                                to the complexities of our climate systems. ‘Model
    Modelling project (NARCliM)                                 agreement’, that is the number of models that agree
                                                                on the direction of change (for example increasing or
    The climate change projections in this snapshot are
                                                                decreasing rainfall) is used to determine the confidence
    from the NSW and ACT Regional Climate Modelling
                                                                in the projected changes. The more models that agree,
    (NARCliM) project. NARCliM is a multi-agency research
                                                                the greater the confidence in the direction of change.
    partnership between the NSW and ACT governments
    and the Climate Change Research Centre at the               In this report care should be taken when interpreting
    University of NSW. NSW Government funding comes             changes in rainfall that are presented as the average of
    from the Office of Environment and Heritage (OEH),          all of the climate change projections, especially when
    Sydney Catchment Authority, Sydney Water, Hunter            the model outputs show changes of both wetting and
    Water, NSW Office of Water, Transport for NSW, and          drying. To understand the spread of potential changes
    the Department of Primary Industries.                       in rainfall the bar charts should be considered along
                                                                with the maps provided in this document. Help on
    The NARCliM project has produced a suite of twelve
                                                                how to interpret the maps and graphs in this report is
    regional climate projections for south-east Australia
                                                                provided in Appendix 1.
    spanning the range of likely future changes in climate.
    NARCliM is explicitly designed to sample a large range      Summary documents for each of the state planning
    of possible future climates.                                regions of NSW are available and provide climate
                                                                change information specific to each region.
    Over 100 climate variables, including temperature,
    rainfall and wind are available at fine resolution (10km    The snapshots provide descriptions of climate change
    and hourly intervals). The data can be used in impacts      projections for two future 20-year time periods:
    and adaptation research, and by local decision              2020–2039 and 2060–2079.
    makers. The data is also available to the public and will
    help to better understand possible changes in NSW           1.2 The climate projections for 2020–2039
    climate.                                                         are described in the snapshots as
                                                                     NEAR FUTURE, or as 2030, the latter
    Modelling overview                                               representing the average for the 20-
    The NARCliM modelling was mainly undertaken and
                                                                     year period.
    supervised at the Climate Change Research Centre.
                                                                2.2 The climate projections for 2060–2079
    NARCliM takes global climate model outputs and
    downscales these to provide finer, higher resolution             are described in the snapshots as
    climate projections for a range of meteorological                FAR FUTURE, or as 2070, the latter
    variables. The NARCliM project design and the                    representing the average of the 20-year
    process for choosing climate models has been peer-               period.
    reviewed and published in the international scientific
    literature (Evans et. al. 2014, Evans et. al. 2013, Evans   Further regional climate change information will be
    et. al. 2012).                                              released in 2015.
    Go to climatechange.environment.nsw.gov.au for more
    information on the modelling project and methods.

4
Introduction
This snapshot presents a summery of                     Natural ecosystems
climate change projections for the South
                                                        The southern tablelands and south-eastern slopes
East and Tablelands Region of NSW. It                   contains many temperate grassland, woodland, wet
outlines some key characteristics of the                forest and alpine ecosystems, and plant and animal
region, including its current climate, before           species not found elsewhere in NSW. There are
detailing the projected changes to the                  internationally significant (Ramsar) wetlands such
                                                        as Blue Lake in the Snowy Mountains. Significant
region’s climate in the near and far future.            protected areas include Kosciuszko National Park,
                                                        containing Australia’s largest and highest alpine
Location and topography                                 areas, the South East Forests and Deua-Wadbilliga
                                                        national parks on the escarpment, and Nadgee Nature
The South East and Tablelands Region spans the          Reserve on the far south coast. The state’s only
coastline from Durras Lake near Batemans Bay to the     pristine estuary, Nadgee Inlet, is located in the region.
Victorian border. The south-eastern corner of NSW       These biodiversity hotspots are also significant cultural
is home to Australia’s highest summits, including       landscapes for Aboriginal people.
Mount Kosciuszko and Mount Townsend, and the
headwaters of the Snowy, Murray, Murrumbidgee and
Lachlan rivers. Well known for its beaches, the South
East and Tablelands Region includes enclosed beach
compartments as well as large coastal embayments
such as Batemans Bay.

Population and settlements
The population of the South East and Tablelands
Region was approximately 261,750 in 2011 (ABS
2012), and is expected to grow to 310,400 by 2031
(Department of Planning & Environment 2014).
The major cities in the region are Goulburn and
Queanbeyan, with regional centres including
Bega, Yass, Cooma, Batemans Bay and Eden.
Public administration, hospitality, retail,
tourism (coasts and ski fields) and primary
industries employ the majority of the
113,800 strong workforce.

                                                                                                                    5
Climate of the region
The topography of the South East and Hot days
Tablelands Region results in a large range
On average, much of the region sees fewer than 10
of climates. It is relatively wet close to the hot days each year. More hot days occur in the north-
coast and Snowy Mountains, and drier western most parts of the region. In contrast there are
inland. It is hot in summer in northern very few days above 35°C in the Snowy Mountains.
inland areas and very cold in winter in
the Snowy Mountains. Milder conditions Cold nights
are found along the coast, with cooler The number of nights per year with minimum
temperatures in summer and warmer temperatures below 2°C varies considerably across
temperatures in winter. the region. Coastal areas experience the least number
of cold nights (fewer than 10 nights per year). There
are more cold nights as you move inland increasing to
Temperature over 90 nights per year in central parts of the region,
and over 200 nights per year in the Snowy mountains.
The region experiences a distinct seasonal variation
in temperature. In summer, average daily maximum
temperatures range from over 30°C in the north-west Rainfall
to below 18°C in the Snowy Mountains. In winter,
the average daily minimum temperature ranges from Rainfall varies considerably across the South East
CU R REN T CL IM ATE
4–8°C at the coast, to 2–6°C in the north-west, and and Tablelands Region. This variability is due to the
–6 to –4°C in the Snowy Mountains. complex interactions between weather patterns in the
region, the influence of larger-scale climate patterns
In summer, average temperatures range from 18–24°C such as El Niño Southern Oscillation, the topography
at the coast and northern parts of the region, to of the Snowy Mountains and Great Dividing Range
10–14°C across the southern elevated areas. In winter, and the influence of sea surface temperature near the
average temperatures range from 8–12°C at the coast.
coast and northern parts of the region to 0–2°C in the
Snowy Mountains.
Temperatures have been increasing since about
1960, with higher temperatures experienced in recent
2-South-East Tableland
decades.
90 30
80
Temperature extremes
Monthly rainfall and temperature
25
70
Temperature extremes, both hot and cold, occur
60 20
infrequently but can have significant impacts on
rainfall
health, infrastructure and our environment. Changes 50
15 Maxim
to temperature extremes often result in greater
40
impacts than changes to average temperatures. Minim
30 10 Mean t
20 Annua
5
10
0 0
1 2 3 4 5 6 7 8 9 10 11 12
Month
Annual
Rainfall Tmax Tmin Tmean Tmean
Figure 1: Seasonal rainfall and temperature variations (AWAP1 data for 1960–1991).
1. Australian Water Availability Project, see www.csiro.au/awap/.
6
3- Illawarra
The Snowy Mountains receives less rainfall during the                Fire weather
summer compared to other seasons. The Monaro and
southern coastal parts of the region receive less rainfall           The risk of bushfire in any given region depends on
in winter due to the passage of southerly cold, moist                four ‘switches’. There needs to be enough vegetation
air being blocked by the Snowy Mountains.                            (fuel), the fuel needs to be dry enough to burn, the
                                                                     weather needs to be favourable for fire to spread,
The annual rainfall ranges from over 1600 mm in the                  and there needs to be an ignition source (Bradstock
Snowy Mountains to 400–600 mm in the Cooma-                          2010). All four of these switches must be on for a fire
Monaro region. The areas around Goulburn and the                     to occur. The Forest Fire Danger Index (FFDI) is used
south-west slopes receive approximately 600–800                      in NSW to quantify fire weather. The FFDI combines
mm, with the coastal strip having 1000–1200 mm of                    observations of temperature, humidity and wind speed
rainfall per year.                                                   with an estimate of the fuel state.
The region has experienced considerable rainfall                     Long-term observations of FFDI come from daily
variability in the past with periods of both wetter and              measurements of temperature, rainfall, humidity and
drier conditions. During much of the first half of the               wind speed at only a small number of weather stations
20th century the region experienced drier conditions.                in Australia, with 17 stations located in NSW and the
The first decade of the 21st century saw a long                      ACT (Lucas 2010).
period of below average rainfall during the Millennium
Drought. This dry period ended with two of the wettest               There are no long-term FFDI stations within the South
years on record for Australia (2010-2011), with 2010                 East and Tablelands Region. The two closest stations
being the third wettest year on record for NSW.                      are Canberra and Nowra (Table 1). These stations have
                                                                     relatively low FFDI compared to more arid inland areas
                                                                     of NSW. Average daily FFDI is 6.9 in Canberra and 5.2
                                                                     in Nowra.
                                                                     Fire weather is classified as ‘severe’ when the FFDI
                                                                     is above 50. FFDI values below 12 indicate low
                                                                     to moderate fire weather, 12-25 high, 25-49 very
                                                                     high, 50-74 severe, 75-99 extreme and above 100
                                                                     catastrophic. Canberra and Nowra have on average
                                                                     1.1 severe fire weather days each year.
 Average FFDI
 Station                       Annual                 Summer            Autumn              Winter             Spring
 Canberra                               6.9                   11.4             7.2                   2.6                6.4
 Nowra                                  5.2                    5.6             4.3                   4.4                6.6
 Number of severe fire weather days (FFDI>50)
 Canberra                               1.1                    0.8             0.2                    0                 0.2
 Nowra                                  1.1                    0.6               0                    0                 0.5

Table 1: Baseline FFDI values for stations closest to the region.

                                                                                                                               7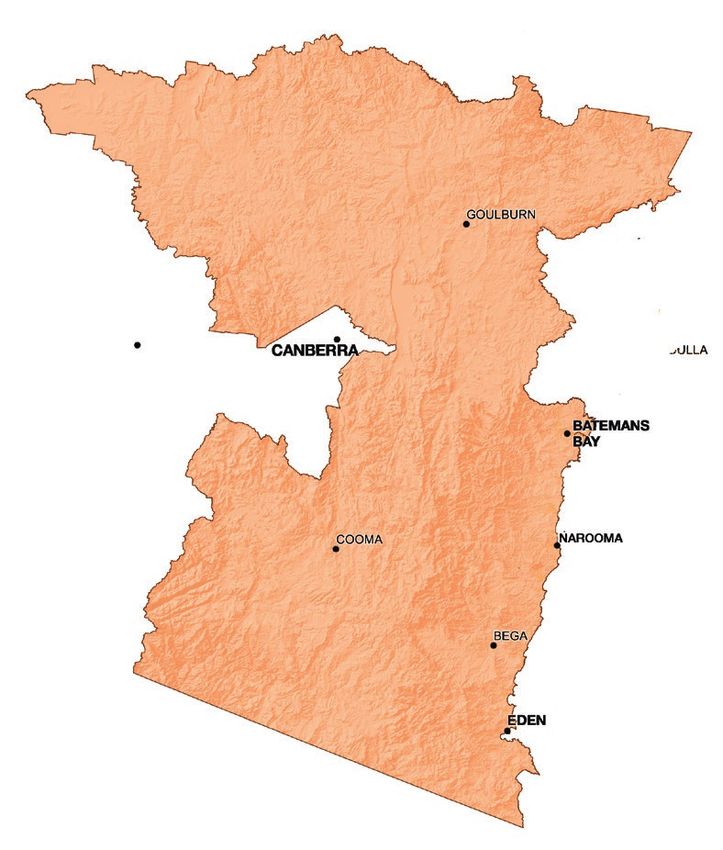
Temperature
                          Climate change projections are presented                Projected regional climate changes
                          for the near future (2030) and far future
                                                                                   he South East and Tablelands Region is
                                                                                  T
                          (2070), compared to the baseline
                                                                                  expected to experience an increase in all
                          modelled climate (1990–2009). The
                                                                                  temperature variables (average, maximum
                          projections are based on simulations from
                                                                                  and minimum) in the near future and far
                          a suite of twelve climate models run to
                                                                                  future (Figure 2).
                          provide detailed future climate information
                          for NSW and the ACT.                                    Maximum temperatures are projected to
                          Temperature is the most reliable indicator of climate   increase by 0.7°C in the near future, up to
                          change. Across the South East and Tablelands Region     2.1°C in the far future. Spring and summer
                          all of the models agree that average, maximum and
                                                                                  will experience the greatest change with
                          minimum temperatures are increasing.
                                                                                  maximum temperatures increasing by up
                                                                                  to 2.4°C by 2070 (Figure 2b). Increased
                              Summary temperature
                                                                                  maximum temperatures are known to impact
                              Maximum temperatures are                            human health through heat stress and by
                              projected to increase in the                        increasing the numbers of heatwave events.
                              near future by 0.7oC
F UT U RE CL IM ATE

                                                                                  Minimum temperatures are projected to
                              Maximum temperatures are                            increase by 0.6°C in the near future and
                              projected to increase in the                        up to 2.0°C in the far future (Figure 2c).
                              far future by 2.1oC                                 Increased overnight temperatures (minimum
                                                                                  temperatures) can have a significant
                              Minimum temperatures are                            effect on human health, especially during
                              projected to increase by                            heatwaves.
                              near future by 0.6oC
                                                                                  The greatest increase in maximum
                              Minimum temperatures are                            temperatures are projected away from the
                              projected to increase by                            coast. Minimum temperatures are projected
                              far future by 2.0oC                                 to increase the most in the Snowy Mountains
                                                                                  and on the south-west slopes and the Upper
                              There are projected to be more hot days             Lachlan (Figures 3–6).
                              and fewer cold nights

                      8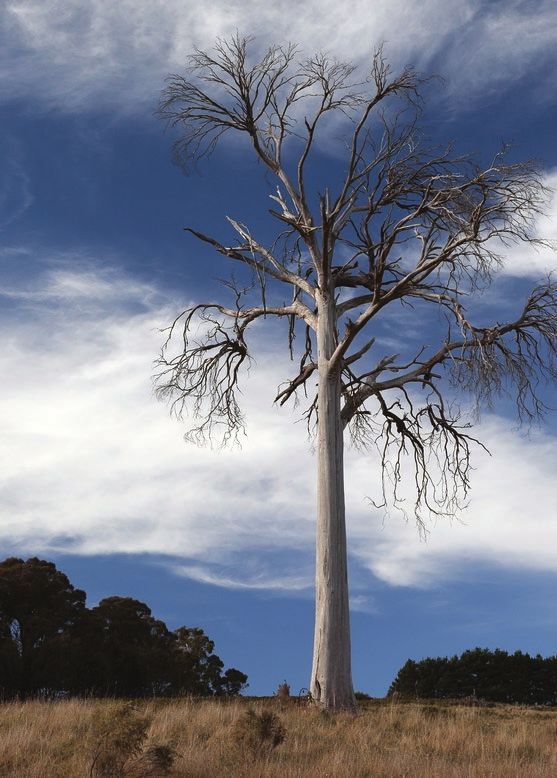
The long-term temperature trend indicates that temperatures in the South
East and Tablelands have been increasing since approximately 1950, with
the largest increases in temperature in the most recent decades.

  a) Average air temperature                      b) Daily maximum temperature                    c) Daily minimum temperature

Figure 2: Projected air temperature changes for the South East and Tablelands Region, annually and by season (2030 yellow; 2070 red):
a) average, b) daily maximum, and c) daily minimum. (Appendix 1 provides help with how to read and interpret these graphs).

 Near future change in maximum temperature                             Far future change in maximum temperature

Figure 3: Near future (2020–2039) change in average                  Figure 4: Far future (2060–2079) change in average
maximum temperature, compared to the baseline period                 maximum temperature, compared to the baseline period
(1990–2009).                                                         (1990–2009).

 Near future change in minimum temperature                             Far future change in minimum temperature

                                                                                                                                   South East
                                                                                                                                   Tablelands
                                                                                                                                   Change in annual
                                                                                                                                   average
                                                                                                                                   temperature (°C)

                                                                                                                                        2.5 – 3.0
                                                                                                                                        2.0 – 2.5
                                                                                                                                        1.5 – 2.0
                                                                                                                                        1.0 – 1.5
                                                                                                                                        0.5 – 1.0
                                                                                                                                        0.0 – 0.5
Figure 5: Near future (2020–2039) change in average                  Figure 6: Far future (2060–2079) change in average
minimum temperature, compared to the baseline period                 minimum temperature, compared to the baseline period
(1990–2009).                                                         (1990–2009).
                                                                                                                                            9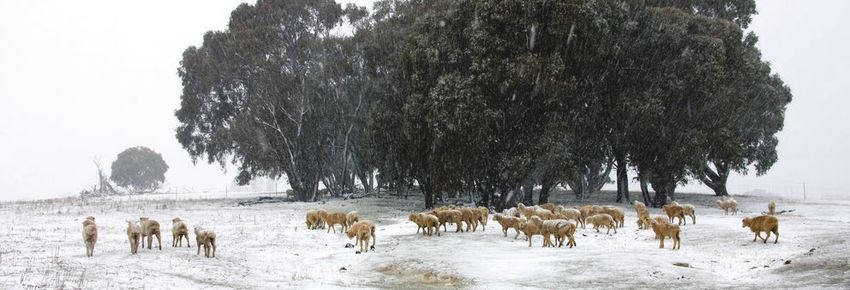
Hot days
                           DAYS PER YEAR ABOVE 35°C

                           Most of the South East and Tablelands Region
                           experiences approximately 10 hot days each year.
                           The exceptions are in the Snowy Mountains where
                           there are very few hot days, and the south-west
                           slopes where there are between 10-30 hot days per
                           year. International and Australian experiences show
                           that prolonged hot days increase the incidence of
                           illness and death – particularly among vulnerable
                           population groups such as people who are older,
                           have a pre-existing medical condition or who have
                           a disability. Seasonal changes in hot days could have
                           significant impacts on bushfire danger, infrastructure
                           development and native species diversity.                Figure 7: Projected changes in the number of hot days (maximum
                                                                                    temperatures above 35°C) for the South East Tableland Region,
                                                                                    annually and by season (2030 yellow; 2070 red). (Appendix 1
                                                                                    provides help with how to read and interpret these graphs).
                           Projected regional climate changes
                           The South East and Tablelands Region is                   Near future change in days per year above 35°C

                           expected to experience more hot days in the
                           near future and the far future (Figure 7).
F UT U RE CL IM ATE

                           The greatest change is projected for the
                           south-west slopes, with an additional
                           5–10 hot days in the near future (Figure 8),
                           increasing to over 30 additional hot days
                           per year by 2070 (Figure 9).

                           The region, on average, is projected to
                           experience an additional three hot days per
                           year in the near future and up to eight more             Figure 8: Near future (2020–2039) projected changes in
                                                                                    the number of days per year with maximum temperatures
                           hot days in the far future (Figure 7).                   above 35°C.

                           These increases in hot days are projected to              Far future change in days per year above 35°C
                           occur mainly in spring and summer although                                                                           South East
                                                                                                                                                Tablelands
                           in the far future hot days are also extending
                                                                                                                                                Change in annual
                           into autumn (Figure 7).                                                                                              average number
                                                                                                                                                of days with
                                                                                                                                                temperatures
                                                                                                                                                above 35°C

                                                                                                                                                     >40
                                                                                                                                                     30 – 40
                                                                                                                                                     20 – 30
                                                                                                                                                     10 – 20
                                                                                                                                                     5 – 10
                                                                                                                                                     1–5
                                                                                                                                                     0–1
                                                                                    Figure 9: Far future (2060–2079) projected changes in the
                                                                                    number of days per year with maximum temperatures
                                                                                    above 35°C.

                      10
Cold nights
DAYS PER YEAR BELOW 2°C
Most of the emphasis on changes in temperatures
from climate change has been on hot days and
maximum temperatures, but changes in cold nights
are equally important in the maintenance of our
natural ecosystems and agricultural/horticultural
industries; for example, some common temperate
fruit species require sufficiently cold winters to
produce flower buds. The Snowy Mountains is also
home to alpine ecosystems reliant on long cold
periods and snow.
In the South East and Tablelands Region, coastal
areas experience the fewest cold days (less than 10
days per year), while there are over 200 cold days Figure 10: Projected changes in the number of low
temperature nights for the South East and Tablelands Region,
each year in the Snowy Mountains. annually and by season (2030 yellow; 2070 red). (Appendix 1
provides help with how to read and interpret these graphs).
Near future change in number of cold nights
Projected regional climate changes (below 2°C) per year
The South East and Tablelands Region is
expected to experience fewer cold nights in
the near future and the far future (Figure 10).
The greatest changes are projected to
occur in the Cooma-Monaro and the Snowy
Mountains, with 10–20 fewer cold nights
in the near future, and over 40 fewer cold
nights by 2070 (Figures 11 and 12). This is a
considerable reduction in cold nights for our
Alpine regions, with the potential to impact Figure 11: Near future (2020–2039) change in the number
our natural ecosystems, snow tourism and of days per year with minimum temperatures below 2°C,
compared to the baseline period (1990–2009).
industry. Fewer decreases are projected
along the coast (Figures 11 and 12). Far future change in number of cold nights
(below 2°C) per year
South East
All models agree that the region as a whole Tablelands
will see a decrease in cold nights with an
Change in average
average of approximately 12 fewer cold number of nights
with temperatures
nights per year by 2030 (ranging from 9–15 less than 2°C
fewer across the individual models) (Figure
-1– 0
10). The decrease in cold nights is projected
-5 – -1
to be even greater by 2070, with an average -10 – -5
of 35 fewer cold nights per year (ranging -20 – -10
-30 – -20
from 27–42 across the individual models).
-40 – -30
< -40
Figure 12: Far future (2060–2079) change in the number
of days per year with minimum temperatures below 2°C,
compared to the baseline period (1990–2009).
11Rainfall
Changes in rainfall patterns have the potential for Projected regional climate changes
widespread impacts. Seasonal shifts can often
impact native species’ reproductive cycles as well as In the South East Tablelands all models
impacting agricultural productivity, for example crops
agree that spring rainfall will decrease in the
that are reliant on winter rains for peak growth.
near future and the far future (Figure 13).
Rainfall changes are also associated with changes in
the extremes, such as floods and droughts, as well The majority of models (8 out of 12) agree
as secondary impacts such as water quality and soil
that autumn rainfall will increase and that
erosion that occur as a result of changes to rainfall
intensity. winter rainfall will decrease in the near future
and the far future (Figure 13).
Modelling rainfall is challenging due to the complexities
of the weather systems that generate rain. ‘Model
agreement’, that is the number of models that agree
Spring rainfall is projected to decrease
on the direction of change (increasing or decreasing across the region. The greatest change is
rainfall) is used to determine the confidence in the projected for the south-west slopes in the
projected change. The more models that agree, the near and far future and the Snowy Mountains
greater the confidence in the direction of change.
in the far future (Figures 14 and 15).
Care should be taken when interpreting changes in
rainfall from averaging climate change projections Autumn rainfall is projected to increase
when the model outputs project changes of both
across the region with the largest increases
F UT U RE CL IM ATE
wetting and drying. To understand the spread of
potential changes in rainfall the bar charts should
around Bega and Eden. Summer rainfall is
be considered along with the maps provided in this projected to increase by 2070 across most
document. of the region except the Snowy Mountains
(Figure 15). Winter rainfall changes vary
Rainfall is projected to across the region.
decrease in spring and winter Seasonal rainfall projections for the near future span
and to increase in autumn both drying and wetting scenarios for summer (–18%
to +20%), autumn (–12% to +38%) and winter (–12%
to +10%). By 2070 the projections are: summer –8%
to +33%, autumn –6% to +45%, and winter –20% to
+11% (Figure 13).
All models agree that spring rainfall will decrease. The
range of decrease spans –1% to –17% in the near
future and –2% to –19% in the far future (Figure 13).
Projections for the region’s annual average rainfall
range from a decrease (drying) of 10% to an increase
(wetting) of 6% by 2030 and still span both drying and
wetting scenarios (–6% to +10%) by 2070.
The South East and Tablelands currently experiences
considerable rainfall variability across the region and
from year-to-year and this variability is also reflected in
Figure 13: Projected changes in average rainfall for the South East the projections.
Tablelands Region, annually and by season (2030 yellow; 2070
red). (Appendix 1 provides help with how to read and interpret
these graphs).
12Summer 2020–2039 Summer 2060–2079
Autumn 2020–2039 Autumn 2060–2079
Winter 2020–2039 Winter 2060–2079
Spring 2020–2039 Spring 2060–2079
South East
Tablelands
Change in average
rainfall (%)
> 30
20 – 30
10 – 20
5 – 10
0–5
-5 – 0
-10 – -5
-20 – -10Fire weather
The Bureau of Meteorology issues Fire Weather Projected regional climate changes
Warnings when the FFDI is forecast to be over 50.
High FFDI values are also considered by the Rural Fire The South East and Tablelands Region
Service when declaring a Total Fire Ban.
is expected to experience an increase in
Average FFDI values are often used to track the status average and severe fire weather in the near
of fire risk. These values can be used when planning
future and the far future (Figures 16 and 17).
for prescribed burns and help fire agencies to better
understand the seasonal fire risk. The FFDI is also
The increases in average and severe fire
considered an indication of the consequences of a fire
if one was to start – the higher the FFDI value the more weather are projected to occur mainly in
dangerous the fire could be. spring and summer.
FFDI values below 12 indicate low to moderate fire
weather, 12-25 high, 25-49 very high, 50-74 severe,
Although the increases in severe fire weather
75-99 extreme and above 100 catastrophic. are relatively small in magnitude (up to two
more days every five years by 2030) they
Average fire weather and severe are projected to occur in prescribed burning
fire weather days are projected periods (spring) and the peak fire risk season
(summer) (Figure 19).
to increase in summer and
spring Autumn is projected to have a decreased
F UT U RE CL IM ATE
severe fire weather days (Figure 19). As fire
Severe fire weather for the weather measurements take into account
region is projected to decrease rainfall, it is likely that the decrease in FFDI is
in autumn due to projected increases in autumn rainfall
across the region (compare Figures 14 and
15 with Figure 19).
Figure 16: Projected changes in the average daily forest fire Figure 17: Projected changes in average annual number of
danger index (FFDI) for the South East and Tablelands Region, days with a forest fire danger index (FFDI) greater than 50 for
annually and by season (2030 yellow; 2070 red). (Appendix 1 the South East and Tablelands Region, annually and by season
provides help with how to read and interpret these graphs). (2030 yellow; 2070 red).
14Summer Autumn
South East
Tablelands
Winter Spring
Change in
average FFDI:
3.0 – 3.5
2.5 – 3.0
2.0 – 2.5
1.5 – 2.0
1.0 – 1.5
0.5 – 1.0
0 – 0.5
0.0
-0.5 – 0
-1.0 – -0.5
-1.5 – -1.0Appendix 1 Guide to reading the maps and graphs
This document contains maps and bar graphs of the climate change projections. The maps present the results
of the twelve models as an average of all twelve models. The bar graphs show projections averaged across the
entire state and do not represent any particular location within the state. The bar graphs also show results from
each individual model. See below for more information on what is displayed in the maps and bar graphs.
How to read the maps How to read the bar graphs
The maps display
a 10km grid. The thin grey lines are the
individual models. There are
NSW has been divided into 12 thin lines for each bar.
State Planning Regions
and each region has a The thick line is the average of
Local Snapshot report. all 12 models for the region.
The colour of each grid The length of the bar shows the
is the average of all spread of the 12 model values
12 models outputs for the region
for that grid.
Each line is the average for the
region. They do not represent a
single location in the region.
Note: The yellow bars represent near future scenarios (2020–2039),
while the red bars represent far future scenarios (2060–2079).
References
ABS 2012, Australian Bureau of Statistics, Canberra.
lanchi, R, Lucas, C, Leonard, F and Finkele, K (2010), ‘Meteorological conditions and wildfire-related house loss
B
in Australia’, International Journal of Wildland Fire, vol. 19, pp. 914–926.
Bradstock, R (2010), ‘A biogeographic model of fire regimes in Australia: current and future implications’, Global
Ecology and Biogeography, vol. 19, pp. 145–158.
epartment of Planning & Environment (2014), NSW Statewide Profile 2014, NSW Department of Planning
D
& Environment, Sydney, available at www.planning.nsw.gov.au/Portals/0/PlanningYourRegion/2014_NSW_
StatewideProfile.pdf.
Evans, J. P., Ji, F., Lee, C., Smith, P., Argüeso, D., and Fita, L. (2014) A regional climate modelling projection
ensemble experiment – NARCliM, Geoscientific Model Development, 7(2), 621-629, doi: 10.5194/gmd-7-621-
2014.
Evans, J.P., F. Ji, G. Abramowitz and M. Ekström (2013) Optimally choosing small ensemble members to produce
robust climate simulations. Environmental Research Letters 8, 044050, DOI: 10.1088/1748-9326/8/4/044050.
Evans, J. P., M. Ekström, and F. Ji (2012) Evaluating the performance of a WRF physics ensemble over South-
East Australia. Climate Dynamics, 39(6), 1241-1258, DOI: 10.1007/s00382-011-1244-5.
Disclaimer: OEH has prepared this report in good faith, exercising all due care and attention, but no representation or
warranty, express or implied, is made as to the relevance, accuracy, completeness or fitness for purpose of this information
in respect of any particular user’s circumstances. With respect to the content of this report, it should also be noted that
some projections currently involve a considerable degree of uncertainty.
This material may be reproduced for educational or non-commercial purposes, in whole or in part, provided the meaning is
unchanged and the source is acknowledged. © Copyright State of NSW and the NSW Office of Environment and Heritage.
Published by: Phone: (02) 9995 5000 (switchboard)
Office of Environment and Heritage Phone: 131 555 (environment information and publications requests)
59–61 Goulburn Street
PO Box A290 Phone: 1300 361 967 (national parks, climate change and energy
Sydney South 1232 efficiency information and publications requests)
Fax: (02) 9995 5999
Report pollution and environmental incidents
TTY users: phone 133 677 then ask for 131 555
Environment Line: 131 555 (NSW only) or
info@environment.nsw.gov.au Speak and Listen users: phone 1300 555 727 then ask for 131 555
Email: info@environment.nsw.gov.au
See also www.environment.nsw.gov.au
Website: www.environment.nsw.gov.au
OEH 2014/0830 – 978 1 74359 830 6
ISSN 1837–5650
November 2014
Printed on environmentally sustainable paperYou can also read