Special Eurobarometer 472 Summary Sport and physical activity - Europa EU
←
→
Page content transcription
If your browser does not render page correctly, please read the page content below
Special Eurobarometer 472

                                        Summary

                Sport and physical activity

                                                                                      Fieldwork
                                                                    December 2017
                                                                                     Publication
                                                                            March 2018
        Survey requested by the European Commission,
  Directorate-General for Education, Youth, Sport and Culture
and co-ordinated by the Directorate-General for Communication

This document does not represent the point of view of the European Commission.
 The interpretations and opinions contained in it are solely those of the authors.

    Special Eurobarometer 472 – Wave EB88.4 – TNS opinion & social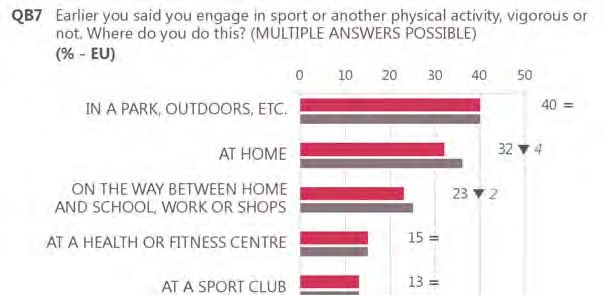
Special Eurobarometer 472

                              Summary

                Sport and physical activity

December 2017

                       Survey conducted by TNS opinion & social at the request of the European Commission,
                                                 Directorate-General for Education, Youth, Sport and Culture
                   Survey co-ordinated by the European Commission, Directorate-General for Communication
                                     (DG COMM “Media Monitoring, Media Analysis and Eurobarometer” Unit)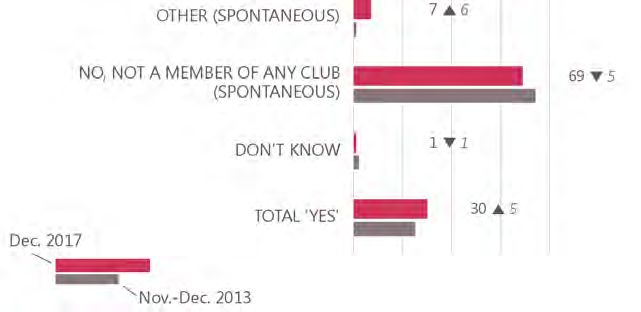
Project number                                                         2018.1461
Project title                Special Eurobarometer 472 - Sport and physical activity
                                                               Executive Summary
Linguistic version                                                          EN PDF
Catalogue number                                              NC-01-18-171-EN-N
ISBN                                                          978-92-79-80243-0
                                                              doi:10.2766/599562
© European Union, 2017

      http://ec.europa.eu/commfrontoffice/publicopinion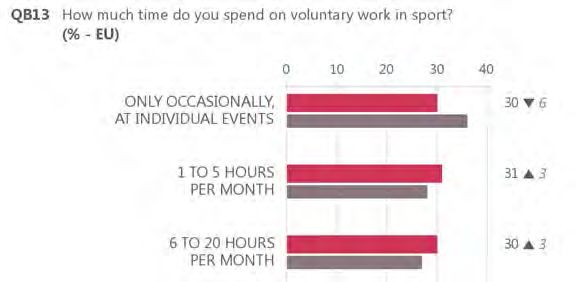
Sport and physical activity

December 2017                                                           Special Eurobarometer 472
                                                                                                    Summary

       TABLE OF CONTENTS
       INTRODUCTION                                                                                       2

       MAIN FINDINGS                                                                                      3

       I.         FREQUENCY AND LEVELS OF ENGAGEMENT IN SPORT AND OTHER PHYSICAL ACTIVITY                 5
             1.        Frequency                                                                          5
                  a.     Exercising or playing sport                                                      5
                  b.     Engaging in other physical activities                                            8
             2.        Levels of engagement                                                              11
                  a.     Vigorous physical activity                                                      11
                  b.     Moderate physical activity                                                      13
                  c.     Walking                                                                         15
                  d.     Sitting                                                                         17

       II.        WHERE CITIZENS ENGAGE IN SPORT AND OTHER PHYSICAL ACTIVITY                             19
             1.        Different settings                                                                19
             2.        Club membership                                                                   21

       III.            UNDERSTANDING MOTIVATORS AND BARRIERS TO SPORT PARTICIPATION                      23
             1.        Motivators                                                                        23
             2.        Barriers                                                                          24

       IV.             SUPPORT FOR SPORT PARTICIPATION IN CITIZENS’ LOCAL AREA                           25
             1.        Opportunities in the local area                                                   25
             2.        Opportunities offered by local sport clubs and other providers                    26
             3.        Local authority provisions                                                        27

       V.         VOLUNTEERING IN SPORT                                                                  28
             1.        Prevalence of volunteering in sport                                               28
             2.        Time spent on volunteering in sport                                               29
             3.        Types of activities of voluntary work in sport                                    30

       CONCLUSION                                                                                        31

                                                                 1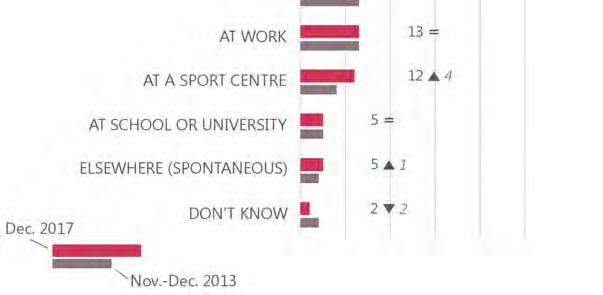
Sport and physical activity
December 2017 Special Eurobarometer 472
Summary
INTRODUCTION
This document presents the results of the Special Eurobarometer public opinion survey on sport and
physical activity in the 28 EU Member States. This follows three previous Eurobarometer surveys on
sport and physical activity, conducted in 2002, 2009 and 2013.
In 2007, the White Paper on Sport was issued by the European Commission as the first policy
document addressing sport on behalf of the European Union. The Lisbon Treaty, in force since
December 2009, introduced a specific article, namely Article 165 TFEU, which gave the EU a new
supporting competence for sport. This article entails provisions for promoting European sporting issues
and calls for EU action to develop the European dimension in sport.
In 2011, the Commission adopted a Communication entitled "Developing the European Dimension in
Sport" providing for specific actions regarding the societal role of sport, the economic dimension of
sport and the organisation of sport. Based on this Communication, the Council adopted a Resolution on
an EU Work Plan for Sport 2011-2014, which further strengthened European cooperation on sport by
setting priorities for EU-level work engaging the Member States and the Commission. To implement the
Work Plan, work at the expert level inter alia focused on providing input to the questionnaire of the
present Special Eurobarometer survey. In 2012, the Council adopted conclusions on promoting health-
enhancing physical activity and on strengthening the evidence-base for sport policymaking, both calling
on the Commission to issue regular surveys on sport and physical activity.
Following a proposal from the Commission, financial support for sport is now included in the form of a
specific chapter in Erasmus+, the EU programme for education, training, youth and sport for the period
2014-2020.
A new EU Work Plan for Sport came into force in July 2017. It sets out the key topics that EU Member
States and the Commission should prioritise up to 2020:
Integrity of sport will focus on good governance, safeguarding minors, fighting match-fixing,
doping and corruption;
The economic dimension, focusing on innovation in sport, and the links between sport and the
digital single market;
Sport and society, focusing on social inclusion, coaches, media, environment, health, education
and sport diplomacy.
This Special Eurobarometer survey will contribute to providing some of the data to support the
developing policy framework for promoting sport and physical activity, as described above. Moreover, it
will allow policymakers, researchers and other interested parties to deliver trend analysis on various
matters compared to previous years.
This survey was carried out by TNS Political & Social network in the 28 EU Member States between 2
and 11 December 2017. Some 28,031 EU citizens from different social and demographic categories
were interviewed face-to-face at home and in their native language, on behalf of the Directorate-
General for Education, Youth, Sport and Culture. The methodology used is that of the Standard
Eurobarometer surveys carried out by the Directorate-General for Communication (“Media Monitoring,
Media Analysis and Eurobarometer analysis” Unit)1. It is the same for all countries and territories
covered in the survey.
1
http://ec.europa.eu/commfrontoffice/publicopinion
2Sport and physical activity
December 2017 Special Eurobarometer 472
Summary
MAIN FINDINGS
Nearly half of Europeans never exercise or play sport, and the proportion has increased
gradually in recent years
Two in five Europeans (40%) exercise or play sport at least once a week, including 7% who do so
regularly (at least five times per week). However, almost half of respondents (46%) never exercise
or play sport.
Levels of participation have not changed substantially since 2013. However, the proportion of those
who never exercise or play sport has increased from 42% to 46%, and this is a continuation of a
gradual trend since 2009.
Less than half of respondents (44%) do some form of other physical activity (such as cycling,
dancing or gardening) at least once a week, while 35% never do this kind of activity at all
(increasing from 30% in 2013).
Overall, in the EU, men exercise, play sport or engage in other physical activity more than women.
This disparity is particularly marked in the 15-24 age group, with young men tending to exercise or
play sport on a regular basis considerably more than young women. The amount of regular activity
that people do tends to decrease with age.
Engagement in sport and physical activity is also less prevalent among people with lower levels of
education and among those with financial difficulties.
The proportion of people who exercise or play sport regularly or with some regularity is highest in
Finland (69%), Sweden (67%) and Denmark (63%). Respondents are least likely to exercise or play
sport in Bulgaria, Greece and Portugal (in each of these countries, 68% never exercise or play sport).
There are several countries where respondents are now much less likely to engage in sport than in
2013: Croatia, Latvia, Austria and Estonia. Levels of engagement have increased in Malta, Bulgaria
and Cyprus.
In a given week, more than half of Europeans do not do any vigorous physical activity, and
around half do not engage in moderate physical activity
When asked about their levels of physical activity within a week, more than half of all respondents
(58%) did not do any vigorous activity (+4pp since 2013) and 47% did not do any moderate
physical activity (+3pp).
15% of Europeans do not walk for 10 minutes at a time at all in a weekly period, while 12%
sit for more than 8.5 hours per day
Most EU citizens (61%) say they walked for at least ten minutes at a time on four or more of the
last seven days. However, 15% did not walk for at least 10 minutes at a time on any day within a
week. These figures are similar to those seen in 2013.
On a usual day, around two thirds of respondents (69%) spend between 2.5 and 8.5 hours sitting,
while 12% sit for more than 8.5 hours and 16% for no more than 2.5 hours.
3Sport and physical activity
December 2017 Special Eurobarometer 472
Summary
Formal sport settings are less popular than informal settings such as parks or outdoors, the
home or the journey between home and work or school
Sport or physical activity takes place in a wide range of locations, most commonly in parks and
outdoors (40%), at home (32%) or on the journey between home and school, work or shops (23%).
These findings are in line with those seen in 2013, although there has been an increase in the
proportion engaging in sport or physical activity at a sport centre (12%, +4pp), while the proportion
doing so at home has decreased (32%, -4pp).
In 17 countries, the most common setting for sport or physical activity is the park or outdoors; this
is highest among respondents in Finland (67%). The home is the most popular setting among
respondents in nine countries, mostly in Eastern Europe.
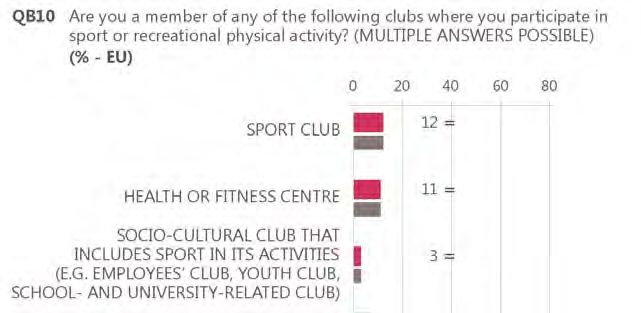
Three in ten EU citizens say that they are members of a club where they participate in sport or
recreational physical activities, specifically a sport club (12%), a health or fitness centre (11%), a
socio-cultural club (3%) or another type of club (7%).
The main motivations for participation in sport or physical activity are improved health and
fitness. Lack of time is the principal barrier.
The most common reasons for engaging in sport or physical activity are to improve health (54%)
and to improve fitness (47%). Other popular reasons include relaxing (38%), having fun (30%) and
improving physical performance (28%).
A lack of time is by far the main reason given for not practising sport more regularly (40%).
Most Europeans think that there are opportunities available locally to be physically active,
but many do not think their local authority does enough
Three quarters of respondents (74%) agree that in their local area there are many opportunities to
be physically active. A similar proportion of them (73%) think that their local sport clubs and other
providers offer such opportunities.
There are mixed views as to whether local authorities do enough to provide their citizens with
opportunities to be physically active: 39% of respondents think that they do not do enough, while
49% think they do. Figures are similar to those seen in 2013.
Views on opportunities for physical activities are most positive in the Netherlands, Denmark,
Sweden and Germany, and are least positive in Bulgaria, Romania, Croatia and Italy.
6% of respondents engage in voluntary work that supports sport activities
Overall, 6% of EU citizens say that they engage in voluntary work that supports sport activities.
There was little change compared with 2013 (-1pp).
Respondents in the Netherlands, Sweden (both 19%) and Denmark (18%) are most likely to engage
in voluntary work.
People who volunteer in sport do a range of different activities, most commonly organising or
helping to run a sporting event (33%), followed by coaching or training (27%).
4Sport and physical activity
December 2017 Special Eurobarometer 472
Summary
I. FREQUENCY AND LEVELS OF ENGAGEMENT IN SPORT AND OTHER PHYSICAL
ACTIVITY
1. Frequency
a. Exercising or playing sport
i. Findings for the EU as a whole
The proportion of Europeans that never exercise or play sport continues to increase. Almost half of
Europeans (46%) say that they never exercise or play sport, while 14% only do so seldom2. Conversely,
40% of them exercise or play sport with at least some regularity, including 7% who exercise or play
sport regularly3. Compared to 2013, the proportion of those who never exercise or play sport has
increased (+4 percentage points, from 42% to 46%), while the proportion that does so seldom has
decreased (from 17% to 14%). This continues the longer-term trend since 2009, when 39% said that
they never exercised or played sport.
QB1 How often do you exercise or play sport?
(% ‐ EU)
Regularly
7 (‐1)
Never
46 (+4) With some regularity
33 (=)
Seldom
14 (‐3)
(Dec. 2017 ‐ Nov.‐Dec. 2013)
Base: All respondents (N=28,031)
ii. Findings by individual countries
There have been some large changes since 2013 in the proportions of people in different countries
that never exercise or play sport. The largest increases can be seen in Croatia (+27pp), Latvia (+17pp),
Austria (+13pp) and Estonia (+12pp).
There are only six countries that have seen a decrease in the proportion that never exercises or plays
sport. The largest decreases are found in Malta (-19pp), Bulgaria (-10pp) and Cyprus (-8pp).
2
QB1 How often do you exercise or play sport? By “exercise”, we mean any form of physical activity which you do in a sport context or sport-
related setting, such as swimming, training in a fitness centre or sport club, running in the park.
3
"Regularly" means the respondent exercises at least 5 times a week; "with some regularity" means 1 to 4 times a week; and "seldom"
means 3 times a month or less often.
5Sport and physical activity
December 2017 Special Eurobarometer 472
Summary
In total, there are 11 countries in which more than half of respondents never exercise or play sport.
Respondents in Bulgaria, Greece and Portugal (all 68%) are the most likely to never exercise or play
sport, followed by respondents in Romania (63%) and Italy (62%).
In the Nordic countries, only small proportions of respondents never exercise or play sport: Finland
(13%), Sweden (15%) and Denmark (20%).
Base: All respondents (N=28,031)
iii. Findings by socio-demographic groups
An analysis of the socio-demographic data reveals strong differences, in line with the 2013 survey:
Men are more likely than women to exercise or play sport: 44% of men do so with at least some
regularity, compared with 36% of women; conversely, 40% of men never exercise or play sport,
compared with 52% of women.
The frequency of exercise or sport tends to decrease with age. A majority of 15-24 year-olds
(62%) exercise or play sport regularly or with some regularity; this falls to 46% in the 25-39 age
group, 39% for 40-54 year-olds and 30% for the 55+ age group.
The difference between men and women is strongest in the younger age groups: just 15% of
men aged 15-24 never exercise or play sport, compared with 33% of women in the same age
group.
A link also appears between education and the frequency of exercise or sport done. The majority
of people who left the education system by the age of 15 or earlier (73%) say they never
exercise or play sport; this falls to 52% of those who ended education at 16-19; and 31% of
those who finished education at the age of 20 or over.
6Sport and physical activity
December 2017 Special Eurobarometer 472
Summary
People in some socio-professional categories are also more likely to exercise or play sport: 26%
of managers never exercise or play sport, compared with 37% in other white-collar jobs, 36% of
self-employed people and 49% of manual workers. A high proportion of housepersons (67%)
never exercises or play sport.
There are differences in relation to the respondent’s financial position: the majority of those who
have difficulties paying bills never exercise or play sport (66% of those who have difficulties
most of the time, and 55% of those who have difficulties from time to time).
QB1 How often do you exercise or play sport?
(% - EU)
Don't know
With some
Regularly
regularity
Seldom
Never
EU28 7 33 14 46 0
Gender
Men 8 36 16 40 0
Women 7 29 12 52 0
Age
15-24 9 53 14 24 0
25-39 6 40 19 35 0
40-54 7 32 17 44 0
55 + 8 22 9 61 0
Gender and Age
Men 15-24 12 59 14 15 0
Men 25-39 6 45 21 28 0
Men 40-54 6 35 20 39 0
Men 55+ 8 22 12 58 0
Women 15-24 6 47 14 33 0
Women 25-39 4 36 17 42 1
Women 40-54 7 29 14 50 0
Women 55+ 7 21 8 64 0
Education (End of)
15- 6 14 7 73 0
16-19 6 27 15 52 0
20+ 9 43 17 31 0
Still studying 10 63 11 16 0
Socio-professional category
Self-employed 7 39 18 36 0
Managers 7 46 20 26 1
Other white collars 4 40 19 37 0
Manual workers 6 29 16 49 0
House persons 5 18 10 67 0
Unemployed 10 26 14 49 1
Retired 8 20 9 63 0
Students 10 63 11 16 0
Difficulties paying bills
Most of the time 4 19 11 66 0
From time to time 5 24 15 55 1
Almost never/ Never 8 37 14 41 0
Base: All respondents (N=28,031)
7Sport and physical activity
December 2017 Special Eurobarometer 472
Summary
b. Engaging in other physical activities
i. Findings for the EU as a whole
Less than half of respondents engage in other physical activities, such as cycling, dancing or gardening.
Respondents are now less likely to engage in other physical activity than they were in 2013. The
proportion that never does this kind of activity has increased (+5pp), while the proportion that does so
with some regularity has decreased (-3pp).
When asked about their engagement in other physical activity (such as cycling, dancing or gardening),
14% of EU citizens say they do this kind of activity regularly, while 30% do so with some regularity.
However, the majority of respondents do this kind of activity seldom (21%) or never (35%)4.
QB2 And how often do you engage in other physical activity such as cycling from one place to another, dancing,
gardening, etc.?
(% ‐ EU)
Regularly
14 (‐1)
Never
35 (+5)
With some regularity
30 (‐3)
Seldom
21 (‐1)
(Dec. 2017 ‐ Nov.‐Dec. 2013)
Base: All respondents (N=28,031)
ii. Findings by individual countries
Looking at individual countries, a clear general geographical pattern appears: the proportion of those
who never engage in other physical activities tends to be higher in countries in Southern Europe than in
Northern Europe.
The proportion of people who engage in other physical activities regularly (at least five times a week)
is the highest in the Netherlands (45%), and is also at a high level in Denmark and Sweden (both 30%).
By contrast, in a number of countries less than one in ten respondents regularly engage in other
physical activities, with the lowest proportions found in Malta, Italy and Portugal (all 5%).
In six countries, more than half of respondents never engage in other physical activities: Malta (68%),
Portugal (64%), Italy (57%), Cyprus (52%), Romania and Spain (both 51%). The proportion of those
who never engage in this kind of activity is lowest in the Netherlands (7%), Sweden (8%), Denmark
(10%) and Finland (11%).
4
"Regularly" means the respondent engages in other physical activity at least 5 times a week; "with some regularity" means 1 to 4 times a
week; and "seldom" means 3 times a month or less often.
8Sport and physical activity
December 2017 Special Eurobarometer 472
Summary
With regards to the evolution of this tendency since 2013, there has been an increase in most
countries in the proportion of people who never engage in other physical activities, most notably in
Croatia (+20pp), Romania (+15pp), Austria (+12pp), Malta (+11pp) and the Czech Republic (+10pp).
There are only four countries where there has been a decrease in the proportion of those who never
engage in this kind of activity: Bulgaria (-6pp), Cyprus (-5pp), Greece (-4pp) and Belgium (-2pp).
Base: All respondents (N=28,031)
iii. Findings by socio-demographic groups
As with exercising or playing sport, strong differences can be observed between socio-demographic
groups when looking at other physical activities:
Men are more likely than women to engage in other physical activities: 31% of men never take
part in this kind of activity, compared with 40% of women.
Older people are less likely to engage in other physical activities: people aged 55 or over are
more likely to say that they never engage in any other physical activity (45%, falling to 33% of
40-54 year olds, 29% of 25-39s, and 25% of 15-24 year olds).
More than half (57%) of people who finished education by the age of 15 say they never engage
in other physical activities. This falls to 37% of those who ended education at 16-19; and 24%
of those who finished education at the age of 20 or over.
Those with financial difficulties are less likely to engage in other physical activities. The
proportion that never does this kind of activity is 49% among those who have difficulties paying
bills most of the time, and 45% among those who have difficulties from time to time, compared
with 31% of those who never or almost never have difficulties.
9Sport and physical activity
December 2017 Special Eurobarometer 472
Summary
Engagement in other physical activities varies depending on subjective urbanisation: respondents
who live in a rural village are more likely to engage in other physical activities (32% say they
never do so), compared with those living in a large town (41%).
There is a strong link between exercise and sport: among those who never exercise or play sport,
the majority (62%) also say that they never participate in other physical activities.
QB2 And how often do you engage in other physical activity such as cycling from one place to
another, dancing, gardening, etc.?
(% - EU)
Don't know
With some
regularity
Regularly
Seldom
Never
EU28 14 30 21 35 0
Gender
Men 15 32 22 31 0
Women 13 28 19 40 0
Age
15-24 17 34 23 25 1
25-39 12 32 26 29 1
40-54 13 31 23 33 0
55 + 14 26 15 45 0
Education (End of)
15- 10 20 13 57 0
16-19 12 28 22 37 1
20+ 16 38 22 24 0
Still studying 19 36 23 21 1
Difficulties paying bills
Most of the time 12 21 17 49 1
From time to time 10 23 22 45 0
Almost never/ Never 15 34 20 31 0
Subjective urbanisation
Rural village 15 33 19 32 1
Small/ mid size town 14 29 22 35 0
Large town 11 27 20 41 1
Exercise or play sport
Regularly 46 26 10 17 1
With some regularity 13 54 20 13 0
Seldom 11 26 53 10 0
Never 10 15 13 62 0
Base: All respondents (N=28,031)
10Sport and physical activity
December 2017 Special Eurobarometer 472
Summary
2. Levels of engagement
a. Vigorous physical activity
i. Findings for the EU as a whole
When asked on how many days they engage in vigorous physical activity, 15% of respondents say they
did vigorous physical activity on at least four of the previous seven days, while 27% did so on one to
three days. However, the majority (58%) of all respondents did not do any vigorous physical activity in
the previous week.
The proportion that did no vigorous activity has increased by 4 pp since 2013. In parallel, there has
been a decrease in the proportion of respondents who did vigorous physical activity (-3 pp) in the
previous week.
QB3a In the last 7 days, on how many days did you do vigorous physical activity like lifting heavy things, digging,
aerobics or fast cycling?
(% ‐ EU)
4 to 7 days
15 (‐1)
None
58 (+4)
1 to 3 days
27 (‐2)
(Dec. 2017 ‐ Nov.‐Dec. 2013)
Base: All respondents (N=28,031)
ii. Findings by individual countries
Findings in many individual countries are similar to the EU28 figures. However, respondents are more
likely to have done vigorous physical activity on at least four of the previous seven days in Germany
(22%), Latvia, Finland and Luxembourg (all 21%). Respondents are most likely to have done vigorous
physical activity on at least one day in Finland (66%), the Netherlands (63%) and Sweden (62%).
Respondents are least likely to have done any vigorous physical activity in Portugal (79% did none in
the previous week), Malta (78%) and Italy (74%). The proportion that did vigorous physical activity on
at least four of the last seven days is the lowest in Italy (5%), Portugal (7%), Bulgaria, Greece and
Malta (all 9%).
11Sport and physical activity
December 2017 Special Eurobarometer 472
Summary
Base: All respondents (N=28,031)
iii. Findings by socio-demographic groups
The differences between socio-demographic groups include:
Men are more likely than women to do vigorous physical activity: 18% of men did so on at least
four of the previous seven days, compared with 11% of women. The proportion who did no
vigorous physical activity is 51% for men and 65% for women.
Older people are less likely to do vigorous physical activity: people aged 55 or over are more
likely to say that they did no vigorous physical activity (71%, falling to 56% of 40-54 year olds,
47% of 25-39s, and 42% of 15-24 year olds).
The difference between men and women is most pronounced in the 15-24 age group: 53% of
women in this age group did no vigorous activity, compared with 31% of men.
Around half (48%) of those who finished education at the age of 20 or over did no vigorous
physical activity in the previous week. This was higher among those who ended education at 16-
19 (60%), and higher still among people who finished education by the age of 15 (77%).
Students (23%) are more likely than respondents from other socio-professional groups to do
vigorous physical activity on four to seven days in the last week. Looking at the occupational
groups, those in manual occupations (22%) are more likely to have done vigorous physical
activity on at least four of the last seven days. This may suggest that, for some respondents, the
activities may be work-related.
12Sport and physical activity
December 2017 Special Eurobarometer 472
Summary
b. Moderate physical activity
i. Findings for the EU as a whole
Respondents were asked on how many days they engage in moderate physical activity. Just under one
in four respondents (23%) say they did moderate physical activity on at least four of the previous
seven days, while 29% did so on one to three days. However, almost half (47%) did not do any
moderate physical activity in the previous week.
The results show a slight decline in the frequency of moderate physical activity since 2013. The
proportion of those who did no moderate physical activity at all in the last week increased by 3 pp,
while there was a corresponding decrease in the proportions that did moderate physical activity
(-3 pp).
QB4a In the last 7 days, on how many days did you do moderate physical activity like carrying light loads, cycling at
normal pace or doubles tennis? Please do not include walking.
(% ‐ EU)
Don't know
1 (=)
4 to 7 days
23 (‐2)
Never
47 (+3)
1 to 3 days
29 (‐1)
(Dec. 2017 ‐ Nov.‐Dec. 2013)
Base: All respondents (N=28,031)
ii. Findings by individual countries
Looking at country level, respondents are most likely to do moderate physical activity on at least four
of the previous seven days in the Netherlands (43%), Denmark (40%) and Germany (39%).
Respondents in Italy (8%), Malta (9%) and Portugal (10%) are the least likely to have done moderate
physical activity on at least four of the last seven days. Furthermore respondents in Malta (76%),
Portugal (72%) and Italy (68%) are also the most likely to say that they did no moderate physical
activity at all.
13Sport and physical activity
December 2017 Special Eurobarometer 472
Summary
Base: All respondents (N=28,031)
iii. Findings by socio-demographic groups
Differences by socio-demographic groups include:
Men are more likely than women to do moderate physical activity: 42% of men did no moderate
physical activity in the previous seven days, compared with 52% of women.
Older people are less likely to do moderate physical activity: people aged 55 or over are more
likely to say that they did no moderate physical activity in the previous seven days (56%, falling
to 46% of 40-54 year olds, 41% of 25-39 year olds, and 35% in 15-24 age group).
The difference between men and women is most pronounced in the 15-24 age group: 43% of
women in this age group did no moderate activity, compared with 26% of men.
There is a link between education and moderate physical activity. While 66% of people who left
the education system by the age of 15 say they did no moderate physical activity in the previous
week, this falls to 50% of those who ended education at 16-19, and 37% of those who finished
education at the age of 20 or over.
Those with financial difficulties are less likely to engage in moderate physical activity. The
proportion that never does this kind of activity is 61% among those who have difficulties paying
bills most of the time, and 56% among those who have difficulties from time to time, compared
with 43% of those who never or almost never have difficulties.
There is a difference by type of urbanisation: respondents who live in a rural village are more
likely to engage in moderate physical activity (43% say they never do so), compared with those
living in a large town (52%).
14Sport and physical activity
December 2017 Special Eurobarometer 472
Summary
c. Walking
i. Findings for the EU as a whole
Respondents were asked how many days they walked for at least ten minutes at a time in the previous
seven days. Around six out of ten (61%, +1 pp) say they walked for at least ten minutes at a time on
four or more days in the previous week, while 23% (-3 pp) say they walked for this amount of time on
one to three days. However, around one in seven EU citizens (15%, +2 pp) say they did not walk for ten
minutes at a time on any day during the previous week.
QB5a In the last 7 days, on how many days did you walk for at least 10 minutes at a time?
(% ‐ EU)
Don't know Never
1 (=) 15 (+2)
1 to 3 days
23 (‐3)
4 to 7 days
61 (+1)
(Dec. 2017 ‐ Nov.‐Dec. 2013)
Base: All respondents (N=28,031)
ii. Findings by individual countries
The countries where people are most likely to walk for ten minutes or more on at least four days per
week are Spain (74%), the UK (72%), Bulgaria, Germany (both 70%), Luxembourg and Estonia (both
69%).
By contrast, there are five countries where less than half of respondents have walked for ten minutes
or more on at least four days: Cyprus (37%), Italy, Belgium (both 46%), Portugal (47%) and Austria
(48%).
Base: All respondents (N=28,031)
15Sport and physical activity
December 2017 Special Eurobarometer 472
Summary
iii. Findings by socio-demographic groups
Socio-demographic differences include:
Younger people are more likely to walk for ten minutes or more. The proportion that does this on
at least four days per week ranges from 70% of 15-24 year olds to 57% of those aged 55+. The
proportion that did not walk for ten minutes or more at all is 8% among 15-24s, rising to 19%
among the 55+ age group.
There are no significant differences by gender.
People who left the education system by the age of 15 are less likely to walk for ten minutes or
more at a time: 23% did not do this at all in the previous week, compared with 15% of those
who ended education at 16-19, and 10% of those who finished education at the age of 20 or
over.
There is a link between walking and exercising or playing sport. Respondents who exercise or
play sport regularly are more likely to walk for ten minutes or more at least four days a week
(84%). At the other extreme, those who do not exercise or play sport at all are less likely to walk
for ten minutes or more at a time (24% did not do so at all in the previous week).
QB5a In the last 7 days, on how many days did you walk for at least 10 minutes at a time? (DO NOT
SHOW SCREEN - DO NOT READ OUT)
(% - EU)
Don't know
1 to 3 days
4 to 7 days
Average
Never
EU28 15 23 61 1 4.4
Gender
Men 15 24 60 1 4.3
Women 15 22 62 1 4.4
Age
15-24 8 21 70 1 4.9
25-39 11 22 66 1 4.7
40-54 15 24 60 1 4.3
55 + 19 23 57 1 4.0
Education (End of)
15- 23 21 56 0 3.9
16-19 15 24 60 1 4.3
20+ 10 23 66 1 4.7
Still studying 8 19 72 1 4.9
Exercise or play sport
Regularly 5 10 84 1 5.7
With some regularity 6 27 67 0 4.7
Seldom 11 31 58 0 4.2
Never 24 19 56 1 3.9
Base: All respondents (N=28,031)
16Sport and physical activity
December 2017 Special Eurobarometer 472
Summary
d. Sitting
i. Findings for the EU as a whole
When asked about the amount of time they spend sitting on a usual day, around one in eight
respondents (12%) say they sit for more than 8 hours and 30 minutes, while 29% spend between 5
hours 31 minutes and 8 hours 30 minutes sitting (+3 pp). Two in five (40%) sit for between 2 hours 31
minutes and 5 hours 30 minutes (-3 pp), while one in six (16%) only sit for 2 hours 30 minutes or less.
ii. Findings by individual countries
Looking at country level, respondents are more likely to spend 2 hours 30 minutes or less sitting down
in Romania (31%), followed by those in Portugal (23%), Cyprus and Poland (both 22%).
At the other end of the scale, respondents are more likely to spend more than 8 hours 30 minutes per
day sitting down in the Netherlands (32%), Denmark (23%), the Czech Republic (21%), Sweden (20%)
and Greece (19%).
Base: All respondents (N=28,031)
It is notable that in some of the countries where respondents spend a long time sitting down, the
proportion of citizens who exercise or play sport on a regular basis tends to be high (e.g. Denmark, the
Netherlands and Sweden). By contrast, some countries have high proportions of respondents who never
or seldom exercise or play sport, despite seeing low average times for sitting down (e.g. Portugal and
Romania).
iii. Findings by socio-demographic groups
Variations by socio-demographic characteristics include:
Respondents in the middle age bands tend to spend less time sitting down: 20% of those aged
25-39 and 19% of those aged 40-54 spend 2 hours 30 minutes or less sitting down on a usual
day, compared with 12% of 15-24 year olds and 14% of those aged 55 or over. Those aged
15-24 are most likely to sit for more than 5 hours 30 minutes (51% compared with 38-41% in
the older age groups).
17Sport and physical activity
December 2017 Special Eurobarometer 472
Summary
People in white collar occupations tend to spend more time sitting down. The proportion that
spends more than 8 hours 30 minutes per day sitting down is 17% among managers and 19%
among other white collar workers. The proportion is also relatively high among students (17%).
People who never walk for more than ten minutes at a time are more likely to spend more than
8 hours 30 minutes per day sitting down (20% vs 10% of those who walked 4 to 7 times in the
last week).
For the EU as a whole, however, there is a slight tendency for people who exercise or play sport
to spend less time sitting. For example, 6% of those who exercise or play sport regularly spend
more than 8.5 hours per day sitting, compared with 13% of those who do not exercise or play
sport at all.
QB6 How much time do you spend sitting on a usual day? This may include time spent at a desk,
visiting friends, studying or watching television.
(% - EU)
8h31 min or more
2h31 min to 5h30
5h31 min to 8h30
2h30 min or less
Don't know
min
min
EU28 16 40 29 12 3
Age
15-24 12 35 37 14 2
25-39 20 40 28 10 2
40-54 19 40 27 11 3
55 + 14 42 29 12 3
Socio-professional category
Self-employed 19 44 25 9 3
Managers 13 33 35 17 2
Other white collars 11 30 38 19 2
Manual workers 27 48 18 4 3
House persons 25 45 21 7 2
Unemployed 15 45 27 9 4
Retired 12 43 29 13 3
Students 8 30 43 17 2
Walked at least 10 min in a week
1-3 days 17 38 30 12 3
4-7 days 16 44 29 10 1
Never 16 31 28 20 5
Base: All respondents (N=28,031)
18Sport and physical activity
December 2017 Special Eurobarometer 472
Summary
II. WHERE CITIZENS ENGAGE IN SPORT AND OTHER PHYSICAL ACTIVITY
1. Different settings
i. Findings for the EU as a whole
Among respondents who exercise, play sport or engage in other physical activities, most of their
activities take place in informal settings, such as parks and outdoors (40% of respondents engage in
sport or physical activity there), at home (32%) or on the journey between home and school, work, or
shops (23%).
These findings are similar to those seen in the 2013 survey, although there has been an increase in the
proportion engaging in sport or a physical activity at a sport centre (+4 pp), while the proportion doing
so at home has decreased (-4 pp).
Base: Respondents who exercise, play sport or engage in other physical activity (N= 19,982)
ii. Findings by individual countries
The country-level data reveal different preferences for the settings in which people choose to engage
in sport or physical activity.
In the EU overall, the most common setting is a park or outdoors (40%), and this is the most popular
answer in 17 individual countries (from 67% in Finland to 34% in the United Kingdom). The home is
the preferred setting among respondents in nine countries, while in two countries (Greece, 42% and
Malta, 31%) the most popular setting is on the way between home and school, work or shops.
The patterns for the different countries are similar to those seen in the 2013 survey.
19Sport and physical activity
December 2017 Special Eurobarometer 472
Summary
QB7 Earlier you said you engage in sport or another physical activity, vigorous or not. Where do you do this?
(MULTIPLE ANSWERS POSSIBLE)
(% ‐ THE MOST MENTIONED ANSWER BY COUNTRY)
67
62
60 59 59
54 53 54
52 51 51 50 49
48 47
44 43 42 42 41 41 41 42
40 40
35 34
32 31
FI AT ES SE EE SI LU IE DK PT BE PL NL CZ EU28 FR IT UK SK RO HU LT LV HR BG DE CY EL MT
In a park, outdoors, etc. At home On the way between home and school, work or shops
Base: Respondents who exercise, play sport or engage in other physical activity (N= 19,982)
iii. Findings by socio-demographic groups
The differences between socio-demographic groups include:
Younger people are more likely to use formal settings; for example, the proportion using a health
or fitness centre ranges from 22% among 15-24 year olds to 10% among those aged 55 or
over. The use of sport clubs and sport centres is particularly high among men aged 15-24 (26%
and 22% respectively). School or university is also a popular location for younger people (24% of
15-24 year olds).
The use of formal settings is higher among those who spent more time in education. While 18%
of people who ended education at the age of 20 or above engage in sport or physical activity in
a health or fitness centre, this falls to 12% among those who ended education between the age
of 16 and 19, and to 7% among those who finished education by the age of 15.
People living in rural areas are more likely to engage in sport or physical activity at home (40%,
compared with 29% of those in small or medium size towns, and 27% of those in large towns).
By contrast, those living in large towns are more likely to use health or fitness centres (20%,
compared with 13% of those in small or medium size towns and 13% of those in rural areas).
20Sport and physical activity
December 2017 Special Eurobarometer 472
Summary
2. Club membership
i. Findings for the EU as a whole
Three in ten respondents (30%) say that they are members of a club where they participate in sport or
recreational physical activity. Specifically, 12% of respondents are members of a sport club, while 11%
belong to a health or fitness centre. In addition, 3% are members of socio-cultural clubs that include
sport in its activities, such as an employees’ club, a youth club or a club related to school or university.
A further 7% say they are a member of another type of club.
The overall proportion of EU citizens who are members of any club (30%) is higher than in 2013
(24%). However, this is entirely due to an increase in the proportion of respondents saying that they
are members of other types of club (+6 pp), as the figures for sport clubs, health or fitness centres and
socio-cultural clubs have remained unchanged from 2013.
Base: All respondents (N=28,031)
ii. Findings by individual countries
The club membership figures vary considerably between the different EU Member States. Sport clubs
are the most common type of club in 10 countries, with the highest proportion seen in the Netherlands
(27%). In the other 18 countries, respondents are more likely to belong to a health or fitness centre,
most notably in Sweden (41%).
21Sport and physical activity
December 2017 Special Eurobarometer 472
Summary
QB10 Are you a member of any of the following clubs where you participate in sport or recreational physical activity?
(MULTIPLE ANSWERS POSSIBLE)
(% ‐ THE MOST MENTIONED ANSWER BY COUNTRY)
41
27
23 24
18 18 17
16 16
13 13 14 13
12 12 11
9 10 10 10 9
7 8 7 7
5 6 5 5
NL DE LU BE FR EE EU28 SI MT LT LV SE DK IE UK AT FI CY EL ES PT CZ SK HU IT PL HR BG RO
Sport club Health or fitness centre
Base: All respondents (N=28,031)
iii. Findings by socio-demographic groups
Socio-demographic variations include:
Men are more likely than women to be members of a sport club (16% compared with 8%).
Young people are more likely than older people to be members of a sport club (20% of 15-24
year olds, falling to 8% of those aged 55 or over), as well as of a health or fitness centre
(ranging from 18% of those aged 15-24 to 6% of those aged 55+).
Membership at a sport club is high among young men (29% of men aged 15-24, falling to 10%
of men aged 55 or over). The age difference is much less pronounced for women (11% of
women aged 15-24 are members at a sport club, falling to 6% of those aged 55+).
There is a link between membership at clubs and level of education. Those who finished
education at the age of 20 or above are more likely to be members at a club of some kind
(40%), than those who ended education at the age of 16-19 (24%) and those who finished
education by the age of 15 (18%). This pattern applies to membership at both sport clubs and
health or fitness centres.
22Sport and physical activity
December 2017 Special Eurobarometer 472
Summary
III. UNDERSTANDING MOTIVATORS AND BARRIERS TO SPORT PARTICIPATION
1. Motivators
Key findings
Improving health and fitness are the main considerations for EU citizens when engaging in sport or
physical activity. In the EU as a whole, the most common reason for engaging in sport or physical
activity is to improve health (54%), and this is also the most frequent response in 22 individual
countries. The other most commonly cited reasons for engaging in sport or physical activity are to
improve fitness (47%), followed by relaxation (38%), to have fun (30%) and to improve physical
performance (28%).
There have been some changes since the 2013 survey. Respondents are less likely to say they engage
in sport or physical activity in order to improve their health (-8 pp), although this remains the most
common response. They are more likely to mention doing this to improve fitness (+7 pp) and to
improve physical performance (+4 pp).
Base: Respondents who exercise, play sport or engage in other physical activity (N= 19,982)
Variations across socio-demographic groups include:
Men are more motivated by having fun (33% compared with 28%), being with friends (22%
compared with 16%) and by competition (8% compared with 2%).
A number of factors are more likely to be mentioned by younger respondents, including
improving physical appearance (29% of 15-24 year olds, falling to 12% of those aged 55 or
over), having fun (ranging from 44% for those aged 15-24 to 23% for those aged 55+) and
being with friends (33%, falling to 15%).
By contrast, older people are more likely than younger people to mention improving their health
(57% of people aged 55 or over, compared with 49% of those aged 15-24) and counteracting
the ageing process (25% compared with 3%).
23Sport and physical activity
December 2017 Special Eurobarometer 472
Summary
2. Barriers
Key findings
In the EU as a whole, lack of time is the most mentioned reason for not practising sport more regularly
(by 40% of respondents), followed by lack of motivation or interest (20%), having a disability or illness
(14%), the fact that it is too expensive (7%), a dislike of competitive activities (6%) and fear of the risk
of injuries (5%). Lack of time is also the most common reason mentioned in every EU Member State
for not practising sport more often.
The findings are very similar to those observed in the 2013 survey, although there have been small
decreases in the proportions mentioning lack of time (-2 pp) and expensiveness (-3 pp), while
respondents are now a bit more likely to say that they are already doing sport regularly (+3 pp).
Base: All respondents (N=28,031)
24Sport and physical activity
December 2017 Special Eurobarometer 472
Summary
IV. SUPPORT FOR SPORT PARTICIPATION IN CITIZENS’ LOCAL AREA
1. Opportunities in the local area
Key findings
Around three in four EU citizens (74%) either totally agree (31%) or tend to agree (43%) that their
local area provides them with opportunities to be physically active. However, 19% of respondents
either tend to disagree (13%) or totally disagree (6%) that this is the case. A further 7% say they do
not even know if their area offers them opportunities.
The overall proportions of respondents that agree or disagree with the statement are similar to those
seen in the 2013 survey. However, there has been a larger decrease in the proportion that totally agree
(-8 pp), while the proportion that tend to agree has increased (+6 pp). This indicates that attitudes are
now slightly less positive than in 2013.
QB11.1 To what extent do you agree or disagree with the following statements about sport and physical activity?
The area where you live offers you many opportunities to be physically active
(% ‐ EU)
Don't know
Totally disagree 7 (+3)
6 (‐1)
Totally agree
31 (‐8)
Tend to disagree
13 (=)
Tend to agree
43 (+6)
(Dec. 2017 ‐ Nov.‐Dec. 2013)
Base: All respondents (N=28,031)
Moreover, perceptions of local opportunities to be physically active vary considerably between different
countries. In some countries, large majorities of respondents agree that their local area offers them
many opportunities: the Netherlands (94%), Denmark (91%), Sweden (88%), France and Germany
(both 87%); the majority of respondents even totally agree with this statement in the Netherlands
(66%), Denmark (64%) and Sweden (61%). By contrast, more than one in three respondents disagree
that they have many opportunities in their area in Bulgaria (51%), Romania (43%), Malta (36%) and
Croatia (35%).
Overall, agreement amongst respondents that their local area offers many opportunities to be
physically active has increased in seven countries, but has decreased in 21 countries since 2013.
25Sport and physical activity
December 2017 Special Eurobarometer 472
Summary
2. Opportunities offered by local sport clubs and other
providers
Key findings
The majority of EU citizens (73%) either totally agree (29%) or tend to agree (44%) that their local
sport clubs and other providers give them many opportunities to be physically active. However, 18% of
respondents tend either to disagree (13%) or totally disagree (5%).
Once again, there has been a large decrease in the proportion of respondents who totally agree (-7
pp), while the proportion that tends to agree has increased (+6 pp). However, overall levels of
agreement (-1 pp) and disagreement (-1 pp) are stable.
QB11.2 To what extent do you agree or disagree with the following statements about sport and physical activity?
Local sport clubs and other local providers offer many opportunities to be physically active (% ‐ EU)
Don't know
9 (+2)
Totally disagree
5 (‐2) Totally agree
29 (‐7)
Tend to disagree
13 (+1)
Tend to agree
44 (+6)
(Dec. 2017 ‐ Nov.‐Dec. 2013)
Base: All respondents (N=28,031)
The patterns for individual countries are similar to the previous question. The highest levels of
agreement in relation to the opportunities offered by local sport clubs and other providers are
observed in the Netherlands (94%), Sweden (91%) and Denmark (90%), followed by France, Germany
and Belgium (all three 85%).
Respondents are the most likely to disagree that clubs and providers offer many opportunities in
Romania (45%), Bulgaria (41%), Croatia (37%), Greece (34%), Cyprus (33%) and Italy (30%).
26Sport and physical activity
December 2017 Special Eurobarometer 472
Summary
3. Local authority provisions
Key findings
There are more mixed views (compared to the two previous statements) as to whether local authorities
do enough to provide their citizens with opportunities to be physically active: 39% agree that they do
not do enough, while 49% disagree.
The proportion of those who totally agree that local authorities do not do enough has slightly
decreased since 2013 (-3 pp), alongside a small increase in the proportion of those who tend to agree
(+3 pp). There has also been a small decrease in the proportion of those who say they tend to disagree
(-3 pp).
QB11.3 To what extent do you agree or disagree with the following statements about sport and physical activity?
Your local authority does not do enough for its citizens in relation to physical activities (% ‐ EU)
Don't know
Totally agree
12 (+3)
10 (‐3)
Totally disagree
20 (=) Tend to agree
29 (+3)
Tend to disagree
29 (‐3)
(Dec. 2017 ‐ Nov.‐Dec. 2013)
Base: All respondents (N=28,031)
When looking at country level, a majority of respondents in four countries think that their local
authority is not doing enough: Italy (55%: 12% totally agree; 43% tend to agree), Poland (53%: 10%
totally agree; 43% tend to agree), Romania (52%: 18% totally agree; 34% tend to agree) and Spain
(51%: 17% totally agree; 34% tend to agree).
By contrast, views are the most positive in Germany (where 71% disagree), the Netherlands (69%),
Finland (68%) and Denmark (64%).
27Sport and physical activity
December 2017 Special Eurobarometer 472
Summary
V. VOLUNTEERING IN SPORT
1. Prevalence of volunteering in sport
Key findings
In total, 6% of EU citizens (-1 pp since the 2013 survey) engage in volunteering to support sporting
activities.
At Member State level, highest proportions of respondents volunteer in sport in the Netherlands,
Sweden (both 19%) and Denmark (18%). Relatively high figures can also be seen in Luxembourg
(12%), Finland (11%), Ireland and Slovenia (both 10%).
Volunteering in sport is least common among respondents in Portugal (1%), Italy, Romania (both 2%),
Lithuania, Slovakia, Greece, Poland, Bulgaria and Croatia (all 3%). These are also countries where a
lower proportion of people exercise or play sport on a regular basis.
In most countries, the level of volunteering in sport has remained substantially stable since 2013.
Base: All respondents (N=28,031)
28Sport and physical activity
December 2017 Special Eurobarometer 472
Summary
2. Time spent on volunteering in sport
Key findings
Three in ten respondents (30%) who give their time to volunteering in sport only do so on an
occasional basis. A similar proportion of people spend between one and five hours per month (31%)
volunteering in sport. However, 39% of respondents devote at least six hours of their time each month
to volunteering in sport, including 9% who spend 21 hours or more.
The amount of time that people spend volunteering in sport is slightly higher than was recorded in
2013. The proportion who only do so occasionally has decreased (-6 pp), with a corresponding increase
in the proportions who spend between one and five hours per month (+3 pp) and those who spend 6 to
20 hours per month (+3 pp).
Base: Respondents who engage in voluntary work that supports sporting activities (N= 1,602)
29Sport and physical activity
December 2017 Special Eurobarometer 472
Summary
3. Types of activities of voluntary work in sport
Key findings
People who volunteer in sport do a range of different activities. The most common activity is
organising or helping to run a sporting event (33%), followed by coaching or training (27%). Other
common activities include being a member of a board or committee (21%), supporting day-to-day club
activities (20%) and doing administrative tasks (18%).
There have been some small changes in the findings since 2013: respondents are now more likely than
in 2013 to say they are a referee or other official (12%, +3 pp), but are less likely to provide transport
(10%, -5 pp).
Base: Respondents who engage in voluntary work that supports sporting activities (N= 1,602)
30Sport and physical activity
December 2017 Special Eurobarometer 472
Summary
CONCLUSION
Despite the growing importance attached to the promotion of physical activity in EU Member States, an
earlier Eurobarometer survey in 2009 identified “alarmingly high” rates of physical inactivity in the EU.
Since then, the proportion of Europeans that never exercise or play sport has increased even further,
from 39% in 2009 to 42% in 2013 and 46% in 2017.
Declining levels of participation are also evident in both vigorous and moderate physical activities,
while respondents also typically spend longer sitting than in 2013. Such findings might indicate that
the message about the importance of sport and physical activity for an individual's health and well-
being has still not got through to significant segments of the EU population.
The survey also indicates socio-demographic variations. For instance, women (in particular in the
younger age groups) are far less active than their male counterparts, while participation is generally
much lower in the older age groups.
It is also notable that participation levels are much lower among those who have lower levels of
education, and among those in more difficult financial situation. A recent OECD report5 found close
links between low income and poor health, and these findings suggest that lower levels of engagement
in sport and physical activity are part of this pattern.
As in previous surveys, the results show large disparities among EU Member States on many questions.
The more physically active countries tend to be clustered in the Northern part of the EU (particularly
the Nordic countries), while the lowest proportions of active Europeans can be found in the Southern
EU Member States. These variations are likely to reflect the facilities and infrastructure available, as
the same country patterns apply when respondents were asked about opportunities for physical
activity.
This new edition of the survey also confirms that most sport or physical activity takes place in informal
settings – in parks and outdoors, at home, or on the journey between home and school, work or shops,
as well as at work or at school or university. This suggests that such opportunities to engage in
physical activity should be promoted alongside the practice of sport and physical activity in organised
settings – particularly given the lower participation rates among those with financial difficulties, who
may struggle to afford membership of formal sport facilities.
Finally, the proportion of EU citizens who engage in voluntary work that supports sporting activities
remains quite low (6% in 2017, compared to 7% in 2013), despite the many different types of work
volunteers engage in. Strategies to increase volunteering in sport could therefore insist on the fact that
there are numerous ways in which different people can get involved.
5
https://www.oecd.org/els/soc/cope-divide-europe-2017-background-report.pdf
31You can also read