The consumer mobile experience - Measuring the consumer experience of using Android mobile services
←
→
Page content transcription
If your browser does not render page correctly, please read the page content below
The consumer mobile experience
Measuring the consumer experience of using Android
mobile services

RESEARCH REPORT
Publication Date: 9 May 2018
About this document
Ofcom has researched consumers’ experience of using mobile phones by collecting data from a
panel of Android smartphone users who have installed an app on their phone. The app collects
information about how people use their device, measures the performance of services used, and
asks the user about their perception of the quality of the connection. In this report we publish
findings from data collected between September and December 2017. We report a range of metrics
including the share of connections across 3G, 4G and wifi, the failure rates for data and voice
connections, the speed of the most popular data applications, and consumer satisfaction.
Contents
Main report
1. Executive Summary                             1
2. Introduction                                  3
3. Network share                                 7
4. Data service availability                     12
5. Data performance                              14
6. Voice performance                             21
7. Overall satisfaction and service importance   22

Annexes
A1. Technical Methodology
A2. Statistical Methodology
The consumer mobile experience

1. Executive summary
To gain insight into the consumer experience of using mobile phones we set up a panel of mobile
users who downloaded an application on to their Android1 mobile phone. The app collects
information about how they use their device, measures the performance of app services used, and
asks the user about their perception of the quality of the connection. This enables us to get insight
into the consumer experience of using mobile phones, and how this varies by a number of factors
including geographical location, network technology, time of day, application and mobile network
used.
In this report we provide the findings from the second phase of the Consumer Mobile App research
project, based on data collected in September-December 2017.
This research is part of a wider programme of work by Ofcom to research and provide information
about mobile quality of service. The data in this report relate to performance when network
coverage is available from an operator; however, the most important determinant of consumer
experience is the availability of a mobile signal and the quality of this signal. Ofcom’s broadband and
mobile checker app provides detailed information about mobile coverage from all four mobile
network operators across the UK.
Key findings
    •    Three-quarters of the time, data connections were made to a wifi rather than to a cellular
         network. For 75% of the time Android users with access to 4G mobile technology were using
         apps, they were connected to wifi. There were no significant differences in this measure by
         rurality or nation. Consumers on the Three and EE mobile networks spent significantly less
         time on wifi than those on the O2 or Vodafone mobile networks.

    •    When accessing a cellular network, a 4G network was available for data use for more than
         80% of the time. When consumers used a data application on a mobile network, 81% of this
         time was spent on a 4G network, with consumers in urban areas spending significantly more
         time than those in rural areas on 4G networks (83% vs. 73%).

    •    There were some variations by mobile network in the amount of time that consumers
         were connected to different mobile technologies. Consumers on the Three mobile network
         were connected to 4G for 66% of the time, whereas consumers on the EE mobile network
         were connected to 4G for 92% of the time.

    •    3G data connections were around five times as likely to fail as 4G data connections.
         Consumers with access to 4G mobile technology were able to successfully connect to a 4G
         network on 98.7% of occasions when they attempted to do so. However, the successful
         connection rate was significantly lower when they tried to use a 3G network (93.1% of
         occasions).

1Our research does not include iPhones as it requires the running of passive tests which is not possible on the iPhone
operating system (iOS).
                                                                                                                         1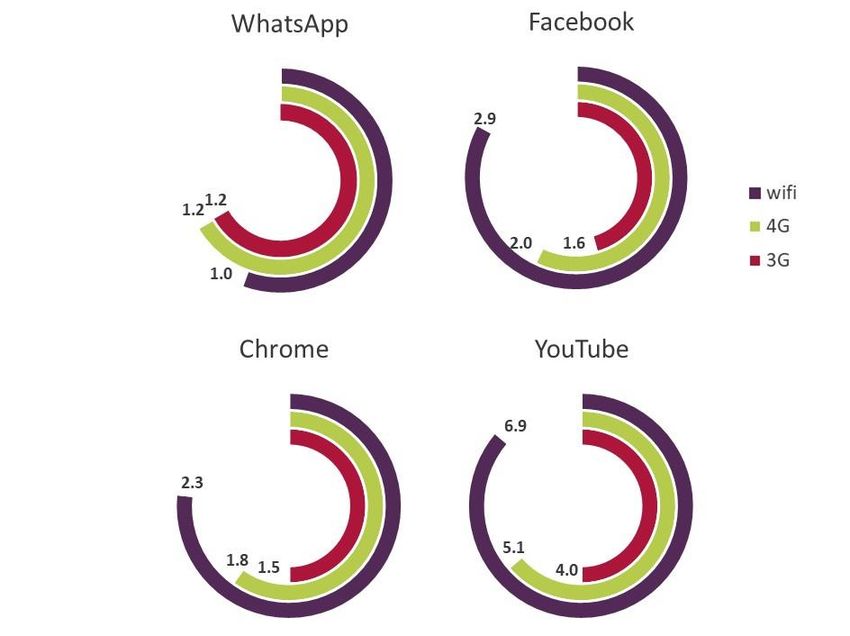
The consumer mobile experience

    •   Data connections were more likely to fail in peak periods. There was a strong correlation
        between the number of data connection tests per hour and the percentage of failed tests,
        for users connected to both 3G and 4G networks, with the proportion of failed tests higher
        on 3G networks. In peak periods, once initiated, the average failure rate for 4G data
        connections was 1.5%; for 3G connections it was 7.2%.

    •   The average download speed delivered varied significantly by application. The average
        speed of connections to Chrome, Facebook, Gmail, Twitter and WhatsApp were all less than
        1Mbit/s, whether the connection was via wifi, 4G or 3G. YouTube and Google Play Store
        connections were between 2.7Mbit/s and 3.0Mbit/s over wifi and 4G, with 3G connections
        significantly slower. These average speeds are all sufficient to give a satisfactory user
        experience; for example, the speed required for the lowest video quality on YouTube is
        0.7Mbit/s, which increases to 2.5Mbit/s for HD 720p video resolution.

    •   There were some variations in speed by mobile network. For both YouTube and Chrome,
        the average download speeds (combined 3G and 4G) on the O2 mobile network were
        significantly slower than on the other three networks.

    •   There were some indications of slowing speed in peak periods. There was a correlation
        between the number of tests and the average 4G download speed of data connection for
        Chrome and YouTube, with speeds slowing down in peak hours. The average speed was 28%
        higher during off-peak times for Chrome, and 34% higher for YouTube.

    •   Once initiated, less than 1% of all voice calls were dropped due to loss of service. There
        were no significant differences by rurality or nation.

    •   More than eight in ten Android smartphone users (84%) were satisfied with the overall
        network performance of their mobile provider. Urban users were more satisfied than rural
        users (86% vs. 73%), while users in England were more satisfied than those in the other
        nations.

    •   Web browsing was the most important activity that people used their phone for, followed
        by voice calls. Overall, 92% of Android users said web browsing was ‘extremely’ or ‘very’
        important, while three-quarters said the same for voice calls.

                                                                                                     2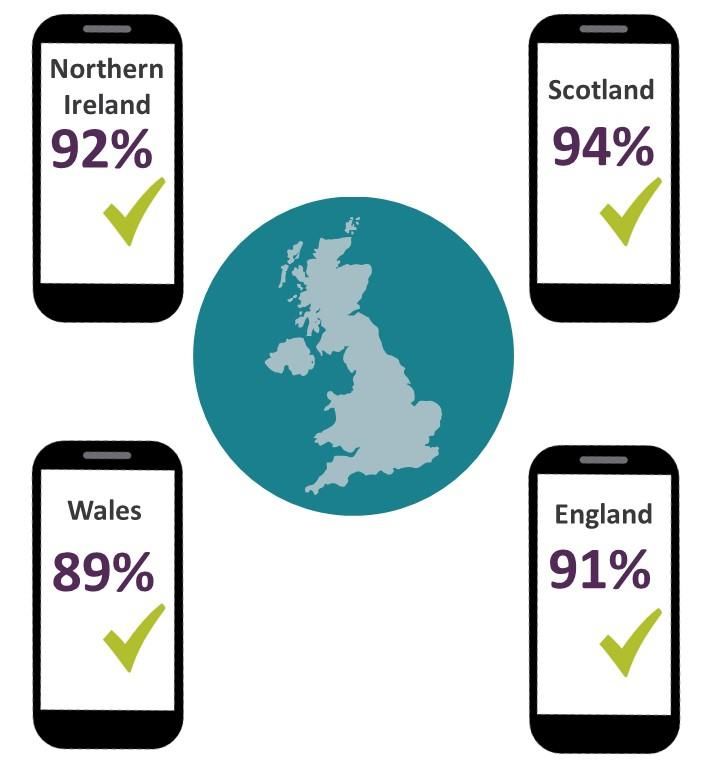
The consumer mobile experience

2. Introduction
2.1 Purpose of the research
In September to December 2017, we carried out the second phase of our consumer mobile
experience research, the objectives of which are to:

    •    gain insight about mobile network performance across the UK and how this varies by a
         number of factors including geography, time of day, application and mobile network used;

    •    collect and make available data about the performance of mobile services that is useful to
         consumers and will help drive competition to improve performance; and

    •    collect information on mobile consumer behaviour.

While the first report2 aimed to provide a high-level picture of the consumer experience of using
mobile services, this second report builds on those initial findings with additional comparisons of
consumer experience by location (urban/rural, England/Northern Ireland/Scotland/Wales), by time
of day and by mobile network.

Although coverage (as published in our coverage maps) is the most important determinant of
consumer experience, for this report we tested the performance of mobile services when coverage
is available.

This report focuses on six key areas: network share, data service availability, data performance,
voice performance, overall satisfaction and service importance.

2.2 Data and methodology overview
About the Ofcom mobile app

The app, which is provided by our technical partner P3, measures consumers’ experience of using
mobile services as panellists use their Android smartphones. It does this by running a programme of
‘passive’ tests which are designed to measure network availability and performance, while
minimising the impact on the user. Additional satisfaction measurements are captured via pop-up
surveys. More information about our testing methodology can be found in Annex A1: Technical
methodology.3

2 Consumer Mobile Experience Report, published on 16 June 2017 at: https://www.ofcom.org.uk/research-and-
data/telecoms-research/mobile-smartphones/consumer-mobile-experience
3 Annex A1: https://www.ofcom.org.uk/__data/assets/pdf_file/0014/113036/consumer-mobile-experience-2018-

technical-methodology.pdf
                                                                                                            3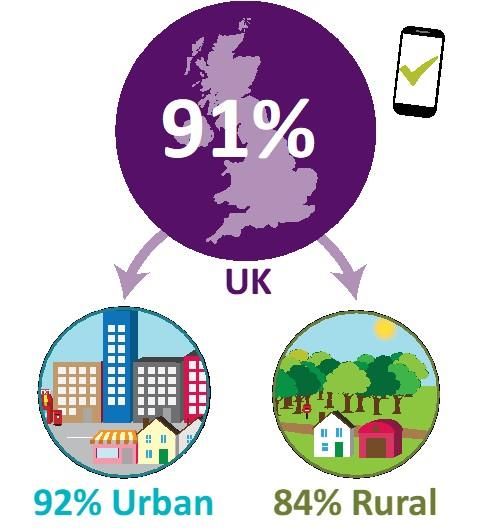
The consumer mobile experience

The ten apps that trigger satisfaction pop-ups are:

      1. Chrome                                                       6. Twitter

      2. Facebook                                                     7. Gmail

      3. YouTube                                                      8. Instagram

      4. WhatsApp                                                     9. Google Play Store

      5. Facebook Messenger                                           10. (Phone calls)

    The app gives its users summary information about their connection and usage habits (most metrics are
    based on the past seven days):

       •   the current network technology the phone is using and the signal strength;

       •   the proportion of time spent on the different network types (wifi, 2G, 3G and 4G);

       •   the proportion of data connection tests that have been successful on
           wifi and mobile network types;

       •   the maximum download speed recorded over each
           wireless network type;

       •   the dropped call ratio; and

       •   the network latency (response time) recorded over
           each wireless network type.

    The app can be downloaded from the Google Play Store.

Panel and data overview

The data used in this report were collected between 23 September 2017 and 23 December 2017;
5,315 people met our requirements and were included in the panel for this year’s report, up by 24%
since last year.4 To qualify, all panellists had to spend at least seven days on the panel by the end of
the fieldwork, and have valid information regarding their:

4We boosted the panel size for this wave of research by appointing a market research agency to recruit additional
panellists to supplement the crowd-sourced panellists.
                                                                                                                    4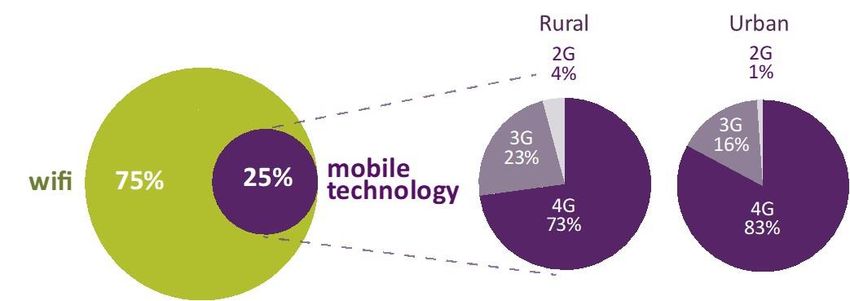
The consumer mobile experience

      •   mobile provider;

      •   mobile network technology;

      •   home postcode;

      •   age; and

      •   gender.

In our panellist recruitment and in our treatment of the data we took steps to ensure that our
dataset was representative of the UK population of Android mobile users. The demographics of
recruited panellists were close to being nationally representative, which means that we were able to
include nearly all panellists in the analysis, with some weightings applied. The data were weighted
by panellists’ rurality, nation, and wholesale mobile network market share, to ensure a nationally
representative panel. We are therefore reporting on one overall panel comprised of all valid
panellists who have access to 4G mobile technology (with weightings applied).

In addition to the overall panel, to compare the performance of the mobile networks, we used a
sub-panel comprised of a random selection of 800 panellists per network, giving a total panel size of
3,200. Although these panellists were randomly chosen, we kept the proportions of those in urban
and rural areas, and in each nation, nationally representative.
More information about the panel can be found in Annex A2: Statistical methodology.5

    Methodology notes

    As the data were collected from a panel of consumers across the UK, we consider that the results
    provided in this report are a good reflection of the overall consumer experience of UK Android
    users. This experience is affected by several factors in addition to network performance, including
    the type of handset being used, its settings, and potentially the tariff that the consumer is on. As
    such, the findings are likely to be different from those published in other Ofcom reports which
    focus on measuring only the performance of the mobile network.

    Due to changes in the statistical methodology, it was not possible to compare data availability,
    data performance, satisfaction and service importance with results from the previous report.

    The analysis is limited to those panellists with access to 4G mobile technology.

    We measure data speeds during foreground app use; that is, we associate the data speed with
    the specific app running in the foreground. To calculate the data speed, we take the overall data
    volume transferred per second, which includes any background traffic generated by other apps,
    during the time when the foreground app is being used and data are being transferred. As such,
    the data speed of the foreground app might in a few cases be affected by concurrent background
    traffic. Under normal conditions, this would rather result in a slightly higher data speed, because
    a larger volume of data would be underlying the per-second speed calculation.

5 Annex A2: https://www.ofcom.org.uk/__data/assets/pdf_file/0013/113035/consumer-mobile-experience-2018-
statistical-methodology.pdf
                                                                                                           5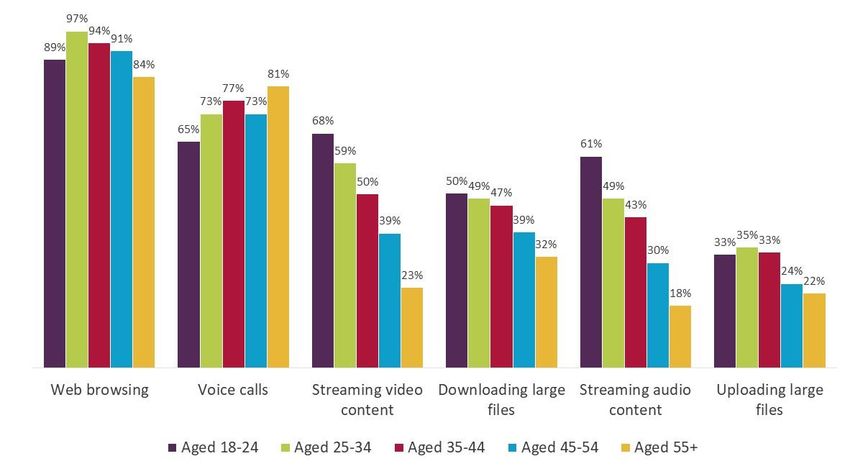
The consumer mobile experience
While our research app can identify which of the four UK mobile networks a panellist’s device is
connected to, it cannot always identify the retail provider of their mobile service. As a result, the
analysis we present is at the wholesale mobile network provider (MNO) level, and all references
to the performance of the four MNOs (EE, Vodafone, O2 and Three) may also include the
performance of panellists who are customers of mobile virtual network operators such as Tesco
Mobile, GiffGaff and Virgin Mobile.
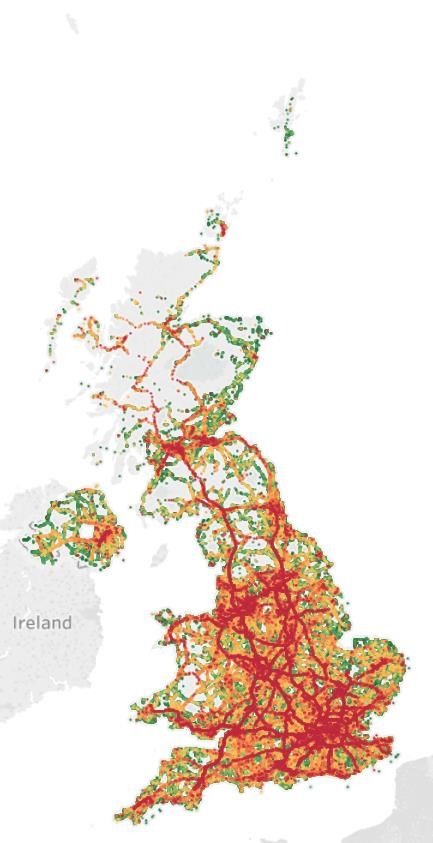
The map shows the geographic spread of our overall panel (i.e. where the tests were attempted),
which reflects a good representation of populated areas of the UK. The number of readings were
higher on major transport routes (roads and rail networks) and in bigger cities, where more people
use their mobile phones, and it is in line with the availability of good 4G service coverage in the UK.
Figure 1 Heat map of readings
Note: Green indicates fewer samples and lighter use, while red indicates more samples and heavier
use
6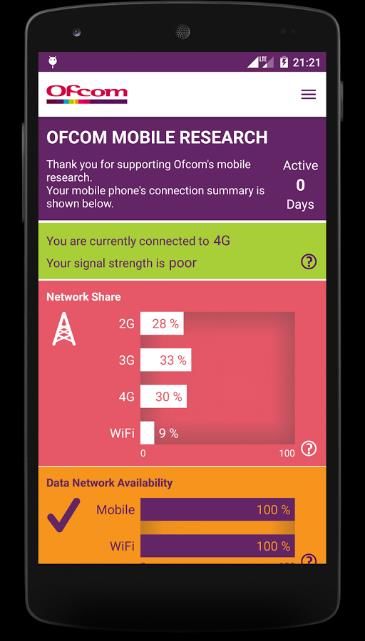
The consumer mobile experience

3. Network share
    What is network share?

    Our mobile research app records the type of network that Android users connect to when actively
    using apps and transferring data, and it provides an overall picture of the types of network that
    they connect to most often.
    More information on how this metric is derived can be found in Annex 1: Technical methodology 6

Three-quarters of time spent accessing data services was via a wifi connection

Our findings show that wifi continues to be a fundamental part of consumers’ experience of using
mobile phones, with consumers on our panel with access to 4G technology using apps over wifi
rather than mobile networks 75% of the time, a six percentage point increase since 2016. This may
be due to better experience over wifi, or users trying to minimise their mobile data use and save
their data allowances for when they are outside the home or wifi areas. Another contributory factor
might be wider use of public wifi hotspots. However, it is likely that most wifi use is in the home: our
results show that mobile networks were used more frequently during the day and wifi use was
higher in the evening and at night.

When transferring data over a cellular network, consumers with access to 4G mobile technology
were connected to a 4G network for 81% of the time (up from 65% in 2016), compared to 17% to a
3G network and 2% to a 2G network. The increased share of 4G network use is in line with the data
published in Ofcom’s Connected Nations report in 2017, which found increased 4G coverage
compared to the previous year.7

Figure 2          Average network share, by network technology

User base: Mobile users with access to 4G mobile technology (n=5,315)
Note: Type of network connected to while data are transferred during app session. All figures have been
rounded to the nearest whole percentage.

6 Annex A1: https://www.ofcom.org.uk/__data/assets/pdf_file/0014/113036/consumer-mobile-experience-2018-
technical-methodology.pdf
7 Connected Nations 2017 - Mobile voice and data services chapter, published on 15 December 2017:

https://www.ofcom.org.uk/__data/assets/pdf_file/0018/108513/connected-nations-mobile-2017.pdf
                                                                                                           7
The consumer mobile experience
Consumers in rural areas were less likely to achieve a 4G connection
When connected to a cellular network, 4G users in urban areas spent significantly more time than
those in rural areas on 4G networks (83% vs. 73%). In comparison, 3G network share was higher in
rural areas than in urban areas (23% vs. 16%). There were no significant differences in wifi share by
rurality.
Figure 3 Average network share, by rurality
User base: Mobile users with access to 4G mobile technology (n=5,315)
Note: Type of network connected to while data are transferred during app session. All figures have been
rounded to the nearest whole percentage.
When consumers with access to 4G technology in Wales actively used applications on a cellular
network, they spent 74% of the time connected to a 4G network, significantly less than in the other
three nations, while they spent significantly more time (22%) connected to a 3G network. There
were no significant differences between England, Scotland and Northern Ireland in the proportion of
time spent on different mobile technologies (2G, 3G and 4G). This is similar to the pattern found in
Ofcom’s Connected Nations report in 2017,8 where Wales had the lowest percentage of data traffic
connected to a 4G network compared to the other nations. There were no significant differences by
nation in the proportions of time spent on wifi.
8Connected Nations 2017, published on 15 December 2017:
https://www.ofcom.org.uk/__data/assets/pdf_file/0024/108843/summary-report-connected-nations-2017.pdf
8The consumer mobile experience
Figure 4 Average network share, by nation
User base: Mobile users with access to 4G mobile technology (n=5,315)
Note: Type of network connected to while data are transferred during app session. All figures have been
rounded to the nearest whole percentage.
Figure 5 shows how connections varied by urban and rural areas across the UK nations. In all
nations, 4G consumers in urban areas were more likely than those in rural areas to access a 4G
network. The proportion of time 4G consumers spent connected to a 2G network was highest in
rural areas of Scotland and Wales (8% and 7% respectively).
9The consumer mobile experience
Figure 5 Average network share (excluding wifi), by nation and rurality
User base: Mobile users with access to 4G mobile technology (n=5,315)
Note: Type of network connected to while data are transferred during app session. All figures have been
rounded to the nearest whole percentage.
Consumers on the EE mobile network were most likely to connect to a 4G network
Consumers on the Three and EE networks spent significantly less time connected to wifi (65% and
67% respectively) than consumers on O2 and Vodafone networks (73% and 72% respectively). A
number of factors may contribute to these variations: consumers on some networks might be less
likely to choose to use wifi due to larger data allowances or better cellular performance; there might
be variations in wifi hotspot availability; and the set-up of phones and network management policies
might be more or less likely to push consumers towards wifi.
When connected to a cellular network, consumers with access to 4G technology on the EE network
spent a significantly higher proportion of time connected to a 4G network (92%), while consumers
on the Three network spent a lower proportion of time connected to 4G (66%) and a higher
proportion of time on a 3G network (34%). This is likely to be related to 4G network coverage, as EE
has the highest coverage and Three the lowest. However, it may also be related to network
management; for many applications the performance of a 3G connection is as good as a 4G
connection, and operators may revert consumers to a 3G network to efficiently manage their
network and ensure a good experience for as many consumers as possible.
10The consumer mobile experience
Figure 6 Average network share, by mobile network
User base: Equal panel size of mobile users with access to 4G mobile technology (n=800 per mobile network)
Note: Type of network connected to while data are transferred during app session. All figures have been
rounded to the nearest whole percentage.
11The consumer mobile experience
4. Data service availability
What is data service availability?
Every 15 minutes, the research app runs a background test which attempts to download a small
file and logs whether this can be completed successfully. This metric defines the percentage of
cases when the user can both connect to the network and download data; however, it is not a
direct measure of coverage.
More information on how this metric is derived can be found in Annex 1: Technical methodology 9
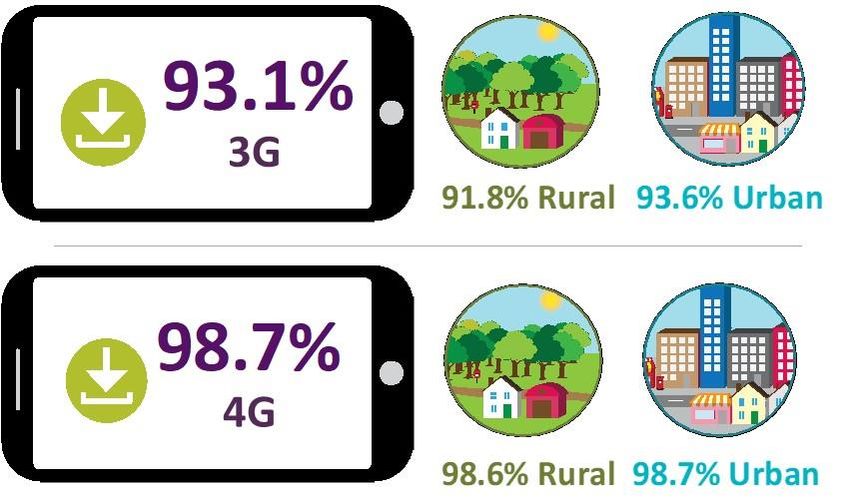
The failure rate for 4G connections was lower than for 3G connections
Mobile Android users with access to 4G mobile technology were able to successfully connect to a 4G
network on 98.7% of occasions when they attempted to do so. However, the successful connection
rate was significantly lower when they tried to use a 3G network (93.1% of occasions).
3G data availability was lower than 4G data availability in both urban and rural areas. However,
there were no significant differences in the failure rate of 4G connections by rurality, nation or
mobile network; similarly, there were no significant differences in 3G failure rates by rurality, nation
or mobile network.
Figure 7 Average data availability, by mobile network technology and rurality
User base: Mobile users with access to 4G mobile technology (n=5,315)
Note: Percentage of cases in which people could access a mobile network and successfully download data.
9Annex A1: https://www.ofcom.org.uk/__data/assets/pdf_file/0014/113036/consumer-mobile-experience-2018-
technical-methodology.pdf
12The consumer mobile experience
Data connections were more likely to fail in busy periods
When looking at data service availability by hour, there was a strong correlation between the
number of data connections and the proportion of failed tests, as consumers with access to 4G
technology connected to 3G and 4G networks, indicating that in busy periods connections are more
likely to fail. This was the case in both rural and urban areas and for all four mobile networks– there
were no significant differences between urban and rural areas or between mobile networks.
The proportion of failed tests by hour was higher on 3G networks, but failures were more likely to
happen during peak usage hours on both 3G and 4G technologies. The average proportion of failed
4G tests was 1.5% in peak hours, compared to 7.2% of 3G tests. These were significantly higher than
the proportion of failed tests in off-peak hours: 0.65% of 4G tests and 4.8% of 3G tests.
Figure 8 Correlation between the number of connection tests per hour and the proportion
of failed tests
User base: Mobile users with access to 4G mobile technology (n=5,315)
Note: Peak hours are the five hours with the highest number of tests while off-peak hours are the five hours
with the lowest number of tests. Peak and off-peak hours were the same on both 3G and 4G networks, peak
hours are between midday and 5pm, off-peak hours are between midnight and 5am.
13The consumer mobile experience
5. Data performance
What is download speed?
Download speed is the speed at which information is transferred from the internet to a device. In
effect, it determines how quickly a file can be downloaded to a smartphone. The unit of
measurement for download speeds is megabits per second (Mbit/s).
More information on how this metric is derived can be found in Annex 1: Technical
methodology.10
Download speeds vary by application
People use their smartphones for a variety of purposes, and what the phone is used for affects the
consumer experience. Some applications require higher speeds in order to deliver a good consumer
experience (e.g. applications used for video streaming such as YouTube or large file downloads such
as Google Play Store), while others provide good experience on lower speed (e.g. apps used for web
browsing or messaging). The speeds delivered for most applications do not typically reflect network
capability, as networks are generally capable of delivering much higher speeds.
In our research, we found that the average (median) download speed consumers experienced when
using their mobile phones varied significantly by application. Apps like Twitter and WhatsApp
generate small bursts of data as opposed to a constant stream, so the amount of data is not large
enough to register as high data speed. Other apps, like YouTube and Google Play Store, which
transfer larger files, generate higher and more regular data volumes, which is then registered as data
transfer with high speed.
Industry recommendations on the approximate download speeds required to run different app
services can be influenced by various factors, e.g. the quality of the network, time of day, how
operators connect to apps, and whether multiple devices share the home network. For YouTube, the
speed required for the lowest video quality is 0.7Mbit/s, which increases to 2.5Mbit/s for HD 720p
resolution and 5Mbit/s for HD 1080p video resolution.11
Our findings show that the average (median) download speeds of connections to Chrome, Facebook,
Gmail, Twitter and WhatsApp were all less than 1Mbit/s, whether the connection was via cellular
network or wifi. Average download speeds for more data-heavy apps like YouTube and Google Play
Store were higher, between 2.7Mbit/s and 3.0Mbit/s over 4G networks and wifi, with 3G
connections significantly slower (1.4Mbit/s and 1.8Mbit/s respectively).
The average download speeds typically available for consumers are considerably higher than the
speeds used for these applications – for example, Ofcom’s Smartphone Cities research in 2016 found
that the average (median) 4G download speed, available from all four operators across seven UK
cities, was 21Mbit/s.12
10 Annex A1: https://www.ofcom.org.uk/__data/assets/pdf_file/0014/113036/consumer-mobile-experience-2018-
technical-methodology.pdf
11 https://support.google.com/youtube/answer/3037019?hl=en-GB&ref_topic=3014746
12 https://www.ofcom.org.uk/__data/assets/pdf_file/0009/101430/Smartphone-Cities-phase-4-reissued-270416.pdf
14The consumer mobile experience
Figure 9 Average (median) download speed (Mbit/s), by app and network technology
User base: Mobile users with access to 4G mobile technology (n=5,315)
Note: Average (median) was calculated.
When looking at the range of download speeds that consumers received (the middle 50% of values –
25th to 75th percentile), download speeds varied more between the data access technologies. In
particular, applications that need more data had bigger variations between performance at the 25th
and 75th percentile. The speeds required depend on the application being used, which is why we
analyse average download speed by application.
Average (median) download speeds for messaging and browsing apps were still less than 2.3Mbit/s
at the 75th percentile. This means that for 75% of the time consumers were receiving speeds of less
than 2.3Mbit/s, suggesting that for most of the time, higher speeds are not needed for these apps.
However, YouTube download speeds averaged 6.64Mbit/s on 4G networks, and Google Play Store
8.58Mbit/s on wifi at the 75th percentile, compared to 0.98Mbit/s and 0.56Mbit/s respectively at the
25th percentile. But these apps include browsing as well as video streaming and downloading, which
requires less speed, so the lower figures at the 25th percentile may not necessarily indicate a worse
consumer experience.
15The consumer mobile experience
Figure 10 Average (median) download speed (Mbit/s), by inter-quartile range, app and
network technology
User base: Mobile users with access to 4G mobile technology (n=5,315)
Note: Average (median) was calculated.
Why do we need to analyse the data by percentile?
The 25th to 75th percentile (the inter-quartile range) shows the spread of the middle half of
download speeds that panellists received while using an application. It shows the range of speeds
that most panellists experienced and excludes any outlier values. These outlier values are very
high or very low speeds that might have been experienced because of using an app for a very
short amount of time, or possibly a speed experienced by a very small minority of panellists.
There were some variations in speed by mobile networks
While there were no significant differences in speeds delivered for Facebook, our research found
that the average (median) download speeds (combined 3G and 4G) for Chrome and YouTube on the
O2 network were significantly slower than on the other three networks. Differences in the download
speeds used by the applications on different mobile networks do not necessarily lead to differences
in the consumer experience. Nevertheless, this indicates that when using applications that benefit
from higher speeds, such as YouTube, consumers on networks with higher average speeds may be
more likely to have a good experience. However, download speed is not the only measure that
determines consumer experience, other metrics including reliability and response time are also
important.
16The consumer mobile experience
Figure 11 Average (median) download speed (Mbit/s), by application and mobile network
User base: Equal panel size of mobile users with access to 4G mobile technology (n=800 per mobile network)
Note: Average (median) was calculated.
Average speeds for some apps were slower in peak periods
There was a strong correlation between the number of tests and the average (median) download
speeds for Chrome and YouTube on 4G networks, with speeds slowing down in peak hours.
On 4G networks, the average (median) download speed was 28% higher during off-peak hours for
Chrome (0.99Mbit/s off-peak vs. 0.77Mbit/s peak) and 34% higher for YouTube (3.13Mbit/s off-peak
vs. 2.34Mbit/s peak). When comparing the number of tests by hour of the day on 4G networks and
wifi, app use in early to late afternoon was higher on 4G networks than on wifi. There was an
increase in app use on wifi later in the day, with a corresponding decrease on 4G networks. This
indicates that consumers are potentially switching from mobile networks to wifi when they are at
home.
17The consumer mobile experience
Figure 12 Correlation between app use and average (median) download speed, by app and
network technology
User base: Mobile users with access to 4G mobile technology (n=5,315)
Note: Average (median) was calculated. Peak hours are the five hours with the highest number of tests while
off-peak hours the five hours with the lowest number of tests.
Consumers spend longer on data applications when connecting via wifi
The average duration of a session on YouTube (used for streaming videos, vlogs and short-form
audio-video content) was, perhaps not surprisingly, longer than sessions on Facebook, WhatsApp
and Chrome, on all network technologies.
For YouTube, Facebook and Chrome, average user sessions were longer on wifi than sessions on a
4G network: consumers spent an average of 1 minute 48 seconds longer on YouTube when
connecting via wifi, 54 seconds longer on Facebook, and 30 seconds longer on Chrome. This is
probably because consumers want to avoid using up their data allowance on their mobile
connection, and possibly because they have more time when they are at home on wifi than when
they are using a mobile network outside the home.
The average WhatsApp session length did not vary significantly by technology, indicating that people
spend a similar amount of time sending short messages while on the go (via mobile networks) as at
home (via wifi). There were no significant differences in average session length for any of the four
apps by rurality or nation.
18The consumer mobile experience
Figure 13 Average session length (mins), by application and network technology
User base: Mobile users with access to 4G mobile technology (n=5,315)
Note: Average (mean) was calculated.
Consumers used mobile app services more often on wifi than on cellular networks
During the day, on average, panellists opened apps (WhatsApp, Facebook and YouTube) more often
on wifi than on mobile networks. WhatsApp and Facebook were opened on average twice a day by
panellists on a mobile network, while average use was more than twice as much for these two apps
on wifi. The average number of times YouTube was opened in a day was significantly less on both
wifi and mobile networks.
Figure 14 Average number of app sessions per panellist per day, by network technology
User base: Mobile users with access to 4G mobile technology (n=5,315)
Note: Average (mean) was calculated.
19The consumer mobile experience
What is response time?
Response time (referred to technically as latency) is the delay between a consumer making a
request to their mobile network for information and the network providing this information to
the device. A connection with low latency will ‘feel’ more responsive.
More information on how this metric is derived can be found in Annex 1: Technical
methodology.13
We also measured response times (or latency). A connection with low latency will feel more
responsive for simple tasks like web browsing, and certain applications perform far better with lower
latency. The response time needed to use applications without noticeable degradation varies
according to the app. In general, under 50ms all apps should give a good consumer experience, but
some applications will perform satisfactorily even with much higher levels of response time (e.g.
300ms).14
While there was no significant difference in the average response time on 3G and 4G networks
(60ms and 50ms respectively), it was significantly lower (25ms) on wifi than over cellular networks.
Averages by network type varied more in the 75th percentile, but the results are still lower than what
most activities require to provide a good experience (less than 100ms). There were no significant
differences on cellular networks by rurality or by nation.
Figure 15 Average response time, by network technology
User base: Mobile users with access to 4G mobile technology (n=5,315)
Note: Average (median) was calculated. All figures have been rounded to the nearest whole number.
13Annex A1: https://www.ofcom.org.uk/__data/assets/pdf_file/0014/113036/consumer-mobile-experience-2018-
technical-methodology.pdf
14 https://www.ofcom.org.uk/__data/assets/pdf_file/0035/95957/Ofcom-Mobile-and-Broadband-Checker.pdf
20The consumer mobile experience
6. Voice performance
Measuring voice performance
As voice call performance is still a major driver of customer satisfaction, Ofcom’s mobile research
app measures whether people can successfully maintain voice calls by detecting cases where the
call is interrupted due to a loss of service.
Due to limitations in passive testing methodology, we cannot measure call set-up success, so the
results do not take into account times when people were unable to make a call.
More information on how this metric is derived can be found in Annex A1: Technical
methodology.15
More than 99% of voice calls are completed without being dropped
Once initiated, just under 1% of all calls (0.98%) were dropped due to loss of service. There were no
significant differences between the dropped call rates when comparing rurality, nations or network
technologies.
Figure 16 Proportion of dropped calls
User base: Mobile users with access to 4G mobile technology (n=5,315)
Note: Dropped calls due to loss of service. The figure has been rounded to the nearest whole percentage.
15Annex A1: https://www.ofcom.org.uk/__data/assets/pdf_file/0014/113036/consumer-mobile-experience-2018-
technical-methodology.pdf
21The consumer mobile experience
7. Overall satisfaction and service importance
How satisfaction is measured?
At the beginning of the research and again every 30 days, the app asks for the user’s overall
satisfaction with the network performance of their mobile service provider. From time to time
(based on predefined trigger frequencies), the app asks users to rate their satisfaction with voice
calls and apps used.
More information on how this metric is derived can be found in Annex 1: Technical
methodology.16
Overall satisfaction with mobile network performance was higher in urban areas
On most occasions (84% of responses), Android smartphone users were ‘very’ or ‘fairly’ satisfied
with their overall mobile network performance. This varied by rurality; urban users were more
satisfied than rural users (86% vs. 73%).
While the performance of a service is a key driver of consumer experience, many other factors also
affect the consumer experience and therefore levels of satisfaction. These include price, handset
type, quality of customer service, contract terms and the activities that the phone is used for.
Figure 17 Overall satisfaction with mobile network performance, by rurality
84% All panellists
73% Rural 86% Urban
User base: Mobile users with access to 4G mobile technology (n=3,471)
Q: How satisfied are you with the overall network performance of your mobile provider?
80%
Note: Include ‘very’ or ‘fairly’ satisfied responses. All figures have been rounded to the nearest whole
percentage.
3G users
At a national level, users in England wereRural
70% more satisfied (86%) than those in the other nations,
81% Urban
where levels of satisfaction did not differ significantly.
84%
16 4G users
Annex A1: https://www.ofcom.org.uk/__data/assets/pdf_file/0014/113036/consumer-mobile-experience-2018-
technical-methodology.pdf 73% Rural 86% Urban
22The consumer mobile experience
Figure 18 Overall satisfaction with mobile network performance, by nation
User base: Mobile users with access to 4G mobile technology (n=3,471)
Q: How satisfied are you with the overall network performance of your mobile provider?
Note: Include ‘very’ or ‘fairly’ satisfied responses. All figures have been rounded to the nearest whole
percentage.
Satisfaction also varied by gender and age. The proportion of women in our panel who said they
were ‘very’ or ‘fairly’ satisfied with the overall network performance of their mobile provider was
8pp higher than the proportion of men (89% vs. 81%). People aged 55 and over were significantly
more likely to be dissatisfied than those aged under 55.
Figure 19 Overall satisfaction with mobile network performance, by age and gender
User base: Mobile users with access to 4G mobile technology (n=3,471)
Q: How satisfied are you with the overall network performance of your mobile provider?
Note: Include ‘very’ or ‘fairly’ satisfied responses. All figures have been rounded to the nearest whole
percentage.
23The consumer mobile experience
Consumers in rural areas are less satisfied with the performance of making voice calls
At a UK level, 91% of our panellists said they were satisfied (based on either positive or neutral
responses) with the quality of their last phone call. However, respondents who used their phones in
urban areas reported higher satisfaction levels than those in rural areas (92% vs. 84%).
Figure 20 Average voice call satisfaction, by rurality
User base: Mobile users with access to 4G mobile technology (n=2,868)
Q: How satisfied were you with the quality of your last phone call?
Note: Include responses of ‘positive’ or ‘neutral’. All figures have been rounded to the nearest whole
percentage.
When comparing results across nations, users in Scotland were the most satisfied (94%) with voice
call performance, whereas users in Wales were the least satisfied (89%).
Figure 21 Average voice call satisfaction, by nation
User base: Mobile users with access to 4G mobile technology (n=2,868)
Q: How satisfied were you with the quality of your last phone call?
24The consumer mobile experience
Note: Include responses of ‘positive’ or ‘neutral’. All figures have been rounded to the nearest whole
percentage.
How importance is measured?
At the beginning of the research, the app asks the user to rate the importance of specific services
(such as voice call, download/upload, browsing and audio/video streaming).
More information on how this metric is derived can be found in Annex 1: Technical
methodology.17
Web browsing is the activity most consumers consider to be ‘extremely’ or ‘very’ important
In our panel, web browsing was the most important activity that people used their phone for,
followed by voice calls. Overall, 92% of Android users said web browsing was ‘extremely’ or ‘very’
important, while three-quarters said the same for voice calls. Less than half of Android users ranked
streaming video and audio as important (47% and 40% respectively), although this varied by rurality.
People living in urban areas were more likely than people living in rural areas to rank streaming
video and audio content as ‘extremely’ or ‘very’ important (48% vs. 37% for video streaming; 41% vs.
32% for audio streaming). This could be due to a number of factors, including differences in
demography, take-up of streaming services and network performance. But there was no significant
difference in importance rankings across other activities by rurality, indicating that smartphone
users in rural areas prioritise the same mobile activities as those in urban areas.
Figure 22 Overall importance of mobile services, by rurality
User base: Mobile users with access to 4G mobile technology (n=2,512)
Q: How important is it that you are able to access and use the following services on a daily basis?
17Annex A1: https://www.ofcom.org.uk/__data/assets/pdf_file/0014/113036/consumer-mobile-experience-2018-
technical-methodology.pdf
25The consumer mobile experience
Notes: Includes ’extremely’ and ’very’ important responses. All figures have been rounded to the nearest whole
percentage.
Younger consumers are more likely to consider audio and video streaming as important
Although consumers of all ages were most likely to rank web browsing as an ‘extremely’ or ‘very’
important service, there were significant differences by age, particularly in the importance
attributed to streaming video and audio. The proportion of 18-24-year olds who said streaming
video was ‘extremely’ or ‘very’ important was almost three times higher than the proportion of
those aged 55 and over (68% vs. 23%), and this gap was even wider for audio streaming (61% vs.
18%). However, there was consistency in terms of ranking of those two activities; streaming video
content was more important than streaming audio content for all age groups.
For panellists aged 18-24, streaming both video and audio was more important than downloading or
uploading large files. This was not the case for other age groups, perhaps due to their reliance on
mobile services for file transfer and work-related activities e.g. sending and receiving email and
downloading attachments. Uploading large files remained the least important activity for most age
groups; just under a third (30%) of all panellists ranked it as ‘extremely’ or ‘very’ important.
For those aged 55 and over, web browsing was the most important activity (84%), followed closely
by voice calls (81%). These are on average four times as important as streaming video and audio
content.
The importance of voice calls was particularly high amongst those aged 55 and over (81%) and 35-44
(77%). In contrast, only 65% of our panellists aged 18-24 considered making a voice call an
’extremely’ or ‘very’ important activity. This suggests a stronger preference among younger people
for using non-traditional communication services (e.g. messaging applications) rather than
traditional telephone calls.
Figure 23 Overall importance of mobile services, by age
User base: Mobile users with access to 4G mobile technology (n=2,512)
Q: How important is it that you are able to access and use the following services on a daily basis?
Notes: Includes ’extremely’ and ’very’ important responses. All figures have been rounded to the nearest whole
percentage.
26The consumer mobile experience
There was no significant difference by gender in the importance of web browsing and voice calls, but
streaming audio and video, and downloading large files, were more important among men. Although
the importance of web browsing (responses including ‘extremely’ and ‘very’ important) did not
differ significantly by gender, women were more likely to rank it as ‘extremely’ important (72% of
women vs. 66% of men).
Figure 24 Overall importance of mobile services, by gender
User base: Mobile users with access to 4G mobile technology (n=2,512)
Q: How important is it that you are able to access and use the following services on a daily basis?
Notes: Includes ‘extremely’ and ’very’ important responses. All figures have been rounded to the nearest whole
percentage.
27You can also read