FIRST HALF-YEAR 2019 PRESENTATION FOR INVESTORS, ANALYSTS, MEDIA - 15 August 2019 - Meyer Burger

Page created by Todd Schroeder
 
CONTINUE READING
FIRST HALF-YEAR 2019 PRESENTATION FOR INVESTORS, ANALYSTS, MEDIA - 15 August 2019 - Meyer Burger
15 August 2019

FIRST HALF-YEAR 2019
PRESENTATION FOR
INVESTORS, ANALYSTS, MEDIA
FIRST HALF-YEAR 2019 PRESENTATION FOR INVESTORS, ANALYSTS, MEDIA - 15 August 2019 - Meyer Burger
AGENDA

• Business and market review                                                                  Dr Hans Brändle, CEO

• Financial statements H1 2019 in detail                                                      Manfred Häner, CFO

• Q&A session

Meyer Burger Technology Ltd. Presentation for Investors, Analysts and Media, 15 August 2019                        2   © Meyer Burger
FIRST HALF-YEAR 2019 PRESENTATION FOR INVESTORS, ANALYSTS, MEDIA - 15 August 2019 - Meyer Burger
Dr Hans Brändle, CEO

BUSINESS AND MARKET
REVIEW

Meyer Burger Technology Ltd. Presentation for Investors, Analysts and Media, 15 August 2019   3   © Meyer Burger
FIRST HALF-YEAR 2019 PRESENTATION FOR INVESTORS, ANALYSTS, MEDIA - 15 August 2019 - Meyer Burger
HALF-YEAR FINANCIALS IMPACTED BY
ONGOING TRANSFORMATION PROGRAM

 Incoming orders in MCHF                                                                      Net sales in MCHF                                                                               Stable orders on a
                                                                                                                                                                                               comparable basis
  400                                                                                         400           337
                                                   268
                                                               308                                   308
                                                                                                                                                                   261
                                                                                                                                                                                              Delayed HJT orders but
  300                                                                253                      300
                       205             223
                                             196                                                                                           200   218 235 212             232                   stable HJT pipeline, with
                                                         188                     189                                           187                                             175
  200                        157 169                                                          200
        128                                                                138                                           129         124                                             123       prospects mainly from
              95 83                                                                    94                         90 113
  100                                                                                         100                                                                                              outside China
    0                                                                                           0                                                                                             Drop in sales by 39% on
        H1 12 H1 13 H1 14 H1 15 H1 16 H1 17 H1 18 H1 19                                              H1 12 H1 13 H1 14 H1 15 H1 16 H1 17 H1 18 H1 19
                                                                                                                                                                                               a comparable basis

 EBITDA in MCHF                                                                               Net result in MCHF                                                                              CHF 2 Mio net result
                                                                                                                                                                         8
                                                                                                                                                                                               following sale of wafering
   50                                                                       29                                                                                                       2
                                                                                                0                                                                                              business
          5                                         6      5     7     5
    0                                                                                                                                                        -17                              Significant cost reductions
                                                                                   -3                 -34                                        -26
                                              -23
                                                                                        -13    -60                             -47                                             -51
                                                                                                                                                                                               as a consequence of
  -50         -28
                                  -41 -33                                                                                                              -71
                                                                                                                                                                   -62
                                                                                                                                                                                               ongoing transformation
                    -59 -58 -55                                                                             -82 -82 -81 -88                -76
                                                                                                                                     -93                                                       program
 -100                                                                                         -120
        H1 12 H1 13 H1 14 H1 15 H1 16 H1 17 H1 18 H1 19                                              H1 12 H1 13 H1 14 H1 15 H1 16 H1 17 H1 18 H1 19

Meyer Burger Technology Ltd. Presentation for Investors, Analysts and Media, 15 August 2019                                                                                                                4   © Meyer Burger
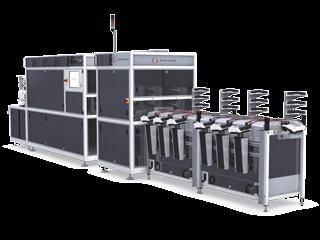
FIRST HALF-YEAR 2019 PRESENTATION FOR INVESTORS, ANALYSTS, MEDIA - 15 August 2019 - Meyer Burger
SOLAR ON VERGE OF
   SWEEPING GRID PARITY:
   LCOE RAPIDLY DECLINING
    Levelized cost of electricity for different power sources
          350                                                                                                     Sustained, dramatic decline in cost of electricity from
                                                                  Solar                                            utility-scale solar PV continues: between 2009 & 2018,
          300                                                     Wind                                             global weighted-average LCOE for crystalline solar PV fell 88%
                                                                  CCGT                                             (year-on-year decline in 2018 was 14%)
          250                                                     Coal
                                                                  Nuclear                                         Lower PV module prices and ongoing reductions in BoS costs
                                                                                                                   remain main driver in LCOE decrease
USD/MWh

          200                                                                   -88%

                                                                                                                  By 2020, solar electricity expected to cost consistently less
          150                                                                                                      than least-cost fossil fuel alternative, without financial
                                                                                                                   assistance
          100
                                                                         -14%                                     As solar’s global electricity share was only 2% in 2018, growth
                                                                                                                   potential is huge
           50
                                                                                                                  Continuously falling solar electricity costs make solar power
            0                                                                         Source: Lazard (2018)        key to competitive backbone of global energy sector
                              2011

                                     2012

                                            2013
                2009

                       2010

                                                   2014

                                                          2015

                                                                 2016

                                                                        2017

                                                                               2018

                                                                                      All prices in 2019 USD
                                                                                                                   transformation

   Meyer Burger Technology Ltd. Presentation for Investors, Analysts and Media, 15 August 2019                                                                      5   © Meyer Burger
FIRST HALF-YEAR 2019 PRESENTATION FOR INVESTORS, ANALYSTS, MEDIA - 15 August 2019 - Meyer Burger
STANDARD PV TECHNOLOGY: INCREASING
 NUMBER SUCCESSFUL CHINESE COMPETITORS
                  wafer                                          cell                            module
                  from ingot to wafer                            from wafer to cell              from cell to module

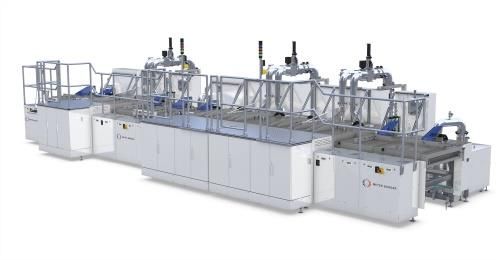
Wafering PV                    Hennecke                           MB PERC                           PASAN
diamond wire saw             wafer inspection system             inline coating system (PECVD)    module inspection system

DW 288 Series 3                WIS-08                                MAiA 6.1                        HighLIGHT

Local Chinese competitors

Shangji                      Autowell                             China S.C                        GSola

Linton                       TZTEK                                Leadmicro                        DLSK
Goace

 Meyer Burger Technology Ltd. Presentation for Investors, Analysts and Media, 15 August 2019                                 6   © Meyer Burger
FIRST HALF-YEAR 2019 PRESENTATION FOR INVESTORS, ANALYSTS, MEDIA - 15 August 2019 - Meyer Burger
STANDARD PV TECHNOLOGY: RAPID COMMODITIZATION
CONTINUES DRIVEN BY CN COMPETITORS

                                                                                                       Measures going forward
                                                                                                          Reverse decision of planned move
                                                                                                           of operations to China; adjust sales
                                                                                                           force
                                                                                                          Focus R&D resources on
                                                                                                           HJT/SWCT™/perovskite
                                                                                                           technologies; opportunistic
                                                                                                           approach to PERC

     Chinese customer focus on lowest CAPEX and local suppliers. Over the years local suppliers succeeded step-by-step in taking
      over business from Western suppliers for standard PV equipment
     Standard PV technology approaches commoditization: After PERC, “commoditization effect” now also seen in wafer inspection
      systems where local Chinese suppliers offer “good enough” solutions at low prices. MB’s market share erodes product-by-
      product for standard PV technology to local CN suppliers
     Sharp decline of product contribution within 12 months: 70% volume effect and 30% margin compression
     Projected available profit pool for standard PV equipment is no longer attractive for Meyer Burger

Meyer Burger Technology Ltd. Presentation for Investors, Analysts and Media, 15 August 2019                                     7   © Meyer Burger
FIRST HALF-YEAR 2019 PRESENTATION FOR INVESTORS, ANALYSTS, MEDIA - 15 August 2019 - Meyer Burger
STANDARD PV TECHNOLOGY:
MB PERC DROPS 45% IN
CAPEX PER GW SINCE 2018
Example: MB PERC                                                                                 Meyer Burger pioneered the PERC market with high market
                                                                                                  share until 2017
CAPEX per GW [MCHF]

                         -45%
                                                                                                 Strong price pressure due to fierce competition started in 2018
 11.2
                      9.9                                                                        Chinese customer focus on lowest CAPEX and local suppliers
         9.2
                                                                                                  rather than on cost of ownership
                              6.9          7.2
                                                  6.2

   HY1 18               HY2 18              HY1 19

        net sales
        order intake

Meyer Burger Technology Ltd. Presentation for Investors, Analysts and Media, 15 August 2019                                                      8   © Meyer Burger
HIGH-END PV TECHNOLOGY: HJT/ SWCT™
      ENABLES QUANTUM LEAP IN MODULE
      EFFICIENCY
      Monofacial module efficiency of best products1)
        Meyer Burger                    Standard                                                             PERC                                  Best-in-class PERC and standard Heterojunction with similar
         HJT/SWCT                     Heterojunction                                                                                                module efficiency
22%
               21.7%                                                                                                                               Bulk of PERC module efficiencies below 20%

                                                                                                                                                   Meyer Burger’s HJT/ SWCT™ enables quantum leap in
                                                                                                                                                    module efficiency enabling premium average sales prices
21%
                                                                                                                                                   REC’s module efficiency similar to Sunpower and LG whose
                                                                                                                                                    products are based on more costly IBC technology
                                                                                                                                                    (First Solar is at 18.0% with thin film modules based on CdTe)

20%
                                                                                Jinergy
                  REC

                                                                     GS Solar
                                              CIE Power

                                                                                                                                       GCL
                                                                                          Jinko

                                                                                                                               Trina
                                                                                                                       LONGi
                                                          Sunpreme
                                  Panasonic

                                                                                                  JA Solar
                                                                                                             Q Cells

                                                                                                                                             1)   Commercially available best bin (front efficiency).
                                                                                                                                                  Sources: Official datasheets (downloaded Aug 6th,2019 on companies websites)

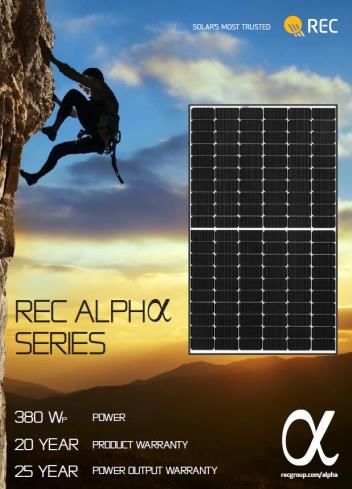
                                                                                                                                                  REC Alpha-Series (PM-DS-12-01-Rev- A 06.19); Panasonic N340 HIT®+Series; CIE Power CIE-H5C1-
                                                                                                                                                  60-DA2; Sunpreme Maxima GxB 330T SM; GS Solar HDT-60; Jinergy JNHM60; Jinko Cheetah HC 60M;
                                                                                                                                                  JASolar JAM60S10; Q Cells Q.PEAK DUO-G6; LONGi HiMO-4; Trina DE06H(II); GCL M3/60
      Meyer Burger Technology Ltd. Presentation for Investors, Analysts and Media, 15 August 2019                                                                                                                                   9    © Meyer Burger
AND MEYER BURGER’S
HJT/SWCT™ ENABLES
COMPELLING BUSINESS CASE
                                                                                              Different technologies for crystalline silicon
                                                                                                 PERC: low manufacturing costs but also low average sales
                                                                                                  price due to little differentiation
                       high

                                  IBC /       Meyer Burger                                    
 Average sales price

                                                                                                  IBC and standard HJT: higher average sales price than PERC
                              standard HJT    HJT / SWCT™                                         but manufacturing costs also significantly higher

                                Low margin      High margin
                                                                                              Meyer Burger is the HJT/SWCT™ pioneer, its solution unique
                                                                                                 Leading in cell efficiency on industrialized production
                                                                                                  equipment
                               n-PERT           PERC
                       low

                                                                                                 Providing most cost efficient production technology
                                                                                                 SmartWire as a proprietary and strategic core piece, enabling
                                                                                                  highest module efficiency
                                Low margin      Low margin

                                 high              low

                                   Manufacturing costs

Meyer Burger Technology Ltd. Presentation for Investors, Analysts and Media, 15 August 2019                                                     10   © Meyer Burger
ENVISAGED ADAPTATION OF
CURRENT BUSINESS MODEL

 MB business model today                                                                      Adaptation of business model
     Technology focus on standard PV                                                          Primary technology focus on HJT/SWCT™
      (e.g. PERC) and HJT / SWCT™                                                              Strong technology and R&D focus
     Strong technology and R&D focus                                                          2 revenue sources
                                                                                                    Equipment orders
     No vertical integration / downstream access
                                                                                                    Profit sharing
     One-time proceeds from equipment orders                                                  Extended collaboration with REC to leverage downstream access
     Non-exclusive sales to all cell producers                                                 and participate directly from module sales
      globally (including China)                                                                    Production capacity of 600MW available in 2020
                                                                                                    Capacity expected to increase significantly to multi GW in coming years
                                                                                                    “Double-positive effect” given higher profit sharing proceeds from increased
                                                                                                     capacity plus additional HJT/SWCT™ equipment sales
                                                                                               Adequate exclusivity of MB’s HJT/SWCT™ only in case of significant
                                                                                                increase of REC’s production capacity to multi-GW scale in mid-term

 Fierce competition and increasing pricing                                                    Collaboration with REC will reshape market and create significant
 pressure limit MB’s ability to capitalize on its                                             long-term shareholder value. “Vertical pooling” with REC and
 technology leadership                                                                        increasing downstream access will secure both exclusiveness of
                                                                                              HJT/SWCT technology and margin preservation longer term.

Meyer Burger Technology Ltd. Presentation for Investors, Analysts and Media, 15 August 2019                                                               11   © Meyer Burger
DISRUPTIVE: ADAPTED BUSINESS MODEL
WITH PROFIT-SHARING ON A PER-WATT LEVEL

Update on REC 600 MW ramp-up and next steps for extended collaboration
   Full potential of Meyer Burger’s combined HJT cell and SWCT™ cell connection technologies levered for
    first time with REC’s premium Alpha Series
   High expectations for both cell & module efficiencies and cost competitiveness
   Ramp-up of first 200 MW within 9 months completed – new record for Meyer Burger’s HJT/SWCT™
    technologies
   Fast payback for investment expected given low HJT production cost

   Based on 600 MW order in December 2018, REC plans to further expand HJT capacity to multiple GW
   Profit-sharing agreement on a per-Watt level envisaged in exchange for adequate technological exclusivity

   Memorandum of Understanding between Meyer Burger and REC for extended collaboration and profit
    sharing signed on 14 August 2019                                                                            REC Alpha Video

Meyer Burger Technology Ltd. Presentation for Investors, Analysts and Media, 15 August 2019                              12   © Meyer Burger
MEYER BURGER’S R&D KEEPING FAST PACE
  IN HIGH-END PV TECHNOLOGY DEVELOPMENT
   Impressive progress in HJT cell efficiency on                                                >22% efficiency achieved on R&D module
   Meyer Burger’s standard production equipment                                                 using Meyer Burger’s standard HJT cells
    Cell                                                                                        Module
                                                  +0.49%
                                                  27%          >30%
                                                                                                                                22.1%
                                                           24.75%
                        +0.24%

                        24.22%           24.26%
                                                                                                  21.7%
      24.02%

      Q2 2017          Q4 2017           Q4 2018          Q2 2019                               Commercial                      R&D 1)
                                                                                                                   1)   using standard MB HJT cells

 Best HJT cell achieved 24.75% from batch with median 24.4% cell efficiency (measurement calibration FhG ISE confirmed)
 Meyer Burger/Solar Energy Research Institute Hamelin, Germany: HJT/SWCT R&D module with 22.1% confirmed by TÜV Rheinland
  (July 2019); commercial module (REC Alpha-Series): 380Wp and module efficiencies up to 21.7% using Meyer Burger’s HJT/SWCT™
 First HJT-perovskite-SWCT tandem test modules built within Meyer Burger’s collaboration with Oxford PV
 TÜV confirmed 347Wp module TOPCon/SWCT™ – best TOPCon cell efficiency using CAiA® at 23.5%

  Meyer Burger Technology Ltd. Presentation for Investors, Analysts and Media, 15 August 2019                                                         13   © Meyer Burger
OUTLOOK: KEY PRIORITIES IN H2/2019 AND 2020

   Transformation program and implementation of cost measures on track
  1                             2                            3                                4                        5
       Heterojunction            Heterojunction               Concentrate                       Review/sell non-        Drive HJT
        (HJT)                     SmartWire                     organization in                    core businesses          capacity
       SmartWire                 Tandem                        Hohenstein-                       Sell real estate         expansion &
        (SWCT™)                                                  Ernstthal (DE)                                              profit sharing
                                  Opportunistic
       Equipment to               approach for                 Streamline                                                  model with REC
        upgrade HJT to             PERC/TOPcon                   salesforce in                                              Create strategic
        tandem cell                                              China                                                       options

   Streamline                    Focus R&D                     Further adjust                 Streamline               Implement new
   product range                 roadmap                       fix cost base                  assets                   business model

              ACHIEVE LONG-TERM SUSTAINABLE PROFITABILITY AND CREATE SHAREHOLDER VALUE

         Strategic priority going forward is focus on Heterojunction, SmartWire (SWCT™)
                  and next generation cell technologies with new business model
Meyer Burger Technology Ltd. Presentation for Investors, Analysts and Media, 15 August 2019                                                     14   © Meyer Burger
KEY TAKE-AWAYS

                                           business development disappointing due to fierce competition in PERC
  1     current trading
                                           technologies

                                           stable HJT sales pipeline but delayed HJT orders, with prospects
  2     order pipeline
                                           mainly from outside China

        technology lead                    REC unveiled first HJT/SWCT module with quantum leap in module
  3
        validated                          efficiency
        first gigawatt-scale
  4                                        expected in late H2 2019 from REC
        HJT order
                                           strategic partnership with Oxford PV to develop and industrialize next-
        technology beyond
  5                                        generation high-efficiency crystalline silicon/perovskite tandem solar
        heterojunction
                                           cells
        adapting business                  MoU signed with REC for extended collaboration, capacity expansion
  6
        model                              and profit sharing
        transforming Meyer                 on track: strategic priority to focus on HJT, SmartWire and next
  7
        Burger                             generation cell technologies with adapted business model
                                                                                                                     Meyer Burger HJT/SWCT™/bifacial modules

Meyer Burger Technology Ltd. Presentation for Investors, Analysts and Media, 15 August 2019                                                   15    © Meyer Burger
Manfred Häner, CFO

FINANCIAL STATEMENTS
H1 2019

Meyer Burger Technology Ltd. Presentation for Investors, Analysts and Media, 15 August 2019   16   © Meyer Burger
ORDERS

Incoming Orders
 MCHF                                250

                                     200

                                     150         138
                                                  23
                                                                                              Incoming orders H1 2019
                                     100                           94
                                                  70               31                          Incoming orders of CHF 94 million at lower end of expectations
                                      50
                                                                   60                          Negative FX impact of CHF 2 million (-2.4%)
                                                  43
                                        0                          3                           On comparable basis order intake decreased by 0.6% (decrease
                                               H1 2018          H1 2019                         of CHF 43 million of incoming orders was due to the sale of the
                                            Spec. Tec. PV Wafering                           wafering business)
                                                                                               Incoming orders in Photovoltaics (excl. wafering) decreased by
Order Backlog                                    241                                            CHF 10 million, Specialised Technologies increased by CHF 8
 MCHF
                                     250
                                                  44                                            million.
                                     200                                                       Book-to-bill ratio of 0.77 (H1 2018: 0.59)
                                                                  166
                                     150                           39
                                                  156                                         Order backlog 30 June 2019
                                     100
                                                                   126                         Order backlog decreased to CHF 166 million (31 December
                                      50
                                                                                                2018: CHF 241 million), CHF 41 million reduction due to sale of
                                                  41
                                        0                                                       wafering business
                                              31.12.2018       30.06.2019

                                             Spec. Tec. PV Wafering
Meyer Burger Technology Ltd. Presentation for Investors, Analysts and Media, 15 August 2019                                                    17   © Meyer Burger
INCOME STATEMENT
 In TCHF                                    H1 2019      in %     H1 2018       in %
 Net sales                                  122 567     100%      232 328    100.0%
 Other income                                  4 704                2 904
 Curr. transl. effects on TR and prepay.        575                 1 434
 Income                                     127 846               236 667
 Changes in inventories                      22 187                 -2 766
                                                                                              Income Statement
 Cost of products and services               -87 908             -114 484
 Capitalised services                           974                   647
                                                                                               Extraordinary result includes result from the sale of the wafering
                                                                                                business as per 30 April 2019 of CHF 27 million and reversal of
 Operating income                            63 099     51.5%     120 064      51.7%
                                                                                                accruals
 Personnel expenses                          -57 368               -64 248
                                                                                               Cost reductions come with certain time lag and effects are not
 Other operating expenses                    -18 891               -26 575
 EBITDA                                      -13 159   -10.7%      29 241      12.6%
                                                                                                yet fully visible
                                                                                               Continuous effort to substantially reduce costs to safeguard
 Depreciation/impairment on PPE              - 4 976                -5 426
 Amortisation/impairment on intangibles       -3 005                -8 935
                                                                                                margins
 EBIT                                        -21 140   -17.2%      14 881       6.4%
 Financial result                             -3 885                -3 979
 Result from investment in associates           -661
 Ordinary result                             -25 686   -21.0%      10 901       4.7%
 Non-operating result                            61
 Extraordinary result                        27 676                   831
 Earnings before taxes                         2 052     1.7%      11 732       5.0%
 Income taxes                                   -269                -3 440
 Result                                        1 783     1.5%       8 292       3.6%

Meyer Burger Technology Ltd. Presentation for Investors, Analysts and Media, 15 August 2019                                                      18   © Meyer Burger
NET SALES
Net Sales
MCHF
                                         250       232
                                                   24
                                         200

                                         150                      123
                                                   169                                        Net sales
                                         100                       23
                                                                                                 Net sales of CHF 123 million
                                          50                       94
                                                                                                 Negative currency effects of CHF 4 million
                                                   39
                                           0                       6                             Sale of wafering business reduced sales in H1 by CHF 33 million
                                                 H1 2018        H1 2019
                                                                                                 The decrease in net sales adjusted for currency effects and the
                                               Spec. Tec. PV Wafering
                                                                                                  sale of the wafering business amounted to 36.8%

Net sales by region by HY 2019
 MCHF, numbers in brackets per HY 2018
                                                  Europe                                      Net sales by region
                                                MCHF 26, 21%
                                               (MCHF 66, 28%)                                  Asia, especially China, continued to be the most important region
                                                                                                with 73% in sales
                                                                       Asia
                                                                   MCHF 90, 73%
                                                                  (MCHF 159, 68%)
                      Americas
                     MCHF 7, 6%                                         RoW
                    (MCHF 7, 3%)                                     MCHF 0, 0%
                                                                   (MCHF 0.5, 1%)

Meyer Burger Technology Ltd. Presentation for Investors, Analysts and Media, 15 August 2019                                                     19   © Meyer Burger
SPLIT OF NET SALES

                                   By type of sales                                                  By currencies

                                                  0%                                                 10%          2%
                               14%                (2%)                                                            (11%)
                                                                                                      (6%)
                                (8%)

                                             18                                               10%                 3
                                                                                                             11
                                                                                              (4%)
                                                                                                     12
              19%
             (13%)
                                  23                                                                      MCHF 123
                                            MCHF 123
                                            (MCHF 232)                                                    (MCHF 232)
                                                                                                                                   78%
                                                                      82                                                           (79%)

                                                                                                                              97
                                                                           67%
                                                                           (77%)

                                        Equipment PV                                                                  CHF
                                                                                                                                       82
                                        Specialised Technologies                                                      EUR

                                        Services & spare parts PV                                                     USD
                                                                                                                      Other
                                        Others

 Note: Comparative figures reflecting HY 2018 are shown in brackets
Meyer Burger Technology Ltd. Presentation for Investors, Analysts and Media, 15 August 2019                                                 20   © Meyer Burger
OPERATING INCOME

Operating income after costs of products and services
MCHF

  150                                                                                         Operating income

                       51.7%                                  51.5%                            Decrease in operating income is driven by decreased sales in
                                                                                                first half-year 2019
                        120                                                                    Stable operating income margin despite lower sales prices for
  100                                                                                           standard PV technologies
                                                                                               Operating income margin is positively influenced by
                                                                                                4 percentage points due to change in work-in-progress
                                                                63
   50

    0
                      H1 2018                                H1 2019
                 Operating income             Operating income margin

Meyer Burger Technology Ltd. Presentation for Investors, Analysts and Media, 15 August 2019                                                    21   © Meyer Burger
PERSONNEL EXPENSES/
OTHER OPERATING EXPENSES
Personnel Expenses                  80
 MCHF

                                    60
                                                64                                            Personnel expenses
                                                                   57
                                    40                                                         Personnel expenses decreased by 10.7% to CHF 57 million
                                                                                                compared to H1 2018 due to management’s focus on a more
                                    20
                                                                                                flexible organisation
                                     0                                                         Thereof CHF 2 million due to sale of the wafering business
                                             H1 2018            H1 2019                         (78 FTEs transferred end April 2019)
                                                                                               FTEs 999 (30 June 2018: 1’227 FTEs)
Other Operating Expenses
 MCHF
                                    30

                                    25                                                        Other operating expenses
                                                27
                                    20                                                         Other operating expenses decreased by 28.9% to
                                    15                             19                           CHF 19 million
                                    10
                                                                                               Thereof CHF 1 million due to sale of the wafering business
                                     5

                                     0
                                             H1 2018            H1 2019

Meyer Burger Technology Ltd. Presentation for Investors, Analysts and Media, 15 August 2019                                                    22   © Meyer Burger
EBITDA

EBITDA                           40
 MCHF                                          12.6%

                                 20
                                                                                              EBITDA
                                               29
                                                                                               Reported EBITDA of CHF -13 million, margin of -10.7%
                                   0
                                                                    -13

                                 -20                               -10.7%
                                           H1 2018               H1 2019
                                           EBITDA         EBITDA margin
EBITDA H1 18 / H1 19
 MCHF
                                                                                              EBITDA impacts
                                                                                               Operating income as basis for EBITDA calculation decreased
                                                                                                by CHF 57 million
                                                                                               Positive impact of personnel and operating cost savings of
                                                                                                CHF 15 million

Meyer Burger Technology Ltd. Presentation for Investors, Analysts and Media, 15 August 2019                                                  23   © Meyer Burger
EBIT

EBIT                             20
 MCHF

                                              15
                                   0
                                                                                              EBIT
                                            6.4%
                                                                    -21                        Reported EBIT CHF -21.1 million, margin -17.2%
                                 -20
                                                                  -17.2%                       EBITDA as basis for EBIT calculation decreased by
                                                                                                CHF 42 million
                                 -40
                                            H1 2018              H1 2019

                                             EBIT         EBIT margin
EBIT H1 18 / H1 19
 MCHF

                                                                                              EBIT impacts
                                                                                               Lower depreciation and amortisation of CHF 6 million
                                                                                               Decline in line with expectations due to reduction in property,
                                                                                                plant and equipment and intangible assets, especially the final
                                                                                                amortisation of specific technologies in the previous year due to
                                                                                                the end of the amortisation lifecycle

Meyer Burger Technology Ltd. Presentation for Investors, Analysts and Media, 15 August 2019                                                      24   © Meyer Burger
RESULT

Result                           10
MCHF

                                                                                              Positive net result of CHF 2 million
                                  5
                                               8

                                                                     2
                                  0
                                           H1 2018              H1 2019

Result H1 18 / H1 19                                                                          Financial result
 MCHF
                                                                                               Stable compared to H1 2018
                                                                                               Includes CHF - 0.7 million result from associated company
                                                                                                (Oxford PV)
                                                                                              Extraordinary result
                                                                                               Includes CHF 27 million profit from sale of wafering business
                                                                                              Taxes
                                                                                               Income taxes reduced by CHF 3 million

Meyer Burger Technology Ltd. Presentation for Investors, Analysts and Media, 15 August 2019                                                     25   © Meyer Burger
BALANCE SHEET
In TCHF                                    30 Jun 19        in %    31 Dec 18       in %
Cash and cash equivalents                     31 688                   89 799
Trade and other receivables                   49 916                   48 188
Inventories                                   87 105                   78 564
Prepaid expenses and accrued income            8 232                   10 117
Total current assets                         176 942      50.5%       226 669     64.9%
Other long-term receivables                   30 612                     591                  Balance Sheet
Investments in associates                     36 712
                                                                                               Stable total assets
Property, plant and equipment                 76 375                   82 274
Intangible assets                              8 946                   11 930
                                                                                               Other long-term receivables include CHF 30 million cash
Deferred tax assets                           20 727                   27 689                   collateral for the bank guarantee facility
Total non-current assets                     173 372      49.5%       122 485     35.1%        The newly acquired investment in Oxford PV is shown in
Total assets                                 350 314     100.0%       349 153    100.0%
                                                                                                investments in associates
Financial liabiilities                          327                      331
Trade payables                                27 286                   17 331                  Repayment of mortgage loan of CHF 18 million reduces financial
Customer prepayments                          14 652                   34 422                   liabilities
Provisions                                     6 926                   13 762
                                                                                               Net debt of CHF 7.7 million
Other current liabilities                     37 338                   42 901
                                                                                                (31.12.2018: net cash CHF 34.2 million)
Total current liabilities                     86 531      24.7%       108 747     31.1%
Financial liabilities                         39 075                   55 298                  Equity ratio of 62.8% (31.12.2018: 52.0%)
Provisions                                      179                      309
Deferred tax liabilities                       2 598                     857
Other non-current liabilities                  1 882                    2 231
Total non-current liabilities                 43 734      12.5%        58 695     16.8%
Equity incl. minority interests              220 049      62.8%       181 711     52.0%
Total liabilities and equity                 350 314     100.0%       349 153    100.0%

Meyer Burger Technology Ltd. Presentation for Investors, Analysts and Media, 15 August 2019                                                   26   © Meyer Burger
CASH FLOW
MCHF

 In TCHF                                                       H1 19           H1 18

 Net result                                                    1 783            8 292

 Non-cash items                                              - 20 271          18 844

 Change in NWC                                               -39 067          -43 514         Cash flow statement
 Cash flow from operating activities                         -57 555          -16 378
                                                                                               Cash and cash equivalents decreased to CHF 32 million
 Investments in property, plant and equipment                 - 3 483          -1 768
                                                                                               Operating cash flow impacted by change in net working capital
 Sale of property, plant and equipment                         1 291

 Investments in intangible assets, net                          -134             -382          Positive investing cash flow due to sale of wafering business
 Sale of business activities                                  50 000              200          Financing cash flow impacted by repayment of mortgage facility
 Bank deposits with limited availability                     -30 000                            by CHF 18 million
 Cash flow from investing activities                          17 674           - 1 950

 Capital increase                                             .1 422

 Purchase of treasury shares                                                   -4 124

 Repayment of current financial liabilities                        -2             -40

 Borrowing of non-current financial liabilities                1 356

 Repayment of non-current financial liabilities              -18 000

 Cash flow from financing activities                         -18 068           -4 164

 Cash and cash equivalents at the beginning of the period     89 799          124 700

 Change in cash and cash equivalents                         -57 949          -22 492

 Currency translation effects on cash and cash equivalents      -162             -236

 Cash and cash equivalents at the end of the period           31 688          101 972

Meyer Burger Technology Ltd. Presentation for Investors, Analysts and Media, 15 August 2019                                                     27   © Meyer Burger
Q&A

Meyer Burger Technology Ltd. Presentation for Investors, Analysts and Media, 15 August 2019   28   © Meyer Burger
DISCLAIMER

Information in this presentation may contain “forward-looking statements”, such as guidance, expectations, plans, intentions or
strategies regarding the future. These forward-looking statements are subject to risks and uncertainties. The reader is cautioned
that actual future results may differ from those expressed in or implied by the statements, which constitute projections of possible
developments. All forward-looking statements included in this presentation are based on data available to Meyer Burger
Technology Ltd as of the date that this presentation is released. The company does not undertake any obligation to update any
forward-looking statements contained in this presentation as a result of new information, future events or otherwise.

This presentation is not being issued in the United States of America and should not be distributed to U.S. persons or
publications with a general circulation in the United States. This presentation does not constitute an offer or invitation to subscribe
for, exchange or purchase any securities. In addition, the securities of Meyer Burger Technology Ltd have not been and will not
be registered under the United States Securities Act of 1933, as amended (the "Securities Act"), or any state securities laws and
may not be offered, sold or delivered within the United States or to U.S. persons absent registration under an applicable
exemption from the registration requirements of the Securities Act or any state securities laws.

The information contained in this presentation does not constitute an offer of securities to the public in the United Kingdom within
the meaning of the Public Offers of Securities Regulations 1995. No prospectus offering securities to the public will be published
in the United Kingdom. Persons receiving this presentation in the United Kingdom should not rely on it or act on it in any way.

In addition, the presentation is not for release, distribution or publication in or into Australia, Canada or Japan or any other
jurisdiction where to do so would constitute a violation of the relevant laws or regulations of such jurisdiction, and persons into
whose possession this document comes should inform themselves about, and observe, any such restrictions.

Meyer Burger Technology Ltd. Presentation for Investors, Analysts and Media, 15 August 2019                                               29   © Meyer Burger
You can also read