Siltronic AG Q3 2019 Investor Presentation

Page created by Bobby Wise
 
CONTINUE READING
Siltronic AG Q3 2019 Investor Presentation
Siltronic AG
Q3 2019 Investor Presentation

                                © Siltronic AG
Siltronic AG Q3 2019 Investor Presentation
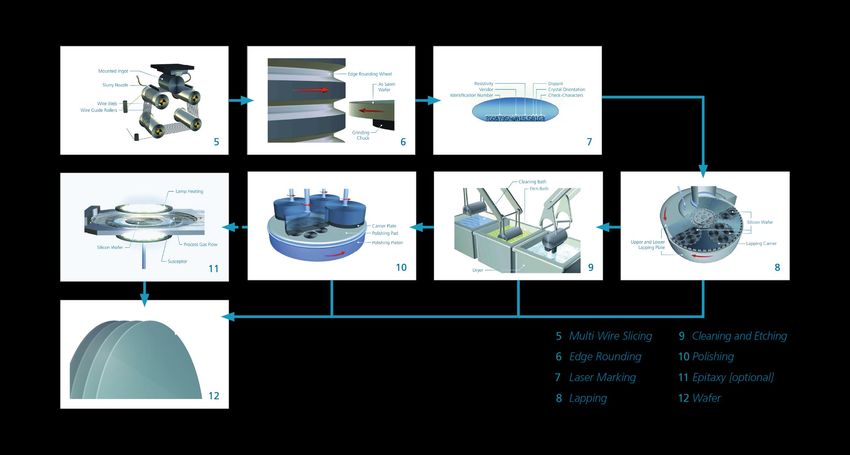
Siltronic has a relevant global market share…

Top 5 wafer producers serve more than 90% of market across all diameters

                                                         17%          11%

                                                                                  15%

                                              27%

                                                                         30%

                                       SK Siltron        Siltronic   Shin Etsu   Sumco   GlobalWafers

                                                                                                Sources: reported company revenues FY 2018, converted to USD million

          Siltronic AG – Q3 2019 Investor Presentation
          October 24, 2019
                                                                                                                                                           2 of 38
Siltronic AG Q3 2019 Investor Presentation
... and an international manufacturing network

                                                                                Freiberg         CP*   300 mm

                                                                    Germany
                  Portland                  200 mm

United States

                                                                                Burghausen       CP*   300 mm     SD*

►   Central R&D hub in Burghausen

►   High volume facilities for 300 mm
    in Germany and Singapore

►   Among world’s newest & largest                                              SSW        CP*    300 mm    SSP     200 mm
    fabs in Singapore
                                                                    Singapore

*CP = Crystal Pulling | *SD = 150 mm and smaller

                     Siltronic AG – Q3 2019 Investor Presentation
                     October 24, 2019
                                                                                                                        3 of 38
Siltronic AG Q3 2019 Investor Presentation
Customer base well diversified across all major semiconductor
 silicon wafer consumers

  Sony        TowerJazz Micron                                               Texas Instruments

Toshiba/Kioxia                                    Samsung                     Bosch
                                                                                         SK hynix
    Huali
                                                                                             NXP

            Renesas
 SMIC                                                                                            Nexperia

                                                            Mitsubishi
GlobalFoundries                                                           ON Semiconductor

                       TSMC                                                                  Infineon
                                                              Intel               UMC

   Top 10 customers represent ~75%                                       STMicroelectronics
   of 2018 revenues

             Siltronic AG – Q3 2019 Investor Presentation
             October 24, 2019
                                                                                                     4 of 38
Siltronic AG Q3 2019 Investor Presentation
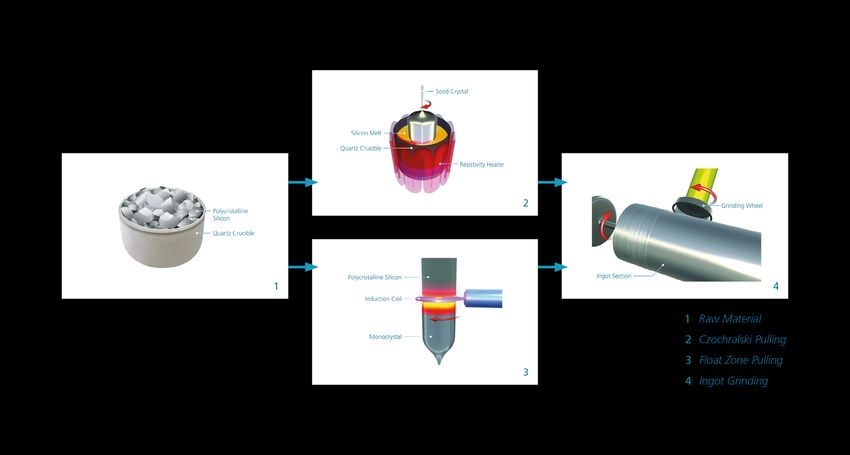
Siltronic is focused on growing 300 mm and attractive 200 mm
business.
Development of total wafer demand per diameter, in mn 300 mm equivalents per month

                                                                                             Strong
7                                                                                            demand
        300 mm       200 mm             SD (pol/epi)                                            &
6                                                                                            growth

5

4

3                                                                                            Stable &
                                                                                             attractive
2

1                                                                                            Mid-term
                                                                                             decline
0
 2010   2011     2012         2013          2014          2015   2016   2017   2018   2019
                                                                                             Source: SEMI up to Sep 2019

           Siltronic AG – Q3 2019 Investor Presentation
           October 24, 2019
                                                                                                               5 of 38
Siltronic AG Q3 2019 Investor Presentation
Production process - ingot growing

       Siltronic AG – Q3 2019 Investor Presentation
       October 24, 2019
                                                      6 of 38
Siltronic AG Q3 2019 Investor Presentation
Production process - wafering

       Siltronic AG – Q3 2019 Investor Presentation
       October 24, 2019
                                                      7 of 38
Siltronic AG Q3 2019 Investor Presentation
Outstanding cost reduction and efficiency improvement track
record

             Number of employees                                     Variable costs of 300 mm wafer   300 mm Productivity1 (Germany)
                                                                                (Germany),
                                                                              in EUR / Wafer
     6,953
                                                                                >-40%

                                                3,914                                                                >100%
                 from 7 to 4 Sites

     2002                                       2018
                                                2018            2010                          2015
                                                                                              2018       2009                       2015
                                                                                                                                    2018

          Successful restructuring                                    More than 40% reduction of         Almost 100% increase of
                                                                      the variable unit costs in         employee productivity in
                                                                      300 mm wafer                       300 mm wafer

1   Delivered wafer / paid hours (2009 = 100)

                      Siltronic AG – Q3 2019 Investor Presentation
                      October 24, 2019
                                                                                                                                    8 of 38
Siltronic AG Q3 2019 Investor Presentation
All investment to be finished as planned in 2019;
Capex for capacity will come down in 2020

Investment, in EUR million
                                                                             Comment
                                                                             Comments
                                               ~350e
 Prepayments for 2020                                                         Capex 2019
 capacity increase
 Capex crystal pulling                                                          around EUR 350 million with a strong
 hall                            257                                              focus on capabilities and automation
 Capex for 70k/m                 ~20                                              and also on 300 mm expansion based
                                                                                  on LTAs
 Base Capex                      ~50

                                                             significantly    Capex 2020
                                                             lower in 2020      significantly lower
                123             ~110
                ~30

                ~90
                                 ~80
    54

 Ø 2014-        2017            2018           2019e           2020e
  2016

              Siltronic AG – Q2 2019 Investor Presentation
              October 24, 2019
                                                                                                                  9 of 38
Siltronic AG Q3 2019 Investor Presentation
Cost-competitiveness a pre-requisite

Major cost items                                            Cost development 2019

                                                                                                             Productivity
 Labour                                                    Supplies                                            improvement
                                                                                                             Supplies savings
                                                            COLA (cost of                                    Recycling
                                                            living adjustment)

 Supplies                                                                                                   Energy savings

                                                            Electricity
 Depreciation

                                                            Renewable
 Polysilicon                                               energy
                                                            surcharge

 Energy
                                                                           Unit cost increase   Cost roadmaps

             Siltronic AG – Q3 2019 Investor Presentation
             October 24, 2019
                                                                                                                         10 of 38
Ongoing focus on pricing and productivity

Actions to cope with lower loading

 Maintain pricing                                          Reduce temporary workers in Germany
 No pre-production                                         Reduce overtime / time accounts
 Shut down unused equipment                                Unpaid vacation in US
 Keep loading high @low-cost sites                         Acceleration of cost savings
                                                             (more time for testing)
 High focus on productivity
 Operator waiting for equipment > equipment
  waiting for operator

            Siltronic AG – Q3 2019 Investor Presentation
            October 24, 2019
                                                                                                   11 of 38
Several levers to improve profitability

                                               Improve EBITDA margin and
                                                high cash flow generation

                                                           Financial focus

     Value creation                                            Product mix               Cost reduction

   Shift value creation                                     300 mm leading-edge       Cost competitiveness,
      to Singapore                                         technology and shift to   automation, digitalization
                                                             higher value-adding
                                                             products in 200 mm

            Siltronic AG – Q3 2019 Investor Presentation
            October 24, 2019
                                                                                                             12 of 38
Financials improved strongly over the last years
Adjusted financial figures                                                                                                                                                       Q1- Q3
(EUR million)
                                                                              2015                        2016                       2017                    2018
                                                                                                                                                                                   2019
Sales                                                                        931.3                       933.4                  1,177.3                  1,456.7                    966.0

EBIT                                                                              2.7                       27.0                    235.7                   497.7                   241.6

EBIT margin in %                                                                  0.3                         2.9                     20.0                    34.2                     25.0

EBITDA                                                                       124.0                       146.0                      353.1                   589.3                   318.7

EBITDA margin in %                                                              13.3                        15.6                      30.0                    40.5                     33.0

Earnings per share                                                           (0.50)                         0.40                      6.18                  12.44                      6.31

Capex                                                                           75.0                        88.8                    123.2                   256.9                   266.5

Free cash flow                  1                                               37.4                        19.0                    169.6                   416.4                      23.9

Net cash flow               1                                                         -                     39.6                    124.8                   240.4                      72.4

Dividend                                                                              -                           -                   75.0                  150.0                            -
1   In 2018, Siltronic started reporting the key figure „net cash flow“ instead of „free cash flow“. Net cash flow represents free cash flow without the time shifts created by inflow and
    return of customer prepayments which, due to the size, impairs the meaningfulness of free cash flow.

                      Siltronic AG – Q3 2019 Investor Presentation
                      October 24, 2019
                                                                                                                                                                                     13 of 38
Clear commitment to sustainability
Sustainability at Siltronic AG

 Claim: We understand sustainability as responsible action for society and
  want to generate competitive advantages through sustainable action.

 Strategy: We plan resource-saving right from the start, based on product and
  production safety as well as health and environmental protection.

 Voluntary commitments: We follow the principles of the Sustainable
  Development Goals, the United Nations Global Compact, and the Responsible
  Care and Responsible Business Alliance initiative.

 Goal: We want to reconcile the effects of our business activities with the
  expectations and needs of society.

Investor-Rating: Since 2018, we have been analyzed by ISS-oekom, one of the
world's leading rating agencies for sustainable investments, and assessed with
regard to the ESG criteria (Environment, Social, Governance). Right from the start,
we were awarded ‘Prime’ status for our sustainability activities.

            Siltronic AG – Q3 2019 Investor Presentation
            October 24, 2019
                                                                                      14 of 38
Environment - Efficiency as a success factor
Selection of non-financial performance indicators in 2018

  Raw Material                                            Energy
                                                                        Energy consumption
                               Silicon yield                              per wafer area
                               improved by                                 decreased by

                             1%                                           3%
                                vs. 2017                                        vs. 2017

    Recycling                                             Occupational Safety
                     The share of returnable                            The number of accidents
                      packaging per wafer                                 at work per 1 million
                           area was                                        hours worked was

                      32 %                                                      1.9
           Siltronic AG – Q3 2019 Investor Presentation
           October 24, 2019
                                                                                             15 of 38
Investor structure well diversified with a strong anchor
shareholder

                                                                     Identified free float by region
                                                                     (State: December 31, 2018)

                             42.2 %                                                     29%            26%

                                                            69.2 %

   100 %                                                                                 19%          26%

                                                                                 USA      UK      Germany    Other
                             57.8 %
                                                                     Significant notifications of voting rights
                                                                     (as of October 23, 2019)
                                                            30.8 %
                                                                     State of Norway                                 4.93 %
                                                                     Goldman Sachs                                   4.55 %
   pre-IPO                  post IPO               since March 15,   BlackRock, Inc.                                 3.85 %
                                                        2017
                                                                     DWS                                             3.10 %
         Wacker Chemie AG                      Free Float

             Siltronic AG – Q3 2019 Investor Presentation
             October 24, 2019
                                                                                                                     16 of 38
Siltronic strategy - capitalize on market opportunities while focusing
on 300 mm & technological leadership

                                             Optimize returns,
                                       stay ahead in technology and
                                           grow with the market

                                                          Strategic Focus

  Grow                           Ensure                           Improve                 Execute
  with the market                technology &                     financial performance   cost reduction
                                 quality leadership               & cash flow             roadmaps &
                                                                                          debottlenecking
                                                                                          concepts

  We continuously increase the value for our stakeholders by providing best-in-class wafers
                                   at competitive costs.

           Siltronic AG – Q3 2019 Investor Presentation
           October 24, 2019
                                                                                                        17 of 38
MARKET UPDATE

                © Siltronic AG
Market development
Economic sentiment softens across major economies
 GDP grew at a slower pace QoQ while PMI is in negative territory for all major regions
 Unemployment remains low in most regions
 Consumer confidence varies from region to region

Silicon wafer volumes down
 Q3 SEMI market was ~6.3 bn cm²/month, -1.7% below Q2 19 average and -9.9% YoY
 Siltronic expects market weakness to carry well into 2020

Wafer demand impacted by high inventories
 Demand for 150 mm further down in Q3 and Q4, price pressure on quarterly contracts
 Standard products in 200 mm down while special products still high, some price pressure on less
  loaded products
 Demand for 300 mm slightly down as customer inventories remain high and customers shifted
  volumes under LTAs; pricing under existing LTAs firm, non-LTA prices may decline slightly in 2020

                                                                                   Sources SEMI up to Sep. 2019 /Siltronic

            Siltronic AG – Q3 2019 Investor Presentation
            October 24, 2019
                                                                                                               19 of 38
End markets expectations for early 2020 rather flattish: visibility
for 2020 extremely low

Smartphones                    PCs/Laptops                                  Servers                               Automotive                               Industrial

 Volumes expected           Volumes expected                        Data center growth                      Car volumes have                        Silicon demand
  to be flat                  to be rather flattish                    expected to be                           been softening                           partly impacted by
 Silicon content            But increasing                           “slower”                                Content should be                        reduced capex
  growth depend on            NAND content                            But with “upside                         driven by further                       Content growth
  mix effect                                                           risk”, compounded                        ADAS                                     expected to
                                                                       by machine                               implementation and                       continue
                                                                       learning                                 electrification
                                                                       applications which                      The latter could be
                                                                       drive memory and                         impacted short-
                                                                       logic content                            term by consumer
                                                                                                                acceptance in
                                                                                                                Europe

                  Pictures: zapp2photo/stock.adope.com, Denis Rozhnovsky/stock.adobe.com, phonlamaiphoto/stock.adobe.com, ekkasit919/stock.adobe.com, denisismagilov/stock.adobe.com
                                                                                                                                                            Source: Siltronic Oct. 2019

            Siltronic AG – Q3 2019 Investor Presentation
            October 24, 2019
                                                                                                                                                                            20 of 38
Silicon outlook:
Demand muted due to high inventories

Silicon demand drivers
            Units in 2020            Content           Die / density Semi device inventories   Impact
                                                                          end of 2019

 Smart-
 phones

  PCs
              computing

 Server

 Industry

  Cars

                                                                                                    .   Siltronic Marketing Oct. 2019

            Siltronic AG – Q3 2019 Investor Presentation
            October 24, 2019
                                                                                                                         21 of 38
FINANCIALS
Q3 2019

             © Siltronic AG
Sales development negatively impacted by lower wafer area
demand

Sales, in EUR million                                             Ø FX rates Q3/18    Q4     Q1/19   Q2      Q3
                                                                  EUR / USD    1.16   1.14   1.14    1.12   1.11

                                                                  EUR / JPY    130    129    125     124    124

                                                                  Comment

                                                                   Sales in Q3 down as expected due to lower
                                                                    wafer area sold and minimal price
 379.8    388.1                                                     reductions especially in SD and some in
                         354.4                                      200 mm
                                          311.8           299.8    ASP in EUR Q1-Q3 2019 up compared to
                                                                    2018

Q3 2018    Q4          Q1 2019             Q2             Q3

           Siltronic AG – Q2 2019 Investor Presentation
           October 24, 2019
                                                                                                            23 of 38
Higher energy costs and depreciation burden cost of sales
Cost of Sales, in EUR million                                      Gross profit, in EUR million / Gross margin, in %

                                                                       46.1     46.4
                                                                                          40.8
                                                                                                   36.1     34.6

   204.8     208.1           209.9           199.4         196.1
                                                                      175.0     180.0    144.5    112.4     103.7

  Q3 2018      Q4          Q1 2019             Q2          Q3        Q3 2018     Q4     Q1 2019    Q2       Q3

Other currency effects (mostly hedging),                           Comment
in EUR million
                                                                    COGS y-o-y declined only slightly as lower
                                                                     costs for materials and supplies were largely
                                                                     offset by higher energy costs and depreciation
    -1.6                                                            COGS q-o-q declined by 1.7%. Lower
              -4.8
                              -8.2            -6.9         -7.7      personnel and supplies’ costs partly offset by
                                                                     higher depreciation
                                                                    Negative effects from currency hedging
                                                                     increased q-o-q
  Q3 2018     Q4          Q1 2019             Q2           Q3

            Siltronic AG – Q2 2019 Investor Presentation
            October 24, 2019
                                                                                                                 24 of 38
High US-Dollar and Japanese Yen exposure

FX exposure, in %                                        Sensitivity

                                                         1 USD-cent change
        ~ 10%
                                                          ~ EUR 8.0 million sales
        ~ 25%                      exposure               ~ EUR 6.5 million EBITDA unhedged
                                                          ~ EUR 4.5 million EBITDA after hedging

                                                         1 JPY change
                                                ~65%
                                                          ~ EUR 2.5 million sales
        ~ 65%
                                                          ~ EUR 2.0 million EBITDA unhedged
                                                          ~ EUR 1.0 million EBITDA after hedging

         Sales                                  Costs
              USD        SGD       JPY       EUR

          Siltronic AG – Q2 2019 Investor Presentation
          October 24, 2019
                                                                                                25 of 38
Profitability affected by lower loading, higher energy costs and
slightly increased depreciation

EBITDA, in EUR million / EBITDA margin, in %                      Depreciation, in EUR million

   42.2      41.4
                            35.9
                                            32.1           30.5

   160.2    160.8
                           127.2
                                           100.0           91.5

                                                                    -22.2     -21.9    -23.8     -25.4   -27.9
  Q3 2018     Q4         Q1 2019           Q2              Q3
                                                                   Q3 2018     Q4     Q1 2019    Q2       Q3

EBIT, in EUR million / EBIT margin, in %                          Comment

    36.3     35.8
                                                                   Q-o-q decline of EBITDA margin mitigated by
                            29.2
                                                                    lower COGS
                                           23.9
                                                           21.2    EBIT margin impacted by slow business, higher
                                                                    energy costs and higher depreciation
   138.0    138.9
                           103.4
                                           74.6            63.6

  Q3 2018     Q4         Q1 2019            Q2             Q3

            Siltronic AG – Q2 2019 Investor Presentation
            October 24, 2019
                                                                                                                 26 of 38
Net profit of EUR 216 million in Q1-Q3 2019
Net profit, in EUR million                                             EPS, in EUR

   114.6                                                                   3.53      3.25
               106.0
                                87.6                                                          2.68
                                                68.5            59.5                                    1.98     1.65

  Q3 2018        Q4          Q1 2019            Q2              Q3       Q3 2018     Q4     Q1 2019     Q2       Q3

Dividend payment, in EUR million                                       Comment

                                                                        Net profit EUR 215.6m in Q1-Q3
                                                                        Tax rate down to 12% in Q1-Q3
                                                                        General dividend policy: pay-out ratio of approx.
                                                              150        40% of net income attributable to shareholders
                                   75
           0

     FY 2017                  FY 2018                    FY 2019

               Siltronic AG – Q2 2019 Investor Presentation
               October 24, 2019
                                                                                                                    27 of 38
Balance sheet September 30, 2019
Balance sheet, in EUR million

                        Sept 30,         Dec 31, Comments                 Equity and            Sept 30,   Dec 31, Comments
Assets
                         2019             2018 Sept 30, 2019              liabilities            2019       2018 Sept 30, 2019
Non-current              1,033.3           762.8                          Equity                 809.0     915.7
  PP&E                    887.7            683.9                            Siltronic            752.9     887.2
                                                       21 intangibles
  Other                    46.7             47.6                            Other                                    Samsung’s 22% in
                                                       (related to SSW)                          56.1       28.5     SSW
                                                                            shareholders
  Lease                    45.3              ---
                                                                          Liabilities           1,100.0    902.5
  Fixed term
                                                                            Provisions for
  deposits and             53.6             31.3                                                 565.6     362.3     Germany and US
                                                                            pensions
  securities
                                                                                                                     Around 40 personnel
Current                   875.7          1,055.4                            Other provisions     130.2     138.2     related (e.g. early
                                                                                                                     retirement)
  Inventories and
                          183.8            168.0
  contract assets                                                           Trade liabilities    112.5      96.6
  Trade
                          135.7            156.3                            Customer
  receivables                                                                                    183.7     231.7
                                                                            prepayments
  Other assets             29.4             69.8                                                                     Change and liability
                                                                            Other                62,4       73.7     mainly employee-
  Cash, fixed term                                                                                                   related
  deposits and            526.8            661.3
  securities                                                                Lease                45,6        ---
Total                    1,909.0        1,818.2                           Total                 1,909.0    1,818.2

              Siltronic AG – Q3 2019 Investor Presentation
              October 24, 2019
                                                                                                                                       28 of 38
Working Capital up q-o-q but down y-o-y
Working capital, in EUR million,                                           Inventories and contract assets, in EUR million
Working capital ratio to quarterly sales, in %
                                                                                          Inventories   Contract assets
    60                                                      69
              59             56             58
                                                                      60

                                                                      40                                                  183.8
                                                                                        168.0       177.4      180.2
                                                                               152.0
   227.8    227.7          199.4                           207.0      20
                                          182.4

                                                                      0
  Sep 18    Dec 18        Mar 19         Jun 19            Sep 19             Sep 18    Dec 18      Mar 19     Jun 19     Sep 19

Trade receivables, in EUR million                                          Trade liabilities, in EUR million

   167.4     156.3           146.5                           135.7
                                             120.1                             91.6      96.6       124.5      117.9      112.5

   Sep 18   Dec 18          Mar 19          Jun 19           Sep 19           Sep 18    Dec 18     Mar 19     Jun 19      Sep 19

            Siltronic AG – Q3 2019 Investor Presentation
            October 24, 2019
                                                                                                                             29 of 38
Strong equity ratio and solid net financial assets
Equity, in EUR million                                 Provisions for pensions,                         Net financial assets,
Equity ratio, in %                                     in EUR million                                   in EUR million

        50.4
 48.4             48,4

                            43.4      42.4

                                                       Interest rates IFRS
                                                       USA      4.02% 4.08%     3.69%   3.37%   2.99%

                                                       Germany 2.04%    1.98%   1.66%   1.29%   0,97%

        916       968
                                                                                                                       762
 842                                  809                                                                  714   691
                            804
                                                                                                566                          592    579
                                                                                         503
                                                                                 422
                                                              374      362

 Sep    Dec       Mar       Jun       Sep                     Sep      Dec       Mar     Jun    Sep        Sep   Dec   Mar   Jun    Sep
 18     18        19         19        19                     18       18        19       19    19          18   18    19     19     19

               Siltronic AG – Q3 2019 Investor Presentation
               October 24, 2019
                                                                                                                                   30 of 38
Pension reserves impacted by low IFRS interest rates
DBO and pension reserves, in EUR million                                         Comment

                  1228                            ~850              662           DBO of EUR 1,228 million – assets of
                                                                                   EUR 662 million = EUR 566 million
 USA mostly
 funded
                   147       2,99%                 147       3%                   Pension reserves @3% = DBO of EUR
                                                                     115
                                                                                   850 million – assets EURO 662 million =
 Germany           206       0,97%                           3%                    EUR 188 million
 unfunded                                         ~140
                                                                     34
                                                                                  IFRS interest uses bond yields only,
                                                                                   assets include bonds, equity, real estate +
                                                                                   derivatives

                                                                                  Wacker pension fund
 Funded through
    Wacker         875                                                              fully funded under German pension fund
  Pension Fund               0,97%                ~560       3%      513             regulations using 3.54% interest rate

                                                                                    asset liability study: probability of return
                                                                                     in next 20 years:
                                                                                     ≥3.75% 56%

                                                  DBO             Assets Sept,
                                                                                     ≥3.0% 80%
              DBO Sept,
                2019                              @3%                2019            ≥2.5% 91%

              Siltronic AG – Q3 2019 Investor Presentation
              October 24, 2019
                                                                                                                        31 of 38
Strong net cash flow despite high payments for capex
Operating cash flow (OCF), in EUR million                          Customer prepayments net (PP), in EUR million

   165.4
                             131.1
              80.7                            79.1         74.4
                                                                      18.7      4.4

  Q3 2018      Q4          Q1 2019            Q2           Q3                              -16.7    -16.2   -15.5
                                                                     Q3 2018    Q4        Q1 2019    Q2      Q3

CF Capex, in EUR million                                           Net cash flow (NCF), in EUR million

                                                                       93.0                 80.8

                                                                                                     0.4
   -53.7                     -67.1                                                                           -8.8
            -108.5                           -94.9         -98.7                -32.2

  Q3 2018      Q4          Q1 2019            Q2           Q3        Q3 2018     Q4       Q1 2019   Q2       Q3
                                                                   NCF= OCF-PP+CF Capex

            Siltronic AG – Q3 2019 Investor Presentation
            October 24, 2019
                                                                                                               32 of 38
OUTLOOK

          © Siltronic AG
Siltronic Outlook 2019 (as of October 24, 2019)

     EBITDA margin                   between 30% and 35%

          EBIT
                                     significantly below 2018

      Net cash flow                  clearly positive, approx. EUR 180m below 2018

          Sales
                                     depending on timing of market recovery and on FX effects around 10% to 15% below 2018

      Cost position
                                     negative effect due to tariff increases and EUR 20m higher electricity costs in Germany

        FX effects
                                     negligible vs. 2018 assuming EUR/USD rate of 1.15 and EUR/JPY rate of 130

       Depreciation
                                     around EUR 110m

         Tax rate
                                     between 10% and 15%

         Capex
                                     about EUR 350m in capacity, automation and capabilities, significantly lower in 2020

    Earnings per share               significantly below 2018

          Siltronic AG – Q3 2019 Investor Presentation
          October 24, 2019
                                                                                                                             34 of 38
APPENDIX

           © Siltronic AG
Contact and Additional Information

Issuer and Contact                                              Additional Information

Siltronic AG                                                    ISIN:               DE000WAF3001
Hanns-Seidel-Platz 4                                            WKN:                WAF300
D-81737 München                                                 Deutsche Börse:     WAF
                                                                Listing:            Frankfurt Stock Exchange
Investor Relations:
                                                                                    Prime Standard
Petra Mueller
Email: petra.mueller@siltronic.com
Tel. +49 89 8564-3133

Financial Calendar
Preliminary figures FY 2019                  January 29, 2020

            Siltronic AG – Q3 2019 Investor Presentation
            October 24, 2019
                                                                                                        36 of 38
Disclaimer

The information contained in this presentation is for background purposes only and is subject to
amendment, revision and updating. Certain statements contained in this presentation may be
statements of future expectations, future financial performance and other forward-looking statements
that are based on management's current views and assumptions and involve known and unknown risks
and uncertainties. In addition to statements which are forward-looking by reason of context, including
without limitation, statements referring to risk limitations, operational profitability, financial strength,
performance targets, profitable growth opportunities and risk adequate pricing, words such as "may”,
“will”, “should”, “expects”, “plans”, “intends”, “anticipates”, “believes”, “estimates”, “predicts”, “continue”,
“projects” or “seeks”, “potential”, “future”, or “further” and similar expressions may identify forward-
looking statements. By their nature, forward-looking statements involve a number of risks, uncertainties
and assumptions which could cause actual results or events to differ materially from those expressed or
implied by the forward-looking statements. These include, among other factors, changing business or
other market conditions, currency and interest fluctuations, introduction of competitive products, poor
acceptance of new products and services, change of the corporate strategy and the prospects for
growth anticipated by the management. These and other factors could adversely affect the outcome and
financial effects of the plans and events described herein. Statements contained in this presentation
regarding past trends or activities should not be taken as a representation that such trends or activities
will continue in the future. Siltronic AG does not undertake and does not intent to undertake any
obligation to update or revise any statements contained in this presentation, whether as a result of new
information, future events or otherwise. In particular, you should not place any reliance on forward-
looking statements which speak only as of the date of this presentation.

             Siltronic AG – Q3 2019 Investor Presentation
             October 24, 2019
                                                                                                          37 of 38
SILTRONIC AG |   Hanns-Seidel-Platz 4
                 81737 Munich
                 Germany

                                        © Siltronic AG
You can also read