INVESTOR PRESENTATION - FULL YEAR FY2018 17 AUGUST 2018 - MYSTATE LIMITED

Page created by Louise Simon
 
CONTINUE READING
INVESTOR PRESENTATION - FULL YEAR FY2018 17 AUGUST 2018 - MYSTATE LIMITED
17 August 2018

INVESTOR
PRESENTATION
FULL YEAR FY2018
INVESTOR PRESENTATION - FULL YEAR FY2018 17 AUGUST 2018 - MYSTATE LIMITED
AGENDA

FY18 INVESTOR PRESENTATION

1. Highlights & strategy
   Melos Sulicich
   Managing Director & CEO

2. Financial results
   David Harradine
   Chief Financial Officer

3. Strategy & outlook
   Melos Sulicich
   Managing Director & CEO

         FY18 FULL YEAR INVESTOR PRESENTATION | 2
INVESTOR PRESENTATION - FULL YEAR FY2018 17 AUGUST 2018 - MYSTATE LIMITED
HIGHLIGHTS &     Key highlights
STRATEGY
                 Results
MELOS SULICICH                    FY18 FULL YEAR INVESTOR PRESENTATION | 3
INVESTOR PRESENTATION - FULL YEAR FY2018 17 AUGUST 2018 - MYSTATE LIMITED
KEY HIGHLIGHTS

    Growth across key financial metrics and underlying performance drivers

    Growing contribution from digital channels with increased customer adoption and advocacy

    Continued momentum in bank balance sheet and FUM growth and soundly capitalised for
     future growth

            High customer advocacy, disciplined strategy execution and increasing
             customer uptake of digital are underpinning MyState’s performance

                                                                FY18 FULL YEAR INVESTOR PRESENTATION | 4
INVESTOR PRESENTATION - FULL YEAR FY2018 17 AUGUST 2018 - MYSTATE LIMITED
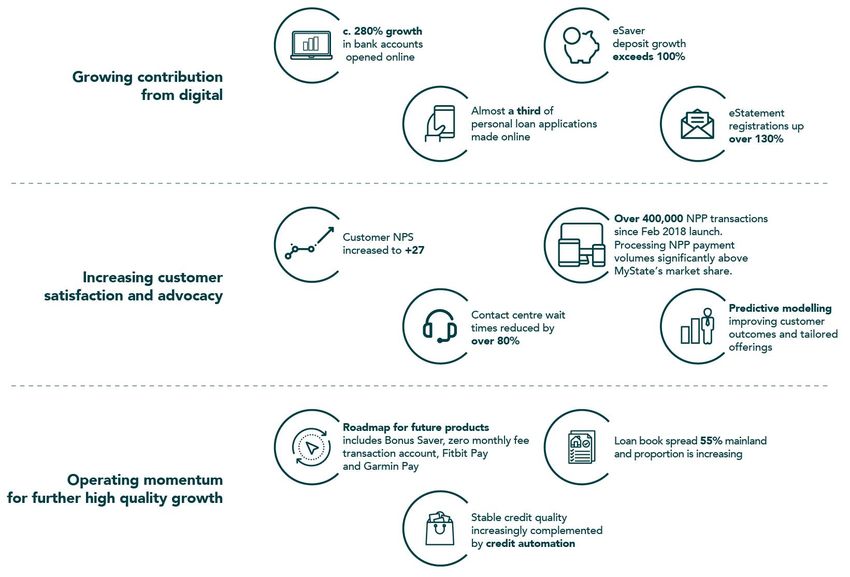
KEY METRICS AND PERFORMANCE DRIVERS

                                                                                                                 Change on FY17 results except where otherwise stated

                                                                        Total income:                                       Net interest income:
                                                                        $126.3m                                  +1.4%      $90.8m                            +3.1%
             Solid
       performance and
       growth across all                                                Net profit after tax:                               Earnings per share:
          key metrics                                                   $31.5m                                   +4.6%      34.97 cps                       +0.93cps

                                                                        Fully franked dividend:
                                                                                                           +0.25cps         Return on average equity:          +9bps
                                                                        28.75 cps 1                                         10.1%
          Increased full year
         dividend of 28.75cps
          and final dividend                                            Cost to income:                                     Total capital ratio:
                                                                                                                -190bps                                      +18bps
           steady at 14.5cps                                            64.0%                                               13.47% 2
              fully franked
                                                                        Home loan book:                                     Funds under management:
                                                                        $4.4b                                    +6.9%      $1.15b                            +5.9%
                                                                        1.2x system

  1.   Final dividend of 14.5cps payable to shareholders on the register at the record date of 24 August 2018
  2.   11.51% CET1 (FY17: 11.28%)

                                                                                                                  FY18 FULL YEAR INVESTOR PRESENTATION | 5
INVESTOR PRESENTATION - FULL YEAR FY2018 17 AUGUST 2018 - MYSTATE LIMITED
FINANCIAL         Results summary   Credit profile   Tasmanian economy

RESULTS           Performance       Funding          Shareholder returns
                  Loan book         Wealth
DAVID HARRADINE                                      FY18 FULL YEAR INVESTOR PRESENTATION | 6
INVESTOR PRESENTATION - FULL YEAR FY2018 17 AUGUST 2018 - MYSTATE LIMITED
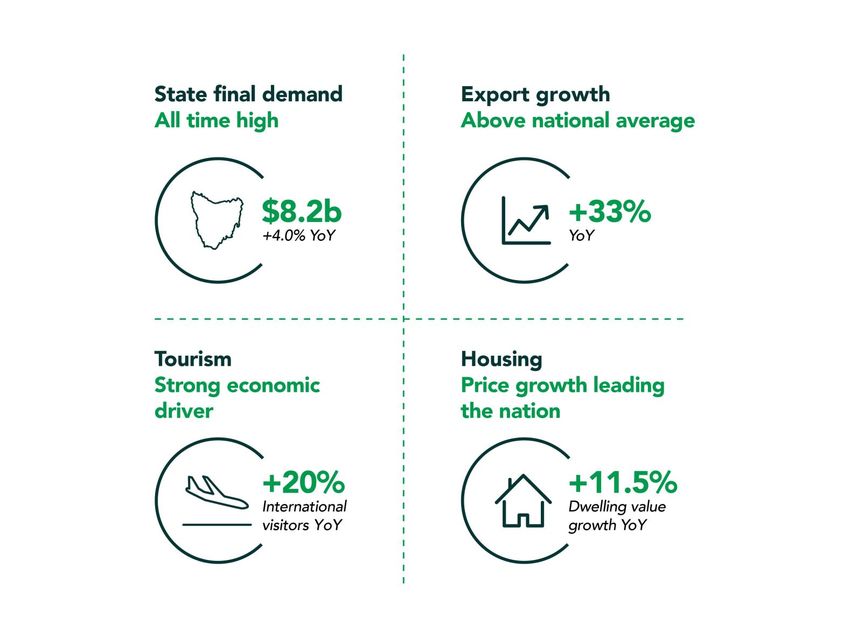
IMPROVING OPERATING LEVERAGE DELIVERING GROWTH

                                                                                                                                   Change
                                                                                                               FY18    FY17
                                                                                                                                   (v FY17)

  Revenue growth
                                                                   Total operating income ($m)                 126.3   124.6          +1.4%

      and cost                                                     Operating expenses (excl. BDD)
                                                                   ($m)
                                                                                                               80.9    82.2            -1.5%
   containment
 delivered positive                                                Net Profit after tax ($m)                   31.5    30.1           +4.6%
 jaws and a lower
cost to income ratio
                                                                   Earnings per share (cps)                    34.97   34.04          +2.7%

                                                                   Net interest margin (%)                     1.89    1.93            -4bps

                                                                   Cost to income ratio (%)                    64.0    65.9           -190bps
       Momentum in banking and                                     Total capital ratio (%) 1                   13.47   13.29          +18bps
      wealth with home loan book
     growing +2x system in 2HFY18                                  Return on average equity (%)                10.1    10.0           +9bps
       and wealth FUM and FUA
           growing strongly
                                                                   Return on tangible equity (%)               13.7    13.4           +28bps

                                                                   Dividend – fully franked (cps) 2            28.75   28.50         +0.25cps

                                                                   Dividend payout ratio (%)                    83      84             -1.0%
                                                                   Credit performance –
                                                                   30 day arrears (%)
                                                                                                               0.47    0.51            -4bps

1.    11.51% CET1 (FY17: 11.28%)
2.    Final dividend of 14.5cps payable to shareholders on the register at the record date of 24 August 2018

                                                                                                               FY18 FULL YEAR INVESTOR PRESENTATION | 7
INVESTOR PRESENTATION - FULL YEAR FY2018 17 AUGUST 2018 - MYSTATE LIMITED
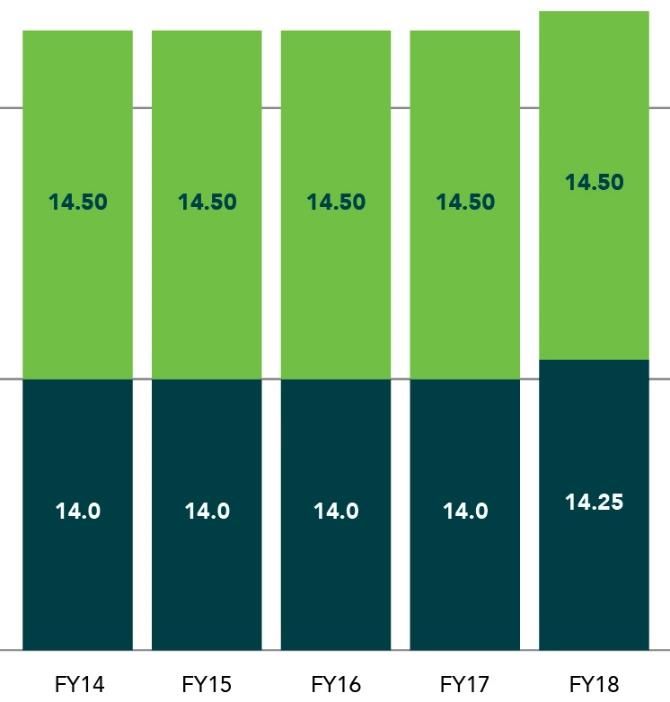
MARGIN COMPRESSION IN COMPETITIVE ENVIRONMENT

                                                                                                                      BBSW
   Significant increase in BBSW during                                                  2.20
    2H18 impacted funding costs                                                          2.10
                                                                                         2.00
   Net interest margin down -4bp on pcp

                                                                              BBSW (%)
                                                                                         1.90
                                                                                         1.80
   Lending market remains highly                                                        1.70
    competitive                                                                          1.60
                                                                                         1.50
                                                                                             Jul Aug Sep Oct Nov Dec Jan Feb Mar Apr May Jun
                                                                                            2017 2017 2017 2017 2017 2017 2018 2018 2018 2018 2018 2018

                                                                                                               BBSW 1M       BBSW 3M

        NIM waterfall
2.30%
                           Origination costs        Increase       Decrease                                                                NIM trend
2.10%                                                                                                 2.13%
        0.19%                                                                                                     1.93%      1.94%                 1.89%
                                                                                                                                        1.84%
                 0.07%                                                       0.21%

1.90%                        0.02%                    0.02%      0.02%
                                         0.01%

1.70%   1.93%                                                                1.89%

1.50%
        FY17    Asset price Origination Asset mix    Funding   Funding mix    FY18
                                                                                                       FY16       FY17       1H18       2H18        FY18
                               costs                  price

                                                                                                                 FY18 FULL YEAR INVESTOR PRESENTATION | 8
INVESTOR PRESENTATION - FULL YEAR FY2018 17 AUGUST 2018 - MYSTATE LIMITED
CONTINUED DISCIPLINED COST MANAGEMENT

                   Operating costs declined -1.5% below pcp

                   Continued focus on re-shaping the cost base to enable investment in customer acquisition, marketing
                    and digital capability

                   Administration costs managed well below pcp

                   Depreciation and amortisation increased on pcp as higher levels of investment in technology began to
                    be amortised

                        Operating expenditure
               84

                                                                                    $0.80
  $ Millions

               83
                                                                      $0.23
                                             $0.13       $0.16                                    $2.48
               82
                                  $0.10

               81                                                                                                $0.11       $0.09

               80      $82.16

                                                                          -1.5% growth                                                  $80.90
               79

               78
                        FY17     Payment   Personnel   Technology   Marketing   Depn & Amort. Administration   Occupancy   Governance   FY18
                                  system                                                        and other

                                                                                                    FY18 FULL YEAR INVESTOR PRESENTATION | 9
NPAT UNDERPINNED BY NII GROWTH AND WEALTH
                    Net profit before tax growth of 6.5% and NPAT growth of 4.6%

                    Strong NII growth despite continued competition in lower risk, lower LVR lending

                    Wealth growth across all business lines

                    Operating expenditure managed below prior year; one-off benefits also assisted

                    High quality growth leading to low bad debt outcomes

             $34.0     NPAT waterfall
             $33.0                                                                                                       $0.24
$ Millions

                                                                                                          $1.27
             $32.0                                       $1.38                                                                           $1.37
                                          $2.70
             $31.0                                                                         $1.78
                                                                         $1.37
             $30.0

             $29.0

             $28.0                                                                                                                                      $31.5
                                                                                   4.6% growth
                         $30.1
             $27.0

             $26.0

             $25.0
                     FY17 Net profit   Net interest   Other income     Banking non     Wealth income    Operating     Net bad and     Tax expense   FY18 Net profit
                        after tax       income                       interest income                   expenditure   doubtful debts                    after tax

                                                                                                              FY18 FULL YEAR INVESTOR PRESENTATION | 10
STRONG 2H LENDING GROWTH
      Loan book grew +2x system during 2HFY18                                      Home loan book – applications and settlements
                                                                                 $2.0                                                                        1.79
                                                                                                           1.68
      Margin management remains key focus                                       $1.8

                                                                     $ Billion
                                                                                 $1.6   1.42
                                                                                 $1.4                             1.19                                              1.11
      Emphasis on maintaining quality lending                                   $1.2
                                                                                 $1.0          0.88                         0.79
                                                                                                                                             1.00

       growth amidst vigorous competition                                        $0.8
                                                                                                                                   0.46
                                                                                                                                                    0.65
                                                                                 $0.6
                                                                                 $0.4
      Growth targeted to Australian eastern seaboard;                           $0.2
                                                                                 $0.0
       focus on lower LVR loans with high asset quality                                  FY16               FY17             1H18               2H18             FY18
                                                                                                               Applications        Settlements

                                                                                    Geographic home loan book spread
                    Total book – composition ($m)

          $3,853       +11%        $4,269       +7%         $4,550
100%
                                    $63                      $55                                                              NT
            $71
98%
                                                                                                                                                    QLD
                                    $63                      $72                                                             0.1%
            $50
                                                             $64                                          WA                                        14.1%
96%         $68                     $66
                                                                                                                               SA
                                                                                                         1.7%                 0.9%
94%
                                                                                                                                                     NSW
                                                                                                                                                     21.4%
92%
           $3,663                  $4,076                   $4,358
90%                                                                                                                                       VIC
                                                                                                                                                                 TAS
            FY16                    FY17                     FY18
         Housing Loans                     Personal Loans                                                                            15.6%
                                                                                                                                                                 45.5%
         Business / Agri / Commercial      Overdrafts                                                 Lower concentration                 Higher concentration

                                                                                                            FY18 FULL YEAR INVESTOR PRESENTATION | 11
CONTINUED HIGH CREDIT QUALITY
                                                                                                                                       30+ Days S & P Arrears Data
                Impairments remain at historic lows                                                                      (Majors and Regionals one month behind)
                                                                              3.00%

                30 and 90 day arrears well below peers and stable            2.50%

                                                                              2.00%
                AASB 9 to be implemented July 2018 with                      1.50%
                 expected increases in provisioning
                                                                              1.00%

                                                                              0.50%

                                                                              0.00%
                         Home loan book LVR profile

                                                                                                Sep-16

                                                                                                                                             Sep-17
                                                                                                          Dec-16

                                                                                                                                                          Dec-17
                                                                                                                      Mar-17

                                                                                                                                                                     Mar-18
                                                                                      Jun-16

                                                                                                                                  Jun-17

                                                                                                                                                                               Jun-18
                                                               Year on year
                  $5.0
                                                                 growth
                                         $4.36
                                                                                                              Group            SPIN Majors            SPIN Regionals
                  $4.5           $4.08
                                          0.20    >90% LVR
                         $3.66            0.26
                  $4.0
                                  0.31
                                                 85%-90% LVR      -17%                                                                 90+ Days S & P Arrears Data
                                  0.30
                                          0.39   80%-85% LVR                                                              (Majors and Regionals one month behind)
                  $3.5                                                        1.40%
                          0.39
                                  0.42                                        1.20%
    $ Billions

                          0.32
                  $3.0
                                                                              1.00%
                          0.45
                  $2.5                                                        0.80%
                                                                              0.60%
                  $2.0
                                                                              0.40%
                                          3.51
IMPROVED FUNDING MIX

                                                           Customer deposits ($m)

   Stable funding mix enhanced by growth                  +10%          $2,988              +9%
                                                                                                        $3,267
                                              $2,715
    in customer deposits
                                                                                                          1,717
                                                                              1,527
   Customer deposit growth supported by       1,397

    introduction of eSaver and Everyday
                                                                                                          1,550
    transaction accounts                       1,318                          1,461

   Programmatic RMBS issuance continues       FY16                           FY17                        FY18

    to be well supported by broad investor-       Customer at call deposits           Customer deposits at term
    base
                                                                     Funding mix
   Moody’s Baa1/P2 stable investment grade
    rating
                                              19.0%                       21.2%                           23.8%

                                              14.1%                       13.2%                           8.2%

                                              66.9%                       65.7%                           68.0%

                                               FY16                           FY17                        FY18

                                               Customer deposits         Wholesale funding             Securitisation

                                                                      FY18 FULL YEAR INVESTOR PRESENTATION | 13
WELL CAPITALISED TO SUPPORT GROWTH

    Robust capital position supported by organic capital generation

    Capital base underpinning growth and investment in digital

    Well positioned to meet regulatory changes

                                                                                             Total capital movements

                                                   1.74%        1.51%

             13.29%      0.13%          1.39%                                 1.46%         0.08%                     13.47%
                                                                                                          0.02%

             2.01%                                                                                                    1.96%
    Tier 2

    Tier 1   11.28%                                                                                                   11.51%

              FY17       Capital     Securitised   Profit   Dividends paid   Secured      Capitalised   Other asset    FY18
                       initiatives     assets                                mortgage     intangibles     growth
                                                                              lending

                                                                                        FY18 FULL YEAR INVESTOR PRESENTATION | 14
GROWTH IN WEALTH BUSINESS
                                                                     Funds under management and funds
                                                                                     under advice ($m)

   Wealth revenue growth +10.6% on pcp with
                                                                                 778                      809
    solid performance across all business lines            740

   Trustee revenue +25% on pcp benefiting from                                                          +6%
    sustained focus on will writing
                                                          1,008                 1,089                    1,153
   FUM growth of $64m +5.9%                              FY16                  FY17                     FY18
                                                             Funds under management            Funds under advice
   FUA growth of $31m +4.0%
                                                                                        Operating income ($m)
   Income fund strategy and investment focused
                                                                                                        $18.52
    on the growing income needs of retirees             $17.48                 $16.74
                                                                                                          3.45
                                                          3.07
   Investment planned to grow wealth business                                   3.19
                                                                                                          4.70
                                                          4.81                   3.76

                                                          9.59                   9.79                     10.36

                                                          FY16                  FY17                     FY18
                                                         Funds Management*        Trustees        Financial Planning

                                                  * including funds management mortgage fees

                                                                  FY18 FULL YEAR INVESTOR PRESENTATION | 15
MOMENTUM IN THE TASMANIAN ECONOMY

                                                                     Tasmanian economy experienced positive start to
                                                                      the year, with majority of indicators supporting
                                                                      economic growth.

                                                                     State Final Demand reached an all-time high of
                                                                      $8.2bn in the March 2018 quarter, underpinned
                                                                      by a year of consistent growth in household
                                                                      consumption.

                                                                     Tasmanian retail sales grew 4.6% in the year to
                                                                      June 2018 compared to the national average of
                                                                      3.1%, supported by tourism growth.

                                                                     300,400 international visitors came to Tasmania in
                                                                      the year to March 2018, a 20% increase on the
                                                                      previous year and the highest number of
                                                                      international visitors to Tasmania in a given year.

                                                                     Hobart leads the nation in housing price growth
                                                                      with average dwelling values increasing 11.5% in
                                                                      the year to 30 June 2018.

                                                                     Tasmanian exports grew significantly, increasing
                                                                      33% over the year to June 2018, above the
                                                                      national average of 8%.
 Economic data sourced from ABS, CoreLogic and Tourism Tasmania

                                                                              FY18 FULL YEAR INVESTOR PRESENTATION | 16
CONSISTENT RETURNS TO SHAREHOLDERS
                                                                                                                      Dividends (cps)
                     Consistent dividend returns to investors

                     100th percentile TSR compared to ASX300 Banks in
                      FY13, 14, 15 and 16. 90th percentile in FY17.

                     High yielding fully franked dividend

                                             TSR comparison
                 100.0%

                  90.0%

                  80.0%

                  70.0%
Percentile (%)

                  60.0%

                  50.0%
                                                                                                                    Dividend payout ratio

                  40.0%

                  30.0%

                  20.0%                                                                            84         84                    84
                                                                                                                                            83
                  10.0%
                                                                                                                          80
                   0.0%
                           (1 year)       (2 year)     (3 year)        (4 year)         (5 year)

                            FY17           FY16         FY15            FY14             FY13
                                                                                                   FY14      FY15         FY16     FY17     FY18
                           Percentile - ASX300 Banks   Percentile - ASX300 Financials

                                                                                                          FY18 FULL YEAR INVESTOR PRESENTATION | 17
STRATEGY &       Sector overview      Achievements
OUTLOOK          Strategic overview   Platform for
                                      continued growth
MELOS SULICICH                                   FY18 FULL YEAR INVESTOR PRESENTATION | 18
SECTOR OVERVIEW
                            System credit growth still slowing

                            Housing market cooling nationally
   $        Industry        Lending market continues to be highly competitive
            dynamics
                            Funding costs remain elevated

                            Royal Commission

                            Productivity Commission Review

                            Competitive landscape still unbalanced:
                              1.   Funding cost differentials
                              2.   Risk weighted asset and capital differentials
            Regulatory        3.   Macroprudential regulation skewing competition and
                                   profitability in the sector
             dynamics
                              4.   Lack of transparency in vertical integration of mortgage
                                   brokers
                              5.   Disproportionate impact of regulatory burden on smaller
                                   banks
                              6.   Non ADIs benefiting from macro prudential interventions

                                                     FY18 FULL YEAR INVESTOR PRESENTATION | 19
DELIVERING ON OUR STRATEGIC PRIORITIES

Our PURPOSE
To help people achieve their dreams                      Our GOALS are to be
Our MISSION                                              Simpler, more relevant, accessible for
                                                         our customers and easier to “use”
To make financial services simple and trustworthy

Our VISION                                                              Evermore digitally enabled so that
                                                                        we can attract the target
We want to make a genuine difference to our customers
                                                                        customers we are seeking
and communities every day

                                                         More deeply community connected
The WORLD is changing
The needs and expectations of customers are changing     Seen by our shareholders as being
and technology is opening opportunities to attract and   agile with a strong focus on
serve new customer segments across Australia             growth, margins and cost
                                                         management
At MyState, we know that our future success will be
founded on digital innovation and evolving the way
we think and operate so that we put customers at the
centre of everything we do

                                                                   FY18 FULL YEAR INVESTOR PRESENTATION | 20
BUILDING A DIGITAL, SCALABLE BUSINESS *

* All statistics compare FY18 with FY17 unless otherwise stated

                                                                  FY18 FULL YEAR INVESTOR PRESENTATION | 21
PLATFORM FOR CONTINUED GROWTH
What we’ve achieved

      Deposit and loan                  Costs                         Digital                        Robust capital
       book growth                                                transformation                       position

 • Continued growth above     • Targeted branch closures   • Increase in customer NPS to +27    • Moody’s Baa1/P2
   system                     • Productivity benefits      • Introduced eSaver and Everyday       stable investment
                                accruing                     transaction accounts and Basic       rating
                                                             Home Loan

What we’re working on

  Customer enhancements                 Digital                      Marketing                         Wealth

 • MyExcellence program      • Faster customer onboarding • Build out marketing analytics      • Investment in Wealth,
 • Continued focus on        • Digital mortgage origination   and CRM capabilities               with a focus on systems
   customer improvement                                     • Brand building + refresh           and capability
                             • Focus on digital deposit
   initiatives including       acquisition
   continuous cycle of
   platform improvements
                            We are modernising our business and putting customers
                                      at the centre of everything we do

                                                                             FY18 FULL YEAR INVESTOR PRESENTATION | 22
GLOSSARY

           1H: First half of financial year                   IO: Interest only
           2H: Second half of financial year                  IRB: Internal ratings-based
           ADI: Authorised deposit-taking institution         Jaws: relationship between income and expense growth
           APRA: Australian Prudential Regulation Authority   LVR: Loan to valuation ratio
           Avg: Average                                       MYS: MyState Ltd
           ASX: Australian Securities Exchange                MSB: MyState Bank Limited
           BBSW: Bank Bill Swap Rate                          NII: Net Interest Income
           BDD: Bad & Doubtful Debt Expense                   NIM: Net Interest Margin
           bps: basis points                                  NPAT: Net Profit after Tax
           CAGR: Compounded annual growth rate                NPBT: Net Profit before Tax
           CET1: Common Equity Tier 1                         RBA: Reserve Bank of Australia
           cps: Cents per share                               RMBS: Residential mortgage-backed security
           CTI: Cost-to-income ratio                          ROE: Return on equity
           DRP: Dividend reinvestment plan                    SPIN: Standard and Poor’s Performance Index
           EPS: Earnings per share                            S&P: Standard and Poor’s
           FY: Financial year                                 TD: Term deposit
           HY: Half year

                                                                                           FY18 FULL YEAR INVESTOR PRESENTATION | 23
DISCLAIMER

Summary Information                                                                                 Future Performance
This Presentation contains summary information about MyState and its activities current as at       This Presentation may contain “forward-looking” statements including statements
the date of this Presentation. The information is subject to change without notice and does         regarding MyState's intent, belief or current expectations with respect to their business
not purport to be complete or comprehensive. It does not purport to summarise all                   operations, market conditions, results of operations, financial conditions, and risk
information that an investor should consider when making an investment decision. It should          management practices. Forward-looking statements can generally be identified by the
be read in conjunction with MyState's other periodic and continuous disclosure                      use of forward-looking words such as “anticipated”, “expected”, "aim", "predict",
announcements lodged with the Australian Securities Exchange, which are available at                “projections”, “guidance”, “forecast”, “estimates”, “could”, “may”, “target”, “consider”,
www.asx.com.au.                                                                                     “will” and other similar expressions. Indications of, and guidance on, future earnings,
                                                                                                    financial performance, and financial position are also forward looking statements .
Not Financial Product Advice                                                                        Forward looking statements, opinions and estimates are based on assumptions and
This Presentation is for information purposes only and is not financial product advice or a         contingencies which are subject to certain risks, uncertainties and change without
recommendation to acquire shares. It has been prepared without taking into account any              notice, as are statements about market and industry trends, which are based on
investor’s objectives, financial position, situation or needs. Therefore, before making an          interpretations of current market conditions. Forward-looking statements including
investment decision, investors should consider the appropriateness of the information in this       projections, indications or guidance on future earnings or financial position and
Presentation and have regard to their own objectives, financial situation and needs. Investors      estimates are provided as a general guide only and should not be relied upon as an
should seek such financial, legal or tax advice as they deem necessary or consider                  indication or guarantee of future performance. Should one or more of the risks or
appropriate. MyState is not licensed to provide financial product advice in relation to the offer   uncertainties materialise, or should underlying assumptions prove incorrect, there can
of shares. Cooling off rights do not apply to the acquisition of the shares.                        be no assurance that actual outcomes will not differ materially from these statements.
                                                                                                    To the fullest extent permitted by law, MyState and its directors, officers, employees,
Financial Information                                                                               advisers, agents and intermediaries disclaim any obligation or undertaking to release
All information in this Presentation is in Australian dollars ($) unless stated otherwise. A        any updates or revisions to the information to reflect any change in expectations or
number of figures, amounts, percentages, estimates, calculations of value and fractions in this     assumptions.
presentation are subject to the effect of rounding. Accordingly, the actual calculation of these
figures may differ from the figures set out in this presentation and totals may vary slightly       Investment Risk
due to rounding. All references to financial years (FY) appearing in this Presentation are to the   An investment in securities in MyState is subject to investment and other known and
financial years ended on 30 June of the indicated year.                                             unknown risks, some of which are beyond the control of MyState, including possible
                                                                                                    loss of income or principal invested. MyState does not guarantee any particular rate of
Past Performance                                                                                    return or the performance of MyState. Investors should have regard to the risk factors
Past performance information, including past share price information, given in this                 outlined in this Presentation when making their investment decision.
Presentation is given for illustrative purposes only and should not be relied upon as (and is
not) an indication of future performance.                                                           Not an Offer
                                                                                                    This Presentation is not an offer or an invitation to acquire shares in MyState or any
                                                                                                    other financial products and is not a prospectus, product disclosure statement or other
                                                                                                    offering document under Australian law or any other law. It is for information purposes
                                                                                                    only.

                                                                                                                           FY18 FULL YEAR INVESTOR PRESENTATION | 24
You can also read