New Zealand Seasonal Fire Danger Outlook 2017/18
←
→
Page content transcription
If your browser does not render page correctly, please read the page content below
New Zealand Seasonal Fire Danger Outlook 2017/18
ISSUE: North Island, February 2018
Current fire danger situation & outlook:                                  the tropical Pacific suggesting this event may have already peaked and
In January, New Zealand was dominated by high pressure over the           be in the early stages of decline. International climate models suggest a
country with intermittent intense lows. Humid northeast winds also        continued decay of La Niña conditions over the next three months, and
prevailed across New Zealand during the month. In general, we             a return to neutral conditions in early autumn (April 2018).
experienced warm humid weather during January, with many locations
experiencing record-breaking heat. Heavy rain and gales were also         The outlook for the next three-month period is for higher pressures than
experienced across most of the North Island.                              normal in the east and south of the country, but lower pressure than
                                                                          normal over the Tasman Sea, extending over the North Island. Warmer
On average, Moderate to High fire potential currently exists in the       temperatures, occasional significant rainfalls and north-easterly winds
Hauraki, Great Barrier Island, Wairarapa and Hastings areas. Low          are expected.
fire danger and fire climate severity exists elsewhere across the north
(Figures 1 & 5). FWI System codes and indices, especially the BUI, are    February is forecast for above average temperatures, with temperatures
indicating elevated fuel dryness for Hauraki/Matamata, Hastings and       expected to climb in the second half of the month. However, there are
Wairarapa. Elevated DCs also exist in Auckland, Waikato, Gisborne,        some week-to-week changes that will offer some relief from the non-
Hawkes Bay, Wairarapa, and parts of Taranaki, Manawatu/Wanganui           stop heat. Expect intermittent rainfalls and long dry spells across the
and Wellington. Elsewhere, fire potential is generally Low to Moderate    North Island.
on average.
                                                                          With predicted warm temperatures combining with underlying dryness,
Locations that are showing extremely dry soils are along the east         fire dangers and fire climate severity for February are expected to climb
coast and in the lower north (Figure 3). This is also reflected in the    for locations along the east coast (Figure 1 & 5). The fire season years
soil moisture anomaly map (Figure 4), where soils are much drier than     of 2016/17, 2013/14, 2012/13 & 2008/09 are potentially good indicators
normal along the east coast (especially for Gisborne, Palmerston North    for what to expect this coming fire season (Figure 9).
and Masterton), Whakatane and South Taranaki. The Horowhenua and
Kapiti Coast areas are also showing signs of meteorological drought       Based on the current situation, the February outlook and historical
(based on the NZDI reported by NIWA). Significant rainfalls recorded      La Niña years, regions to watch for elevated fire activity in February
over northern and central New Zealand have resulted in wetter than        are Northland, Waikato, along the east coast and lower North Island
normal soils for this time of the year (Figure 4).                        (especially parts of Gisborne, Hawkes Bay, Wairarapa, and Wanganui/
                                                                          Manawatu). However, as with this time last year, any major rain events
The ENSO Outlook remains for a weak La Niña, with observations in         in the next few weeks will provide some welcome relief and reduce the
                                                                          fire dangers and severities.

                January 2018                                    February 2017                                 February 2014

Figure 1. Monthly average Severity Rating for: current (left), last year (middle), and the 2013/14 Neutral to weak La Nina year (right).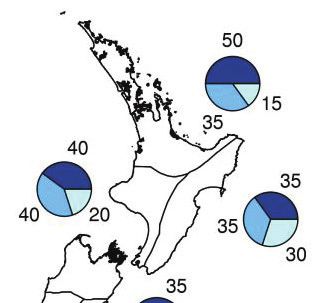
EXPECTED CLIMATE OUTLOOK:                                            Further ahead: February – April 2018
The current El Niño-Southern Oscillation (ENSO) state                New Zealand’s climate over the next three-month period
remains a weak La Niña, however recent observations in               is expected to be dominated by the very warm ocean
the tropical Pacific suggest this event may have peaked              waters present around the country. Higher pressures
and be in the early stages of decline. International                 than normal are forecast in the east and south, while
climate models suggest a continued decay of La Niña                  lower pressures than normal are forecast over the
conditions over the next three months and a return to                Tasman Sea, extending over the North Island. Warmer
neutral conditions in early autumn (April 2018).                     temperatures, occasional significant rainfall and north-
                                                                     easterly winds are expected because of the combination
Seas around New Zealand, in the Tasman Sea and in                    of the pressure pattern with the marine heat wave.
the Southwest Pacific Ocean, remain extremely warm,
following on from a marine heat-wave event in the last
quarter of 2017. Sea surface temperatures (SSTs) are
                                                                     For the next three months (Jan – Mar 2018):
                                                                     Temperatures are forecast to be above average for all
currently in excess of 2 degrees above normal around
                                                                     regions. Rainfall totals are forecast to be above normal
most of the coastline, with areas of 3 degrees above
                                                                     in the North Island. Soil moisture levels and river flows
the norm to the west of the country. In contrast, below
                                                                     are forecast to be above normal in the north of the North
average Pacific Ocean temperatures continue along the
                                                                     Island, and about equally likely to be normal or above
equator, associated with the weak La Niña. Significantly
                                                                     normal for all remaining regions.
warmer than average SSTs are likely to persist for at
least part of the next 3 months (February – April 2018),
although the anomalies are expected to ease off slightly             Regional breakdown (Figure 2):
                                                                     Temperatures are most likely to be:
over the same period.                                                • above average (70% chance) for Northland,
                                                                        Auckland, Waikato, Bay of Plenty, Central North
The southern hemisphere Tropical Cyclone risk for New                   Island, Taranaki, Whanganui, Manawatu &
Zealand remains normal or above normal.                                 Wellington;
                                                                     • above average (60% chance) for Gisborne, Hawkes
                                                                        Bay & Wairarapa.
Soil moisture (Figure 3 & 4)
Across the North Island, soil moisture levels generally              Rainfall is most likely to be:
increased in northern areas while decreasing in eastern              • above normal (50% chance) for Northland, Auckland,
and southern regions. Dry soils are found along the east                Waikato, & Bay of Plenty;
coast and in the lower North Island (Figure 3). The Far              • above normal (45% chance) for the Central North
North and Kaipara districts, and parts of Waikato, are                  Island, Taranaki, Whanganui, Manawatu, Wellington,
also showing signs of drying. Northern and central North                Gisborne, Hawkes Bay & Wairarapa.
Island are much wetter for this time of the year than
normal (Figure 4).                                                   Soil moistures are most likely to be:
                                                                     • above normal (50% chance) for Northland, Auckland,
                                                                         Waikato, & Bay of Plenty;
This month: February 2018                                            • above normal (35 to 40% chance) or near normal
                                                                         (35 to 40% chance) for the Central North Island,
February rainfall totals (including the ex-Cyclone Fehi                  Taranaki, Whanganui, Manawatu, Wellington;
event) are predicted to be normal to above normal right              • above normal (35% chance) or near normal (35%
across New Zealand. The tropics hold the key to New                      chance) for Gisborne, Hawkes Bay & Wairarapa.
Zealand rainfall for February 2018, but we can expect
intermittent rainfalls and long dry spells across the North
Island.
                                                                     Last month: January 2018
February monthly temperatures are forecast to be above               Looking back, high pressure frequented the east of
average. However, there will be week-to-week changes                 the country and over the south of the South Island.
that will offer some relief from the non-stop heat. Expect           Intermittent intense lows also developed over the north
temperatures to climb again in the second half of the                Tasman Sea, which produced heavy rain for northern
month.                                                               regions of both Islands. January rainfall totals were
                                                                     well above normal across the North Island (excluding
                                                                     Gisborne and Hawkes Bay).
                                                                     Humid northeast winds prevailed across New Zealand

 Figure 2. Outlook for Feb - Apr 2018: air temperature (left), rainfall (middle), available soil moisture (right). Source: NIWA.

page: 2
during the month, and the combination of these winds           are regional and seasonal exceptions.
and the pre-existing marine heat-wave, produced record-
breaking January heat. Temperatures were well above            La Niña typically brings more storms, clouds, humidity
average (>1.20°C of average) for the entire country, and       and rain to the north and east of New Zealand. During
locations in every region recorded either their record or      a La Niña summer, anticyclones are more frequent,
                                                               bringing dry weather. With a weak La Niña expected, it
near-record January temperature.                               means our ‘local’ climate players (the Southern Ocean
                                                               southerlies and Tasman Sea lows) will continue to take
                                                               turns ruling our weather. This is a good reminder that
Grass growth:                                                  local climate patterns (blocking Highs over or near New
                                                               Zealand, Lows over the Tasman Sea or to the north of
Depending on where you are in the country, grass
curing could be patchy over a series of paddocks/area,         the country, and the southern ocean storms) generally
especially during the 40-80% curing period. Or if you          ‘trump’ climate patterns such as El Niño and La Niña.
are experiencing summer droughts, curing will become
more continuous in the dry phase of 70 – 100% curing.
Above 80% curing, fuel moisture content begins to be
significantly influenced by the environmental factors
(humidity, temperature and wind).

For areas experiencing high curing values, now is the
time to be prepared. Wildfires burning under these high
grass curing conditions can spread very quickly, produce
large to very tall flame heights (2 m+), be very intense
and much more difficult to suppress. Some areas would
also have experienced abundant grass growth over the
last month, increasing the fuel loading.

For some parts of the country still undergoing bouts of
rainfall, it’s not uncommon to see green grass growth
under the dry vegetation. This can help reduce or halt
a fire’s spread (depending on the amount). However,
fires will still race along the tops in places experiencing
a dense/continuous top cover of dry grass. Heavy and
prolonged rains can delay the maturing process until
the onset of hot dry weather conditions, when curing will
proceed rapidly. Rainfall before 60% curing will prolong
grass life and slow the curing process, while rainfall after
60% will not delay the curing of mature grass.

                                                                 Figure 3. Soil moisture deficits as of 06/02/2018.
                                                                 Source: NIWA.
The finer details:
As summer progresses, many parts of the country that             Note: Soil moisture deficit means the amount of water needed to bring the
are experiencing lack of rainfall are observing landscapes       soil moisture content back to field capacity, which is the maximum amount
changing from a vibrant green to yellow or straw colour.         of water the soil can hold.
Cured grass at this stage heightens the potential for a fire
to ignite and spread in these fuels. The risk of grass fires
starting and spreading in these areas is amplified further
by high temperatures, low humidity and strong winds.

Grassland curing will affect fire behaviour in many ways:
it increases the amount of dead material present and
affects fuel moisture content. The result is an increased
chance of fire ignition, rates of spread and fire intensity.

The moisture content of fine grass fuels (as well as pine
litter and other fine fuels) also dramatically affects the
ignition potential and ability of a wildfire to spread. High
amounts of moisture increase the heat absorption and
thermal conductivity of fuel, so that more heat is required
for the fuel to reach its ignition temperature. As grasses
cure and become drier, less heat is required to ignite and
sustain a fire.

What would La Niña mean for New Zealand?
La Niña tends to warm the ocean surrounding New
Zealand, which encourages frequent lows and sub-
tropical storms for the north, occasionally stretching down      Figure 4. Soil moisture anomaly as of 06/02/2018.
as far as Canterbury. During a La Niña, north-easterly           Source: NIWA.
and easterly winds are more frequent, resulting in the
risk of heavy rain and flooding. New Zealand is typically        Note: Soil moisture anomaly means the difference between the
warmer than average during a La Niña, although there             historical normal soil moisture deficit (or surplus) for a given time of year
                                                                 and actual soil moisture deficits.
                                                                                                                                     page: 3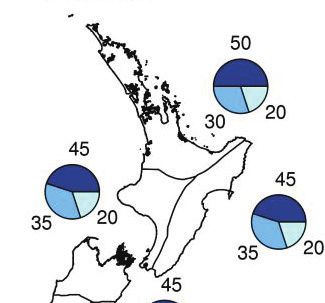
Background info
    The intention of these monthly outlooks is to provide
    a heads up on current and potential fire danger for             It should be used as a prompt for local and regional
    the North and South Islands. This is not a detailed             discussions/debates on fire potential, and where things
    fire seasonal outlook for specific localities, nor does         are at, where it is heading, and to drive awareness
    it summarise fire potential (which depends on fuel              about what this might mean in your patch and for your
    conditions (i.e. grass curing), risks of ignitions, recent      neighbours. Now is the chance to carry out your pre-
    fire history and fire management resources available in         planning if you haven’t done so already.
    an area as well as weather and climate).

Fine Fuel Moisture Code (FFMC)             Duff Moisture Code (DMC) A rating             Drought Code (DC) A rating of the
                                           of the average moisture content               average moisture content of deep,
An indicator of the relevant ease
                                           of loosely compacted organic soil             compact, organic soil layers, and a
of ignition and flammability of fine
                                           layers (duff/humus) of moderate               useful indicator of seasonal drought
fuels.
                                           depth, and medium-sized woody                 effects on forest fuels and amount of
                                           material                                      smouldering in deep duff layers and
     0 - 74      Difficult                                                               large logs.
     75 - 84     Moderately easy               0 - 10      Little mopup needs               0 - 100      Little mopup needs
     85 - 88     Easy                          11 - 20     Moderate                         101 - 175    Moderate
     89 - 91     Very easy                     21 - 30     Difficult                        176 - 250    Difficult
     92 +        Extreme easy                  31 - 40     Difficult & extended             251 - 300    Difficult & extended
                                               41 +        Difficult & extensive            301 +        Difficult & extensive

Buildup Index (BUI)                       Initial Spread Index (ISI) Combines the        Fire Weather Index (FWI)
Combines the DMC and DC, and              effect of wind speed and the FFMC,             Combines the ISI and BUI to indicate
represents the total amount of            providing a numerical rating of                the potential head fire intensity of a
fuel available for combustion.            potential fire spread rate.                    spreading fire (on level terrain).
    0 - 15     Easy control                   0-3          Slow rate of spread
                                                                                            0-5         Low fire intensity
    16 - 30    Not difficult                  4-7          Moderate fast
                                                                                           6 - 12       Moderate
    31 - 45    Difficult                      8 - 12       Fast
                                                                                           13 - 20      High
    46 - 59    Very difficult                 13 - 15      Very fast
                                                                                           21 - 29      Very High
    60 +       Extremely difficult            16 +         Extremely fast
                                                                                            30 +        Extreme

Daily Severity Rating (DSR) A numerical rating of the daily fire weather
severity at a particular station, based on the FWI. It indicates the
increasing amount of work and difficulty of controlling a fire as fire
intensity increases. The DSR can be averaged over any period to provide 0 - 1                 Low fire behaviour potential
monthly or seasonal severity ratings.
                                                                                   1-3        Moderate fire potential

Monthly Severity Rating (MSR) is the average of the DSR values over the      3-7              High to very high fire potential
month. DSR and MSR captures the effects of both wind and fuel dryness 7 +                     Extreme fire behaviour potential
on potential fire intensity, and therefore control difficulty and the amount
of work required to suppress a fire. It allows for comparison of the
severity of fire weather from one year to another.

Acknowledgements:
Fire Danger interpretation was from information gathered from the       Front Cover Image:
Average Monthly Maps for: Severity Rating, FWI, BUI, ISI, DC,           2013 Prescribed burn, Waihopai Valley, John Foley Fire
DMC, FFMC. These maps were obtained from the National Rural             and Emergency New Zealand).
Fire Authority Fire Weather System powered by Eco Connect.
                                                                        If you are keen to submit a weather and fire related photo
Information on the Expected Climate Outlook was gathered from:          that will appear on the front page, please email:
•    MetService, Rural Monthly outlooks:                                •    a high resolution image(s)
     www.metservice.com/rural/monthly-outlook                           •   with details on the location and the photographer’s
•      NIWA, Seasonal Climate outlook:                                      name and organisation.
       www.niwa.co.nz/climate/sco                                       •   to: Veronica.Clifford@scionresearch.com
•      Australian Bureau of Meteorology Climate outlooks
       http://www.bom.gov.au/climate/ahead/?ref=ftr

page: 4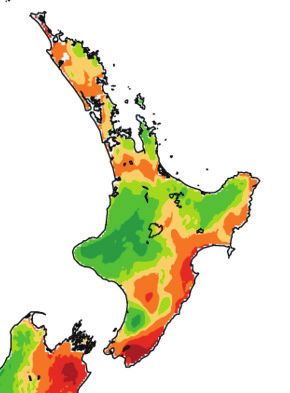
January 2018                               February 2017                                February 2014

 FWI values

               January 2018                              February 2017                                February 2014

 BUI values

              January 2018                               February 2017                                February 2014

 ISI values

Figure 5. Current Monthly Average for the: Fire   Figure 6. Average Monthly values of: Fire Weather Index (top), Buildup Index
Weather Index (top), Buildup Index (middle) and   (middle) and Initial Spread Index (below); for the previous year (left) and during the
Initial Spread Index (below).                     2013/14 Neutral year followed by a weak La Niña year (right).

                                                                                                                              page: 5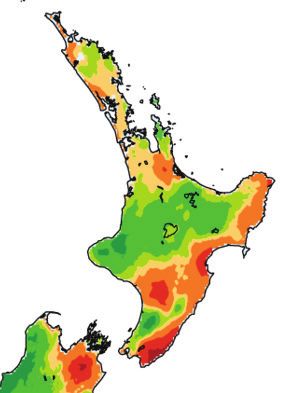
January 2018                             February 2017                             February 2014

 DC values

               January 2018                              February 2017                            February 2014

 DMC values

               January 2018                             February 2017                             February 2014

 FFMC values

Figure 7. Current monthly average for the:        Average monthly values of: Drought Code (top), Duff Moisture Code (middle) and
Drought Code (top), Duff Moisture Code (middle)   Fine Fuel Moisture Code (below); for the previous year and during the 2011/12
and the Fine Fuel Moisture Code (below).          weak La Niña year.

 page: 6
September   October   November   December   January   February   March         April                      May

          2008 - 2009
          2013 - 2014
          2016 - 2017
                                                                                                 Figure 9. New Zealand Fire Season
                                                                                                 Severity (monthly)
                                                                                                 The years 2008/09 and 2013/14 were Neutral
                                                                                                 years followed by weak La Niña phase, and
                                                                                                 are ideal comparisons for what New Zealand
                                                                                                 might experience over the next few months.
                                                                                                 DSR values of less than one equate to low fire
                                                                                                 behaviour potential, 1-3 moderate fire potential,

          2017 - 2018
                                                                                                 3-7 high to very high fire potential, and above 7
                                                                                                 extreme fire behaviour potential.

page: 7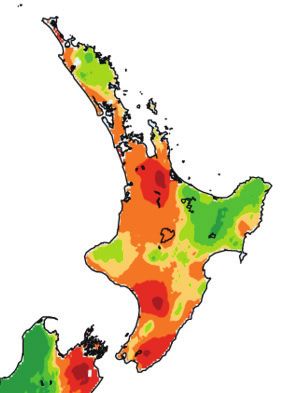
Regional Summaries

    Tracking of trends in BUI, DC and CDSR:
                                                                        Link: https://www.dropbox.com/sh/1qy0b1rauv0t6g4/
    Comparisons of fire dangers for individual indicator                AAC4ziYCv9FUP6a5o7R-HHjna?dl=0
    stations for different regions are shown overleaf due to
    increasing fire activity and an increasing likelihood for fire      The more detailed regional outlooks highlight where
    danger and severity across the country. This is in tabular          Buildup Index (BUI), Drought Code (DC) and Cumulative
    format.                                                             Daily Severity Rating (CDSR) values sit in comparison
                                                                        with previous fire seasons. The graphs display:
    Trends for Drought Code (DC), Buildup Index (BUI)
                                                                        • Bold red line is the current fire season
    and Cumulative Daily Severity Rating (CDSR) are
    provided for all stations in a PDF format. For those who            • Bold black line is the long-term average
    are interested in tracking fire season trends for all your          • Light grey shaded areas indicate the range based on
    weather stations on a more frequent basis (as opposed to                historical max and mins
    the monthly analysis done here), you can download the               • We’ve also colour coded the 2013/14 Neutral year
    summary PDF graphs and Excel sheets, and R scripts (to                  followed by a weak La Niña season blue.
    make the pdfs) using the link on the right: (or click here)

Northern North Island:
Northland
Soil moisture:
•      Soils across the region are showing signs of dryness in the Far North and coastal Kaipara (Figure 3).
•      The soil moisture anomaly map is indicating that Northland has been wetter than normal for this time of the year, but
       about normal for coastal Kaipara (Figure 4).

Fire weather codes and indices:
•      Stations to watch are: Pouto

•      Current BUIs across the region range from 4 to 15, indicating that the difficulty of control will generally not be difficult.
       The exception is Pouto (47), which indicates control will be difficult.
•      BUIs across the region are below average for this time of the year, except Pouto, which is above average.
•      Maximum BUIs typically peak during February, and can range between 110 and 200.

•      Current DC values are generally 90 to 150, except Dargaville (205), Mangakahia (259) and Pouto (433). This
       indicates that there is a moderate requirement for mop up needs in most locations, and up to difficult and extended
       mop up requirements in heavy fuels for locations with elevated values.
•      DCs are generally below historical averages across the region, except Pouto which is well above the average.
•      Maximum DC values typically peak during February or March.

•      CDSR values across the region are mixed, with most stations below but some at or above their historical averages.
•      Current fire severity and danger for this region are, on average, Low to Moderate (Figure 1 & 5).
•      With forecast warm temperatures and above normal rainfall, fire dangers and fire climate severity could increase over
       summer, especially if the soils continue to dry further. But with additional major rain events, this would keep the fire
       danger Low.

          Station Name                     BUI trends                           DC trends                       CDSR trends
                                vs. average        vs. 2011/12        vs. average      vs. 2011/12      vs. average      vs. 2011/12

    Far North
    Aupouri Peninsula raws         below                below           below               below       well above       well above
    Waitangi Forest raws           below                below           below               below         below            below
    Kaikohe aws                    below                below           below          well below         below            below
    Kaikohe raws                   below                below           below               below         below            below
    Hokianga raws                  below                below           below               below        on trend       slightly below
    Whangarei / Kaipara
    Opouteke raws                  below                below           below               below      slightly above   slightly below
    Mangakahia raws                below                below          on trend       slightly below      below            below
    Whangarei raws                 below                below           below               below       well below       well below
    Whangarei Aero aws             below                below           below               below         below            below
    Dargaville raws                below                below        slightly below         below        on trend       slightly below
    Pouto raws                     above            on trend          well above       well above      slightly above   slightly below
     page: 8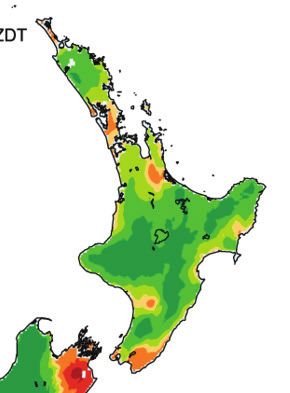
Auckland
Soil moisture:
•      Soil moisture levels across the Auckland region are generally between 50% or nearing field capacity (Figure 3).
•      The soil moisture anomaly map shows that the soils are wetter than normal for this time of the year (Figure 4).

Fire weather codes and indices:
•      Stations to watch are: None

•      BUIs across the region range from 2 to 10, indicating that the difficulty of control should be easy.
•      BUIs across the region are below average for this time of the year, and during the similar 2013/14 weak La Niña fire
       season.
•      Maximum BUIs typically peak during February, and can range between 100 and 180.

•      Current DCs range between 35 and 125, except Kaipara (175), indicating mop up needs in heavy fuels are generally
       little to moderate.
•      DCs across the region are below, to well below, average for this time of the year.
•      DC values typically peak around late February, where maximum values can be expected to range between 500 and
       800.

•      CDSR values across the region are mixed, with stations below, at, or above their historical averages.
•      Current fire severity and danger for this region are, on average, Low to Moderate, but High for Great Barrier Island
       (Figure 1 & 5).
•      With forecast warm temperatures and above normal rainfall, expect fire dangers and fire climate severity to increase
       over summer. But with further major rain events, this would keep the fire danger Low.

          Station Name                    BUI trends                      DC trends                     CDSR trends
                                vs. average       vs. 2011/12   vs. average      vs. 2011/12    vs. average      vs. 2011/12

    Great Barrier Island
    Great Barrier Island raws     below                below      below               below      on trend           below
    Northern
    Mahurangi Forest raws       well below       well below     well below       well below       below            below
    Kaipara raws                  below                below      below               below    slightly below     on trend
    Woodhill raws               well below       well below       below               below      on trend       slightly below
    Southern
    Clevedon Coast raws           below                below      below               below       above            above
    Cornwallis Depot raws       well below             below    well below       well below    slightly above      above
    Waharau raws                  below                below    well below       well below    slightly above   slightly above
    Patumahoe raws                below                below      below               below       below           on trend

                                                                                                                      page: 9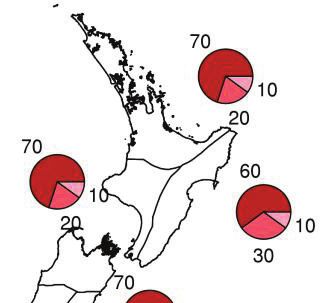
Waikato
Soil moisture:
•      Soil moisture levels are about 50% storage capacity in the north and showing signs of drying in the south of the
       region (Figure 3).
•      This is reflected in the soil moisture anomaly map, which shows wetter than normal soils for Thames-Coromandel,
       Hauraki and Matamata districts (Figure 4). Slightly drier than normal conditions exist for the Waitomo, Otorohanga
       and Waipa districts.

Fire weather codes and indices:
•      Stations to watch are: None

•      Currently BUIs across the region range from 4 to 22, indicating fire control will generally not be difficult.
•      BUI values are below the averages for this time of the year.
•      Maximum BUI values usually peak around late February, at around 100 to 160.

•      Current DCs range between 20 to 170, except Waeranga (190). This indicates little to moderate mop-up needs in
       heavy fuels in most areas, extending to more difficult needs in Waeranga.
•      DCs are below average levels, and those of the 2013/14 fire season, for this time of the year.
•      Maximum DC values typically peak during March, and can range between 450 and 800.

•      CDSR values across the region are generally below, or at, the historical average.
•      Current fire severity and danger for this region are, on average, Low to Moderate (Figure 1 & 5).
•      With forecast warm temperatures and above normal rainfall, fire dangers and fire climate severity could increase
       as summer progresses, especially if the underlying dry conditions continue to dry further. But with further major rain
       events, this would keep the fire danger Low.

          Station Name                     BUI trends                        DC trends                      CDSR trends
                                vs. average        vs. 2011/12    vs. average       vs. 2011/12     vs. average         vs. 2011/12

    Thames Valley
    Waikawau Bay raws              below           well below      well below       well below         below              below
    Whangamata raws                below                below        below               below         below              below
    Paeroa raws                    below                below        below               below     slightly above        on trend
    Paeroa aws                     below                below      well below       well below        on trend         slightly below
    Waeranga raws               new station        new station    new station       new station     new station         new station
    Waihi Gold raws                below                below        below               below         below              below
    Waihi raws                     below                below      well below       well below         below              below
    Waikato / Waitomo
    Hamilton raws                  below                below    slightly below          below        on trend           on trend
    Hamilton Aero Aws              below                below    slightly below          below        on trend           on trend
    Taharoa raws                   below                below        below               below       well below         well below
    Port Taharoa aws               below                below        below               below        on trend            below
    Athol raws                     below                below    slightly below          below         below              below
    Waitomo raws                   below                below        below          well below        on trend           on trend
    Piopio raws                 new station        new station    new station       new station     new station         new station

     page: 10
Central & Eastern North Island:
Bay of Plenty
Soil moisture:
• Soil moistures in the west of the region are leaning towards field capacity, whereas in the east (Whakatane and
Opotiki) they are showing signs of dryness (Figure 3).
• The soil moisture anomaly map reflects this, and shows soils are much wetter than normal for this time of the year in
the west, and drier than normal in the east (Figure 4).
Fire weather codes and indices:
• Stations to watch are: Waimana
• BUIs across the region generally range from 8 to 22. This indicates that the difficulty of control will generally be not
difficult. The exception is Waimana (142), where control would be extremely difficult.
• BUI values are below average for this time of the year, and the levels recorded during the 2013/14 weak La Niña fire
season, except Waimana which is above average levels.
• BUIs typically peak in late February, and maximum values can be expected to range between 120 and 160.
• Current DCs range between 30 and 160. These values indicate a low to moderate risk of extended mop-up needs in
heavy fuels. The exceptions to this are Opotiki (208), Waihau Bay (299) & Waimana (602), where there is a risk of
difficult to extensive mop-up needs.
• DCs are generally below the averages for this time of the year, and also the levels recorded during the 2013/14 fire
season, except Waihau Bay, Opotiki and Waimana, which are above average.
• Values typically peak during February or late March, and can reach maximum values between 550 and 700.
• CDSR values are below the historical average, and the levels seen in the 2013/14 fire season.
• Current fire severity and danger for this region are, on average, Low to Moderate (Figure 1 & 5).
• With forecast warm temperatures and above normal rainfall, fire dangers and fire climate severity could increase
as summer progresses, especially if the underlying dry conditions continue to dry further. But with further major rain
events, this would keep the fire danger Low.
Station Name BUI trends DC trends CDSR trends
vs. average vs. 2011/12 vs. average vs. 2011/12 vs. average vs. 2011/12
Coastal
Waihi Beach raws new station new station new station new station new station new station
Waihau Bay raws below on trend slightly above above below on trend
Tauranga Aero SYNOP below below below below below below
Tauranga raws below below below below below below
Minden raws new station new station new station new station new station new station
Te Puke ews below below below below below slightly below
Whakatane raws below below below below below below
Whakatane Aero aws below below below below below below
TECT All Terrain Park raws new station new station new station new station new station new station
Rotoehu raws below below below below below on trend
Opotiki raws below below slightly above slightly above on trend below
Rotorua / Kawerau / Whakatane
Kawerau raws below below below below well below well below
Rotorua raws below below below below slightly below on trend
Rotorua Aero aws below below below below below slightly below
Waimana raws new station new station new station new station new station new station
Galatea raws below below below below below below
page: 11Central North Island
Soil moisture:
• Soil moistures in the west of the region are at 50% storage and leaning towards field capacity, whereas soils in the
east are indicating signs of dryness (Figure 3).
• The soil moisture anomaly map reflects this, and shows soils are much wetter than normal for this time of the year in
the west, and drier than normal in the east (Figure 4).
Fire weather codes and indices:
• Stations to watch are: None
• BUIs across the region now range from 9 to 26. This indicates that heavy and medium fuels are not readily available
for combustion and the difficulty of control will generally be easy to not difficult.
• BUI values are generally below, to slightly below, the averages for this time of the year and the levels observed during
the 2013/14 fire season.
• BUIs typically peak in late February, when maximum values can reach between 120 and 150.
• Current DCs generally range between 50 to 170, which indicate there is some risk of mop-up difficulty in heavy fuels.
The exceptions are Minginui (243) & Tahorakuri (294), which would have difficult to extended mop up requirements.
• DC values are mixed, and either below, at, or above the averages for this time of the year.
• Values typically peak during February or late March, with maximum DC values reaching between 450 and 650.
• CDSR values are generally below their historical averages and 2013/14 fire season.
• Current fire severity and danger for this region are, on average, Low (Figure 1 & 5).
• With forecast warm temperatures and above normal rainfall, fire dangers and fire climate severity could increase over
summer, especially if the underlying conditions continue to dry. But with further major rain events, this would keep the
fire danger Low.
Station Name BUI trends DC trends CDSR trends
vs. average vs. 2011/12 vs. average vs. 2011/12 vs. average vs. 2011/12
Taupo / Whakatane
Goudies raws below below below below well below well below
Tahorakuri raws slightly below slightly below above slightly above below below
Tihoi raws new station new station new station new station new station new station
Ruatahuna raws new station new station new station new station new station new station
Minginui raws slightly below on trend slightly above slightly above below below
Taupo raws below below below below below on trend
Taupo Aero SYNOP below below slightly below below below below
Matea raws slightly below below on trend below well below well below
Rotoaira raws new station new station new station new station new station new station
Hautu raws new station new station new station new station new station new station
page: 12Gisborne
Soil moisture:
• Soils are dry across the region, and extremely dry along the coast (Figure 3).
• The soil moisture anomaly map shows soils are much drier than normal, except in the southern locations (Wharerata)
where it is about normal for this time of the year (Figure 4).
Fire weather codes and indices:
• Stations to watch are: None
• Currently BUIs across the region range from 11 to 32. This indicates that heavy and medium fuels are starting to
become available for combustion in some areas, but the difficulty of control will generally be easy to moderately
difficult.
• BUI values are currently below, or on trend with, the historical averages for this time of the year.
• BUIs typically peak during February, with maximum values reaching between 80 and 160.
• Currently DC values are generally ranging between 170 and 400, except Raparapaririki (73), indicating moderately
difficult to difficult and extensive mop-up requirements are expected.
• DCs across the region are split slightly below, at, or slightly above their historical averages, and also values seen in
the 2013/14 weak La Niña fire season.
• DC values typically peak in late March, where maximum values can range between 400 and 800.
• CDSR values across the region are below both the historical average and 2013/14 fire season.
• Current fire severity and danger for this region are, on average, Low to Moderate (Figure 1 & 5).
• Temperatures and rainfall are forecast to be above average for February. Expect fire dangers and fire climate severity
to increase over this region if the underlying conditions continue to dry. However, any major rain events will provide
some relief.
Station Name BUI trends DC trends CDSR trends
vs. average vs. 2011/12 vs. average vs. 2011/12 vs. average vs. 2011/12
Gisborne
Hicks Bay SYNOP on trend on trend slightly below slightly below below below
Poroporo raws slightly below on trend slightly below on trend well below well below
Raparapaririki Raws new station new station new station new station new station new station
Wharekopae raws new station new station new station new station new station new station
Pouawa raws below on trend slightly above slightly above well below well below
Gisborne raws below below slightly above on trend below on trend
Gisborne Aero SYNOP below below on trend slightly below below on trend
page: 13Hawkes Bay
Soil moisture:
• Soil moisture levels across the region are dry, especially for Hastings and Central Hawkes Bay districts (Figure 3).
• The soil moisture anomaly map shows drier than normal soils across the region, especially so for Central Hawkes
Bay (Figure 4).
Fire weather codes and indices:
• Stations to watch are: Wairoa
• Currently BUIs across the region generally range from 6 to 30, indicating that heavy and medium fuels are in some
cases becoming available for combustion, and the difficulty of control is increasing. The exceptions are Wairoa
(130), Napier (60), Crownthorpe (52), Bridge Pa (60), Ongaonga (52) & Waipukurau (57), where the fuels are readily
available and difficulty of control will be very difficult.
• BUI values are either below, or at, the historical averages for this time of the year.
• BUIs typically peak around February, where maximum levels can range between 70 and 225.
• DC values are currently generally between 70 and 420, indicating moderate to extensive mop-up requirements in
some places. The exceptions are Wairoa (520), Napier (490) & Bridge Pa (515), where difficult and extensive mop-up
should be expected.
• DCs for stations north of Napier are generally below the historical average for this time of the year, except Kaiwaka,
which is above average. The remaining stations in the southern half are generally on trend or slightly above their
historical averages.
• DC values peak around late February or March, when maximum values can reach between 350 and 850.
• CDSR values are below, or well below, the historical averages and also values observed in the 2013/14 weak La Niña
fire season.
• Current fire severity and danger for this region are, on average, Low in Wairoa, but Moderate to High in Hastings and
Central Hawkes Bay (Figure 1 & 5).
• Temperatures and rainfall are forecast to be above average for February. Expect fire dangers and fire climate severity
to climb if the underlying conditions remain dry. However, any major rain events will provide some relief.
Station Name BUI trends DC trends CDSR trends
vs. average vs. 2011/12 vs. average vs. 2011/12 vs. average vs. 2011/12
Wairoa
Kaitawa raws below below below below well below well below
Tuai raws on trend on trend on trend below well below well below
Wharerata raws below on trend below below well below NA
Cricklewood raws below below slightly below below well below well below
Wairoa raws new station new station new station new station new station new station
Mahia raws below below on trend slightly above below below
Mahia aws below below below slightly below below below
Hastings
Te Haroto raws below below below below well below well below
Te Pohue raws below on trend slightly below on trend below below
Kaiwaka raws on trend slightly above above above well below well below
Waihau raws below below below slightly below below below
Napier Aero SYNOP on trend slightly above above slightly above slightly below below
Napier raws on trend slightly above slightly above on trend below below
Crownthorpe raws on trend on trend on trend on trend below below
Bridge Pa raws slightly below on trend slightly above slightly above below below
Te Apiti Road raws new station new station new station new station new station new station
Central Hawke’s Bay
Gwavas raws slightly below slightly below on trend slightly below below below
Ongaonga raws on trend on trend slightly above on trend below well below
Waipukurau raws on trend on trend on trend on trend below slightly below
Porangahau raws new station new station new station new station new station new station
page: 14Lower North Island:
Taranaki
Soil moisture:
• Soil moistures across the region are about 50% of field capacity inland (Stratford), and drier along the coast of New
Plymouth and South Taranaki (Figure 3).
• The soil moisture anomaly map shows a transition from soils being much drier than normal in the west to about
normal in the east of the region (Figure 4).
Fire weather codes and indices:
• Stations to watch are: None
• BUIs now range between 13 and 34. This indicates that heavy and medium fuels are becoming available for
combustion in some areas and the difficulty of control will generally be easy to moderate.
• BUI values are mixed, with stations below, at, or slightly above the averages for this time of the year, and levels
recorded during the 2013/14 fire season.
• BUIs typically peak at values of around 70 to 120 in late February or early March.
• DCs across the region currently range between 230 and 330, indicating a risk of difficult to extensive mop-up
requirements. The exceptions are Opunake (424), Tikorangi (157) & Marco (78), indicating either more extensive or
lesser mop up needs, respectively.
• DC values are generally above their historical averages and the 2013/14 fire season for this time of the year, except
Marco & Eltham, which are below the average.
• DC levels can increase to a peak of 350 to 700 in early March.
• CDSR values are generally above, to well above, their historical averages and the 2013/14 season.
• Current fire severity and danger for this region are, on average, Low to Moderate (Figure 1 & 5).
• Both above average temperatures and rainfall are forecast for February. Expect fire dangers and fire climate severity
to increase over this region if the underlying conditions continue to dry. But with further major rain events, this would
keep the fire danger Low.
Station Name BUI trends DC trends CDSR trends
vs. average vs. 2011/12 vs. average vs. 2011/12 vs. average vs. 2011/12
Taranaki
New Plymouth SYNOP on trend slightly below above above well above well above
Tikorangi raws new station new station new station new station new station new station
Marco raws below below below below on trend slightly above
Okato raws slightly below below above above above above
Opunake raws new station new station new station new station new station new station
Eltham raws below slightly below on trend slightly below on trend slightly above
Ngamatapouri raws new station new station new station new station new station new station
Whareroa raws slightly above on trend above above above above
Hawera aws on trend slightly below above above above above
Waverly raws slightly below below above above well above well above
page: 15Manawatu-Wanganui
Soil moisture:
• Soils are dry across this region, being very dry for Tararua, Manawatu, Horowhenua, Rangitikei and Whanganui
(Figure 3).
• The soil moisture anomaly map shows soils are wetter than normal for Ruapehu, but drier than normal for Manawatu,
Horowhenua and Tararua districts (Figure 4).
Fire weather codes and indices:
• Stations to watch are: Wanganui Aws, Waione East and Levin
• BUIs currently range between 3 and 35 for the Ruapehu, Rangitikei, Whanganui, Manawatu, Palmerston North and
southern Tararua areas, indicating that heavy and medium fuels are becoming available for combustion in some
areas and the difficulty of control will easy to moderate. Exceptions to these include Whanganui (60), Waitarere
Forest (39), Levin (42), Dannevirke (46) and Waione East (60). These values indicate fuels are readily available and
any fires in these areas will be more difficult to control.
• BUIs for this time of the year are generally below, or at, the historical average levels, and values observed during the
2013/14 weak La Niña fire season. The exceptions are Whanganui, Levin and Waione East, which are above the
average and 2013/14 fire season values.
• BUIs typically peak in March, where maximum ranges can be between 80 and 170.
• DCs are generally ranging between 80 to 230 for the Ruapehu, and inland Whanganui, Rangitikei and Manawatu
areas, and between 290 to 450 for the coastal Whanganui, Rangitikei and Manawatu, Palmerston North, Horowhenua
& Tararua areas. These values indicate that mop-up needs could be difficult and extensive, particularly in the latter
areas.
• DCs are generally below average levels in the inland areas, and either on trend or above average levels for the
coastal and southern areas for this time of the year, with Wanganui Aws and Levin at a record high for this time of the
year.
• DC values typically peak between 300 and 700 in late February or early March. For some stations, they can remain
high (400+) until early May.
• CDSR values are generally below average in inland areas, and above average in coastal and southern areas.
• Current fire severity and danger for this region are, on average, Low to Moderate (Figure 1 & 5).
• Above average temperatures and above normal rainfall are forecast for February. Expect fire danger and fire climate
severity levels to increase if the underlying conditions continue to dry. However, any major rain events will provide
some relief.
Station Name BUI trends DC trends CDSR trends
vs. average vs. 2011/12 vs. average vs. 2011/12 vs. average vs. 2011/12
Ruapehu
Kirikau Raws new station new station new station new station new station new station
National Park raws below below well below well below below below
Paradise Valley raws below below slightly below slightly below well below below
Desert Road Summit raws below below below below below below
Three Kings raws slightly below below below below above above
Waimarino Forest raws below below slightly above slightly above below on trend
Waiouru Airstrip aws well below well below well below NA below on trend
Westlawn raws below below on trend slightly below below below
Tarn Track Raws new station new station new station new station new station new station
Rangitikei
Ngamatea raws below slightly below below below on trend slightly above
Whangaehu raws on trend slightly below well below well below below well below
Raumai raws slightly below below on trend slightly below above above
Whangaehu
Ranana raws new station new station new station new station new station new station
Wanganui Spri. Park ews slightly below below on trend slightly below above above
Matarawa raws on trend NA slightly above NA well above NA
Wanganui aws above slightly above well above well above above above
Whanganui raws slightly below below above on trend on trend slightly below
Manawatu
Tapuae raws below slightly below below below below on trend
Feilding raws new station new station new station new station new station new stationManawatu-Wanganui continues
Station Name BUI trends DC trends CDSR trends
Palmerston North City
Palmerston North SYNOP below below slightly below below above above
Ngahere Park raws on trend slightly below on trend on trend slightly above above
Horowhenua
Waitarere Forest raws on trend on trend above above slightly above slightly above
Levin aws slightly above slightly above well above well above well above well above
Tararua
Dannevirke ews on trend slightly above above above slightly below below
Waione East raws slightly above above above above well above well above
Pahiatua ews on trend on trend above slightly above above slightly above
Akitio ews on trend on trend slightly above slightly above on trend on trend
Alfredton South raws slightly below slightly below above above above above
Wairarapa
Soil moisture:
• Soils are close to 50% of storage capacity for this time of the year (Figure 3).
• The soil moisture anomaly map shows soils are wetter than normal (Figure 4).
Fire weather codes and indices:
• Stations to watch are: Masterton Aero
• BUIs are currently ranging between 25 to 55, except Masterton Aero (90). This indicates that heavy and medium fuels
are generally readily available for combustion and the difficulty of control will be difficult to very difficult.
• BUIs are generally on trend with average values for this time of the year, except Masterton Aero, which is above.
However, the levels are generally above that seen during the 2013/14 fire season.
• BUI values typically peak at most stations in the region in late January to mid-February (100 – 180).
• DCs across the region are ranging between 170 to 410, indicating the heavy and deep organic fuels are becoming
readily available, and there is a risk of difficult to extensive mop-up needs.
• DCs are generally above average levels, and those seen in the 2013/14 fire season, for the same time of the year.
• DC values usually peak in late February, reaching between 500 and 800, and can remain high at some stations until
early May.
• CDSR values are mixed, and either below, at, or above the historical averages.
• Fire severity and fire danger levels for the region are, on average, Moderate to High (Figure 1 & 5).
• Above average temperatures and above normal rainfall are forecast for February. Expect fire dangers and fire climate
severity in this region to increase further if the underlying conditions continue to dry. However, any major rain events
will provide some relief.
Station Name BUI trends DC trends CDSR trends
vs. average vs. 2011/12 vs. average vs. 2011/12 vs. average vs. 2011/12
Masterton / Carterton
Castlepoint SYNOP # slightly below on trend slightly below slightly below on trend slightly above
Crofoot raws # below slightly below slightly below slightly below slightly below on trend
Holdsworth Station raws on trend slightly above above above slightly above above
Masterton Aero aws * well above well above well above well above above above
Homebush raws * well above well above slightly above above on trend on trend
Ngaumu Forest raws on trend slightly above slightly above slightly above on trend slightly above
South Wairarapa
Featherston Raws new station new station new station new station new station new station
Haurangi raws on trend on trend above above above above
Stony Creek raws on trend on trend slightly above above on trend slightly above
Ngawi aws ^ on trend slightly above slightly below above slightly below on trend
Palliser raws ^ slightly above above slightly above above below on trend
page: 17Wellington
Soil moisture:
• Soils are dry across the Wellington region, but less so in Upper Hutt (Figure 3).
• The soil moisture anomaly map shows soils are about normal for this time of the year across the region (Figure 4).
Fire weather codes and indices:
• Stations to watch are: None
• BUIs are currently between 10 and 30, indicating that heavy and medium fuels are not readily available for
combustion and the difficulty of control should be relatively easy. The exception is Titahi Bay (48), where more difficult
fire control could be expected.
• BUI values are below, to on trend, with the averages for this time of the year.
• BUIs typically peak at values up to 100 around late February.
• DC values are currently ranging between 200 and 360, except Titahi Bay (455), indicating that heavy fuels and deep
organic layers are available, and mop-up requirements could be difficult to extensive.
• DCs are generally at or above averages for this time of the year, and also levels seen during the 2013/14 fire season.
• DCs typically peak in late February (600 -700) and remain high until late April.
• CDSR values across the region are generally above average, and also above levels seen during the 2013/14 weak
La Niña fire season.
• Current fire severity and danger for this region are, on average, Low to Moderate (Figure 1 & 5).
• Above average temperatures and above normal rainfall are forecast for February. Expect fire dangers and fire climate
severities to increase further if conditions continue to dry. However, any major rain events will provide some relief.
Station Name BUI trends DC trends CDSR trends
vs. average vs. 2011/12 vs. average vs. 2011/12 vs. average vs. 2011/12
Kapiti Coast
Te Horo Raws NA NA NA NA NA NA
Paraparaumu Aero NA NA NA NA NA NA
Titahi Bay Raws NA NA NA NA NA NA
Porirua Elsdon Park aws NA NA slightly above above slightly above above
City
Belmont raws slightly below below slightly above below on trend on trend
Long Gully Raws NA NA NA NA NA NA
Wellington Aero SYNOP slightly below slightly above slightly above above above above
Rimutaka Forest raws slightly below slightly above slightly above above above above
page: 18Pacific Islands:
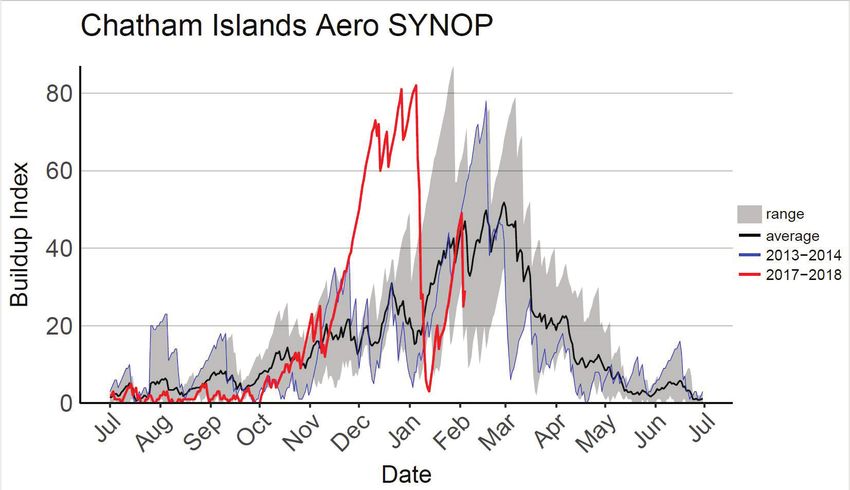
Chatham Island
• 12 noon monthly average temperatures experienced over January were slightly higher than December and were still
above average (about 2°C).
• Total rainfall for the month of January was slightly higher than December, but still well below normal, with
approximately half the average rainfall expected.
• Note: The historical averages are based on a 17-year average from stations at the Chatham Island Aero (Chatham
Island Aero SYNOP and Chatham Island Ews stations) and a 19-year average from stations at Waitangi (Waitangi
Raws and Chatham Islands Aws (Waitangi) stations).
Fire weather codes and indices:
• Stations to watch are: Waitangi
• BUI values range from 26 in the north to 50 in the south. This indicates that heavy and medium fuels are available for
combustion in the south and the difficulty of control would be difficult.
• BUI values are currently trending at or above average levels for this time of the year.
• Historically the values tend to peak from early February until March (up to 80).
• DCs are ranging between 75 in the north to 510 in the south, indicating that heavy fuels and deep organic layers are
available, and likely present difficult and extensive mop-up requirements.
• The drought indices are generally trending at or above the historical averages for this time of the year.
• Maximum DCs typically peak (around 300 – 600) during February.
• The CDSR is split either slightly below or above the historical averages for this time of the year.
• Currently, the Chatham’s are experiencing Moderate to High fire severity and Moderate to High fire danger. As we
near the peak summer season, expect fire dangers to remain elevated. Fire severity and danger levels are expected
to remain High throughout the first half of February.
Station Name BUI trends DC trends CDSR trends
vs. average vs. 11/12 vs. average vs. 11/12 vs. average vs. 11/12
Chathams
Kaiwhata raws new station new station new station new station new station new station
Chatham Islands Aero below below below below well above well above
Waitangi raws new station new station new station new station new station new station
page: 19You can also read