FULL-YEAR 2020 RESULTS STADLER RAIL
←
→
Page content transcription
If your browser does not render page correctly, please read the page content below
FULL-YEAR 2020 RESULTS
STADLER RAIL

Peter Spuhler, Executive Chairman and Group CEO a. i., Raphael Widmer, Group CFO
11 March 2021
REPRESENTING STADLER TODAY

          Peter Spuhler                                      Raphael Widmer
          Executive Chairman                                 Group CFO
          and Group CEO a. i.

Stadler full-year results 2020 | © Stadler | 11 March 2021                    2
AGENDA

  1
                                                             Peter Spuhler, Executive Chairman
            Highlights 2020
                                                                            and Group CEO a. i.

  2
            Full-year 2020 financial results                      Raphael Widmer, Group CFO

  3
                                                             Peter Spuhler, Executive Chairman
            Summary and outlook
                                                                            and Group CEO a. i.

Stadler full-year results 2020 | © Stadler | 11 March 2021                                        3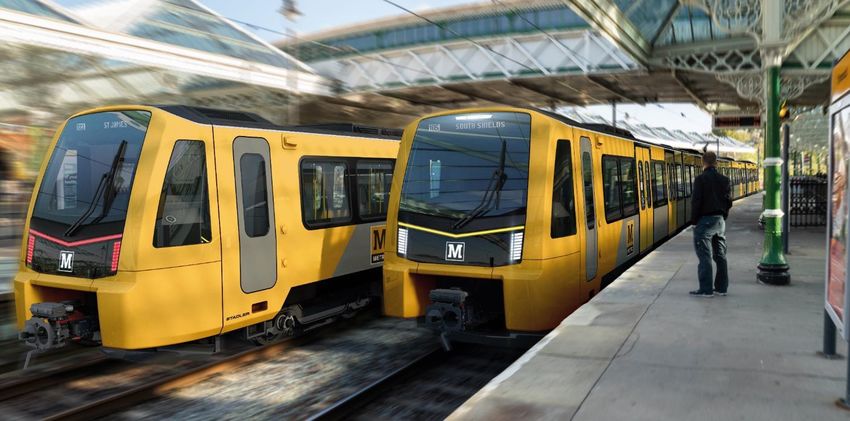
HIGHLIGHTS 2020
WE ARE AN INDUSTRY LEADER
                    >8,500 Stadler trains and locomotives running in 43 countries every day

                       465                vehicles delivered in 2020

                      >200                million kilometres covered every year by vehicles serviced by Stadler

                         12               core sites across high- and low-cost countries

                  >12,300 employees(1), including engineering team of over 1,700 employees

                      ~11 %               net sales CAGR over the last decade(2)

                       16.1               billion CHF backlog as at 31 December 2020

                       549                trains and locomotives ordered in 2020
Notes:
(1)      average FTEs 1 January to 31 December.
(2)      2010-2020.

Stadler full-year results 2020 | © Stadler | 11 March 2021                                                 5
COMPREHENSIVE PORTFOLIO
 Market segments and vehicle families                                                                                   Order backlog contributions 2020

                      Market                                                                                                           Reporting segment
    Type                                                     Vehicle families
                     segment

                    Very High                                                                                                26%
                                                             Not a strategic focus
                     Speed                                                                                                                               Rolling Stock
                                                                                                                                                         Service & Components
                   High Speed                                                                                                             74%

   Trains            Intercity                                                                                                            Market segment

                    Regional /                                                                                                                           Trains
                    Suburban                                                                                                 26%                         Locomotives
                                                                                                                                           35%

                                                                                                   Services & Systems
                                                                                                                                                         Metro
                     Coaches                                                                                                12%                          LRV

                                                                                     Tailor-made
                                                                                                                                          6%             Tailor-made
                                                                                                                               9%
                                                                                                                                    12%                  Service & Components
                     Main-line
                   locomotives
   Loco-
  motives                                                                                                                                 Regional markets
                     Shunting
                   locomotives                                                                                                                           DACH
                                                                                                                              10%
                                                                                                                                                         Western Europe
                                                                                                                                 2%
                                                                                                                            10%                          Eastern Europe
    Metro              Metro                                                                                                      1%       43%
                                                                                                                                                         Americas
                                                                                                                                                         CIS
                      Tram /                                                                                                  34%
     LRV                                                                                                                                                 Rest of the world
                    Tram Train

Stadler full-year results 2020 | © Stadler | 11 March 2021                                                                                                                   6
FULL-YEAR 2020 KEY FIGURES

                                                    Vehicles delivered                               Order intake                  Order backlog
                                                                 Order intake                                               Order Backlog
                                                    465                                              CHF 4.3bn                   CHF 16.1bn
                                                    +5%(1)               CHF X.Xbn                   -15%(1)                CHF XXbn
                                                                                                                                 +7%(1)
                                                                         +XX%                                               +XX%

                                                                                                     Net revenues                  EBIT margin
                                                                                                     CHF 3.1bn                     5.1%
                                                                                                     -4%(1)                        -1 %-pts(1)

                                                                                                     Free Cash Flow(2)             Net profit
                                                                                                     CHF -458.9m                   CHF 138.4m
                                                                                                     -CHF 130.0m(1)                +8%(1)

(1)   Change year-on-year.
(2)   Defined as EBITDA –Capex –Change in NWC. EBITDA is calculated as the sum of EBIT and depreciation and amortization.

Stadler full-year results 2020 | © Stadler | 11 March 2021                                                                                         7
COVID-19 IMPACT
                                                             – Demand remaining strong, no order cancelations and no
                                                               large tenders lost
                   Market
                                                             – Ongoing tenders largely on track but some final decisions
                   environment                                 postponed due to Covid-19 and appeals by competitors
                                                             – New tenders being launched
                                                             – Interruptions to internal and external supply chains
                   Impact on                                 – Travel restrictions affecting Stadler employees, homologation
                   Operations                                  officials and customers which impacts final payments
                                                             – All plants currently operating at largely normal levels

                                                             – Health and safety measures initiated immediately
                   Counter                                   – Adapting assembly sequences and working shift times with
                   measures                                    employees partially working remotely
                                                             – Decentralised supply chain

                                                             –   Partial recovery of deferred revenues achieved in H2 2020
                   Financial                                 –   Adverse effect on net working capital
                   impact                                    –   Service & Components impacted by lower mileage
                                                             –   Significant order backlog and resilient end market

Stadler full-year results 2020 | © Stadler | 11 March 2021                                                                     8
ORDER INTAKE HIGHLIGHTS 2020
Tyne & Wear Metro Metro Berlin LRVs
− 42 METRO trains, a new Framework agreement for up to Up to 80 TRAMLINK for Milan (EUR
maintenance plant and a 35-year 1,500 METRO cars valued at up to 172.6m). Firm order for 30 trams
service contract EUR 3.0bn 24 TRAMLINK for Jenaer
− Valued at c. GBP 700m First call-off for 606 cars including Nahverkehr (EUR 92m), with option
spare parts amounts to EUR 1.2bn for up to 19 additional vehicles
Tailor Made Mainline Signalling
MGB ordered 12 out of 27 new 21 additional KISS trains ordered Full homologation for GUARDIA
«ORION» trains for c. CHF 150m by the Hungarian Railways for over European Train Control System
20 “Capricorn” trains worth CHF EUR 300m First ETCS refit contract for Stadler
170m in an option call-off from RhB Twelve more KISS trains for Mälab won in the Netherlands
Eight New tailor-made trains for the for over CHF 130m First urban mass transit signalling
Centovalli railway system awarded (MARTA)
Stadler full-year results 2020 | © Stadler | 11 March 2021 9
SIGNALLING: ACHIEVEMENTS 2020 AND
OUTLOOK
                                            Milestones in 2020                                       Outlook
  CBTC(1)                                   First urban mass transit signalling
                                            system awarded to Stadler: Supplying a                   Stadler in dialogue with several
                                            CBTC-like train control system(2) on the                 European metro operators
                                            new Stadler vehicles for MARTA (Atlanta,
                                            USA)

  ETCS(3)                                                                                            Homologation in 10 countries
                                             Homologation in Switzerland and Poland                  until 2022 expected
                                             Homologation under way in Hungary,
                                             Slovenia, Italy, and Germany                            Retrofit market potential

  ATO(4)
                                            First automatically operated train ride with
                                                                                                     Increasing demand for ATO in
                                            passengers in the Netherlands – achieved
                                                                                                     numerous tenders
                                            by using the Stadler ATO

                                                  Stadler is delivering across all signalling market segments
(1)   Communication Based Train Control
(2)   Derived from Stadler’s full CBTC solution
(3)   European Train Control System
(4)   Automatic Train Operation

Stadler full-year results 2020 | © Stadler | 11 March 2021                                                                          10
MARKET OUTLOOK
TOTAL OEM AND TARGETED MARKETS 2020 VIEW
Stadler’s strategic markets
Global rolling
Global rolling stock
stock Targeted market
1 2 segments 3 Targeted regions
OEM market
OEM market
2019(1) market size (€Bn) 54 35 27
2014-19(1) CAGR +1.7% +2.2% +4.7%
2019-24(1) CAGR +3.6% +4.4% +2.3%
Freight
Cars
12
Rolling Stock
VHS(2) 8
HS 2
OEM East
Asia(3)
7
Opportunistic
MU 10 HS 2
markets
RoW
South- 8
east Asia MU 9
Metro 9 CIS
1
4
North Metro 4
LRV America 3
3 LRV 2
markets
Home-
Locomotives 7 Europe 12 Locomotives 6
Coaches 3 Coaches 3
By segment By region By segment
2019-241)
CAGR
Service ~7
+2.8%
2019-241)
System CAGR
~18
Technology4) +1.0% (5))
Source: SCI (2020).
Market volumes based on € value of equipment and services delivered.
(1) 2019 market size defined as average of 2018-2020, 2014 defined as 2013-2015 average and 2024 defined as 2023-2025 average.
(2) Very High Speed trains (VHS) defined as trains with top speed above 251km/h.
(3) East Asia defined as China + South Korea + Japan. Rest of the World (RoW) includes Asia (excluding East Asia), South and Central America, Middle East and Africa.
(4) System Technology includes Control, Command and Signalling (CCS) and Passenger Information Technology (PIT); excluding East Asia.
(5) Expected CAGR 2019-2024 for western Europe: +2.2%.
Stadler full-year results 2020 | © Stadler | 11 March 2021 11COMPETITIVE LANDSCAPE
MARKET SHARE BY REGION
Home markets Opportunistic markets
North America: EUR 2.6 bn Europe: EUR 11.9 bn CIS: EUR 4.2 bn
Other
7%
12% HS 17% Bombardier
Bombardier 19% Stadler (2%) Other
Other 28% Alstom
39% 11% 1%
23% Hitachi Rail 5% 6% Siemens 2% 11%
37% 2%
47% MU 13%
Stadler (1%*) 4% CAF 6%
16% 7% 44% Sinara
Progress Rail 7% 71%
8% Metro
26% 10% 12% 13% TMH
Kawasaki CRRC 13% LRV 16%
Siemens
GE / Wabtec 12% Locomotives Alstom 21%
12% 15%
3% Coaches
Stadler (15%)
Opportunistische Märkte
RoW: EUR 8.0 bn Southeast Asia: EUR 0.6 bn
10%
25% Other CRRC
Other CRRC
22% 21%
20%
34%
3% Hyundai Rotem Hitachi Rail 4%
5% 3% 50% 64%
Modern Coach Factory Vietnam Railways 6%
30% 5% 8%
Alstom 15% Hyundai Rotem 27%
Industri Kereta Api
ICF 2%
4%
22%
10%
2018: Stadler 1%
Market leaders: CRRC (31%), Bombardier & ICF (9%
each), TMH (8%), Alstom (7%) followed by Siemens and Stadler is particularly strong in Europe (No. 3).
Stadler (4% each).
Source: SCI (2020), SCI marketstudy Worldwide Market for Railway Industries 2020.
Market share based on delivered units in 2019 (average 2018-2020). High Speed (HS) 200 to 250 km/h.
*(2018 values)
Stadler full-year results 2020 | © Stadler | 11 March 2021 12COMPETITIVE LANDSCAPE
GLOBAL MARKET SHARE BY SEGMENT
EMU/DMU: EUR 9.8 bn Focus segments Locomotives: EUR 7.2 bn
Bombardier Southeast Other
23% Asia TMH
18% 17%
1% Other 38% Stadler (1%) 25%
9% RoW
2% 34% Siemens
0% 5% 1%
29% CIS
15% ICF Sinara 8%
64% 10%
North America 9% 17%
5% 23% DLW CRRC
12%
6% Europe 9% 10%
TMH
11% Alstom
CRRC CLW GE / Wabtec
Stadler (17%)
Metro: EUR 9.2 bn LRV: EUR 2.6 bn HS: EUR 2.4 bn
Other 11%
0%
Stadler (3%) 9% Bombardier Stadler (6%) Other
36% TMH Other Hitachi Rail 8%
1% 17% 13% Alstom
Bombardier 6%
9% Hyundai Rotem 4% 4% 12% 12% 2%
6%
41% Siemens 8%
11% 100% 55% CRRC
Alstom
6% 10%
TMH Alstom 8%
23% 67% 12%
62% 9%
CRRC 6% 9%
Stadler (9%) Bombardier
21% CRRC CAF
On the basis of Global market
excl. China, South Korea and Japan
Global potential in Locomotives, Metro, LRV und
Stadler is strong in EMU/DMU segment.
High Speed segments.
Source: SCI (2020), SCI marketstudy Worldwide Market for Railway Industries 2020.
Market share based on delivered units in 2019 (average 2018-2020). High Speed (HS) 200 to 250 km/h.
Excluding Coaches .
Stadler full-year results 2020 | © Stadler | 11 March 2021 13COMPETITIVE LANDSCAPE
MARKET SHARE EUROPE BY SEGMENT
Home markets
Focus segments
LRV: EUR 1.5 bn Locomotives: CHF 1.5 bn
Bombardier Other
Alstom
Other Stadler (2%) 10%
18%
30% Stadler (15%) Newag 4% 41%
Siemens
5% 5%
16% Vossloh 6%
10% 7%
14% CZ Loko
Skoda 12% 23%
CAF
Alstom Bombardier
EMU/DMU: CHF 5.5 bn
Metro: CHF 0.9 bn Other Highspeed: CHF 2.1 bn
CAF 9%
Other Stadler (7%) Other
7% Alstom
Stadler (9%) Alstom Consortium AL-BT 3%
9% Bombardier
9% 26% Siemens 38% 9% 6% 25%
9%
Bombardier 11%
15%
11% 18% Hyundai Rotem Bombardier 23%
Siemens 15% 19%
16% Siemens
Alstom
Hitachi Rail Hitachi Rail
22%
Stadler (22%)
Compared to the previous year, Stadler won 2%
Stadler improved its position in LRV to No. 2.
market share in Locomotives.
Source: SCI (2020), SCI marketstudy Worldwide Market for Railway Industries 2020.
Market share based on delivered units in 2019 (average 2018-2020). High Speed (HS) 200 to 250 km/h.
Stadler full-year results 2020 | © Stadler | 11 March 2021 14FULL-YEAR 2020 FINANCIAL RESULTS
FULL-YEAR RESULTS 2020 SUMMARY
CHFm

      Order intake                                                                  Order backlog                                                                    Net revenues

                                                                                                                +7.2%                                                                             -3.6%
                                 -15%
             5’117                                                                          15’026                                 16’106                                      3’201                                 3’085
                                                    4’332

              2019                                  2020                                31.12.2019                            31.12.2020                                       2019                                   2020

      EBIT                                                                          Net working capital(1)                                                           Capital expenditure(2)
                              -19%                                                                       + CHF 423m
             194                                                                                                                                                                                  +16%
                                                 156                                                                                  450                                                                              288
                                                                                                                                                                                 249
            6.1%                               5.1%

                                                                                                27

            2019                                2020                                   31.12.2019                             31.12.2020                                       2019                                   2020
            EBIT as % of net revenues                                                          Change year-on-year
(1)    Net working capital is calculated by subtracting the sum of trade payables, liabilities from work in progress and other current liabilities (including other current liabilities, current provisions and deferred income and accrued
       expenses) from the sum of trade receivables, inventories, work in progress and other current assets (including other current receivables, compensation claims from work in progress and accrued income and deferred expenses).
(2)    Capital expenditure is calculated as the sum of investments in tangible and intangible assets.
Stadler full-year results 2020 | © Stadler | 11 March 2021                                                                                                                                                                                16
ORDER INTAKE
CHFm
-15%
5’117
Others(1) 8%
833 4’332 2%
Americas 17%
14%
1’456 +75% Eastern Europe 17%
31%
Western Europe 16%
4’284
2’875 -33%
DACH 42% 53%
2019 2020 2019 2020
Rolling Stock Service & Components
Comments
Rolling Stock
Major orders in DACH region (BVG Metro Berlin, Germany) and Western Europe (Nexus, UK)
Large Tailor Made orders in Switzerland: a new order from Matterhorn Gotthard Bahn (MGB) and
an option call-off by Rhaetian Railway (RhB)
Service & Components
Strong order intake mainly driven by two long-term service contracts in connection with the
Rolling Stock orders from BVG, Germany, and Nexus, UK
(1) Others: CIS and rest of the world.
Stadler full-year results 2020 | © Stadler | 11 March 2021 17ORDER BACKLOG BY REPORTING SEGMENT
CHFbn
16.1
+15% CAGR 15.0
13.2 2.8 18% 4.1 26%
11.0 2.3 17%
9.3 2.0 18%
0.8 9%
12.3 12.0
10.9
8.5 9.0
31.12.2016 31.12.2017 31.12.2018 31.12.2019 31.12.2020
Rolling Stock Service & Components % Share of Service & Components
Order backlog of 16.1bn with a growing Service & Components share
Stadler full-year results 2020 | © Stadler | 11 March 2021 18ORDER BACKLOG BY PRODUCT SEGMENT
31 Dec 2019 31 Dec 2020
18%
26%
Executing on
strategic focus 35%
11%
50%
Trains 12%
7%
Locomotives
Metro 6%
8% 9%
6% LRV 12%
Tailor-made
Service & Components
High quality and increasingly diversified order backlog
Stadler full-year results 2020 | © Stadler | 11 March 2021 19NET REVENUES
CHFm
-3.6%
3’201
3’085
261
343 +32%
+3.1%
2’086 2’150
148 197
-6.7% -16%
2’940 2’742 1’115
113 935
1’938 1’953
146
1’002 789
2019 2020 H1 2019 H1 2020 H2 2019 H2 2020
Rolling Stock Service & Components
Comments
Rolling Stock
Partial recovery of Covid-related delays with revenues up year-on-year in the second half
Revenues in the full-year only declined slightly
Corona-related supply chain disruptions and delays in homologation processes and final vehicle
takeovers by customers due to travel restrictions
Service & Components
Revenue growth below expectations as a result of lower frequencies in public rail transport and
hence less revenues from mileage of vehicles in service. Less sales of spare parts and repairs
Stadler full-year results 2020 | © Stadler | 11 March 2021 20EBIT
CHFm
250 15%
-19%
200 194
151 156 10%
150
7.0%
6.1%
5.1%
100
5%
50
0.5%
5
0 0%
2019 H1 2020 H2 2020 2020
EBIT EBIT in % of net revenues
Comments
Rolling Stock
Corona-related delays led to a decline in revenues in the first half. Profitability impacted by
lower volumes, supply chain disruptions and implementation of health and safety measures
Significant margin recovery in the second half of 2020 to H2 2019 levels
Adverse NOK/CHF impact of ~CHF 30m on EBIT from last remaining option call-off
Service & Components
− High-margin service business impacted by lower fixed cost absorption due to revenues below
expectations as a result of less mileage of vehicles in service and spare parts sales
Stadler full-year results 2020 | © Stadler | 11 March 2021 21NET INCOME
CHFm 2019 2020 Change YOY
Earnings before interest and taxes (EBIT) 193.7 156.1 (19%)
Financial result (47.1) (3.1)
Share of results from associates 4.0 2.8
Ordinary result 150.6 155.8 3.5%
Non-operating result (2.1) (1.2)
Profit before income taxes 148.5 154.7 4.1%
Income taxes (20.0) (16.3)
Profit for the period 128.5 138.4 7.7%
thereof attributable to
- Shareholders of Stadler Rail AG 127.2 137.6
- Non-controlling interests 1.4 0.8
Comments
− Net income increased compared to the previous year
− Mainly impacted by favourable currency exchange rate effects on balance sheet, lower bank
guarantee costs, and tax effects
Stadler full-year results 2020 | © Stadler | 11 March 2021 22NET CASH POSITION
CHFm
6
929 Cash and cash equivalents
753
-468 -534 Non-current financial liabilities
-279
-1’003 Current financial liabilities
-608
31.12.2019 31.12.2020
Comments
Decline in net cash position mainly a result of deferred homologation, customer acceptance and
final invoicing of new vehicles
Significant growth investments
Continuous ramp-up of production and work in progress
Additional project financing facilities
Stadler full-year results 2020 | © Stadler | 11 March 2021 23NET WORKING CAPITAL
Net working capital(1) (CHFm)
450
27 47
286 301 Trade receivables (48) (91) 450
818 862 Comp. claims from WIP
486
201 Inventories
232
132 179 Other current assets
27 44 (31)
-317 Work in progress (net) 15
Inventories
-804
31.12.2019
Other current assets
31.12.2020
Trade receivables
Work in progress (net)
Other current liabilities
Trade payables
Comp. claims from WIP
-298 Trade payables
-478 Other current liabilities
-250
-386
31.12.2019 31.12.2020
Comments
Covid impacts led to bottlenecks in homologation, deliveries, and final customer acceptance
Largely finished but not yet delivered vehicles remain in work in progress which drives growth in
net working capital and ties up cash
(1) Net working capital is calculated by subtracting the sum of trade payables, liabilities from work in progress and other current liabilities (including other current liabilities, current provisions and deferred income and accrued
expenses) from the sum of trade receivables, inventories, work in progress and other current assets (including other current receivables, compensation claims from work in progress and accrued income and deferred expenses).
Stadler full-year results 2020 | © Stadler | 11 March 2021 24CAPITAL EXPENDITURE
CHFm
288
248 57
35
188
14
231
213
76 174
55 11
8
65
48
2016 2017 2018 2019 2020
Investments in tangible assets Investments in intangible assets
Comments
Over EUR40m invested in capacity expansion in Germany related to a framework contract for
the delivery of up to 1,500 METRO cars for Berlin. Capacity additions in Hungary (CHF40m).
Circa CHF37m invested in equipment and land at recently opened manufacturing site in
St. Margrethen, Switzerland
Investments in intangible assets mainly relate to development of new high-speed SMILE vehicle
concept, new products in locomotives and signalling
Stadler full-year results 2020 | © Stadler | 11 March 2021 25OUTLOOK: CLEAR STRATEGY FOR BRINGING STADLER TO THE NEXT LEVEL
WE HAVE A CLEAR STRATEGY FOR BRINGING
STADLER TO THE NEXT LEVEL
                                       Stadler sales 2018                                                      Stadler strategy 2023
                                                                                                                    Signalling
                               Service &
                              Components
                                                                                                 Service &
                                                                                                Components

                                                      Rolling                                                                       Rolling
                                                      Stock                                                                         Stock

                                                                              Strategic focus

                                                                                              Service &
                                                             Rolling Stock                                                        Signalling
                                                                                             Components
                                                         •   Market segments             •   Growing                        •    Establish own
                  Europe                                     unchanged                       accessible market                   signalling
                                                                                             and installed base                  solutions
                                                         •   Deliver on
                                                             backlog and                 •   New service                    •    AngelStar JV with
                  North America
      Regions

                                                             establish next                  solutions                           Mermec
                                                             sales level
                                                                                         •   Capture                        •    Potential
                                                         •   Growth through                  opportunities                       opportunistic
                  CIS
                                                             new product                     from signalling                     acquisitions
                                                             pipeline
                                                                                         •   Potential selective
                  New markets                                                                acquisitions

   Note: Sizes of pie charts are illustrative only.

Stadler full-year results 2020 | © Stadler | 11 March 2021                                                                                           27
ADDITIONAL GROWTH POTENTIAL DUE TO
GOVERNMENT SUPPORTED PROGRAMS
Supportive mega trends Rail as a structural beneficiary of government stimulus
Connecting Europe – €24bn for transport until 2020
EU Green Deal – €1trn funding in total over 2021-2027
Green transportation with low
EU Recovery Plan – €1.85trn with Rail share of €40bn+ until 2027
carbon emission
Rail modernization – €86bn over the next decade
€5.5bn injection into Deutsche Bahn
Urbanisation combined with
stronger connectivity between Plan de reliance – €4.7bn to rail (of which €3bn into Signalling) and
cities €1.2bn to daily transport
Network Rail’s Infrastructure Enhancement – £9.4bn until 2024
COVID-19 rescue package – £3.5bn approved for rail operators
Increased investments in
infrastructure
Surface transportation bill – $60bn allocated to Rail
American Rescue Plan Act of 2021 – $30.5bn in emergency funding
for public transport
Short-term emergency funding combined with long-term investment plans
Stadler full-year results 2020 | © Stadler | 11 March 2021 28FY 2021 FINANCIAL GUIDANCE
Order intake Between CHF 4.0bn and 5.0bn
Net revenues Between CHF 3.5bn and 3.8bn
EBIT-margin Above 6 %
Capex of around CHF 200m
Capex / FCF Positive Free Cash Flow
Dividend Payout ratio of c. 60% of net income
Our 2021 financial guidance is based on the assumption that the effects of the
COVID-19 pandemic will soon normalise and at constant currency exchange rates.
Stadler full-year results 2020 | © Stadler | 11 March 2021 29MID-TERM FINANCIAL GUIDANCE
EBIT-margin 8 to 9% from 2023 onwards
Dividend Payout ratio of c. 60% of net income
Our 2021 financial guidance is based on the assumption that the effects of the
COVID-19 pandemic will soon normalise and at constant currency exchange rates.
Stadler full-year results 2020 | © Stadler | 11 March 2021 30THANK YOU!
REPORTING SEGMENTS

      Rolling Stock
 CHFm                                                         2019     2020    Change
 Order intake                                                 4’284   2’875      -33%
 Order backlog                                               12’254   11’996      -2%
 Net revenues (third party)                                   2’940   2’742       -7%
 Additions to fixed assets                                     186      184       -1%
                                   (1)
 Total staff as FTEs                                          8’408    9’111      8%

      Service & Components
 CHFm                                                         2019     2020    Change

 Order intake                                                  833    1’456      75%
 Order backlog                                               2’772     4’110     48%
 Net revenues (third party)                                    261      343      32%
 Additions to fixed assets                                      35       67      91%
                                 (1)
 Total staff as FTEs                                         2’326     3’011     29%

(1)    average FTEs 1 January to 31 December
Stadler full-year results 2020 | © Stadler | 11 March 2021                          32
INFORMATION
Share information Investor contact
Listing: SIX Swiss Exchange Daniel Strickler
Currency: CHF Investor Relations Officer
Ticker symbol: SRAIL Phone: +41 71 626 86 47
ISIN: CH0002178181 E-mail: ir@stadlerrail.com
Listing date: 12 April 2019
Financial calendar Media contact
06 May 2021: Annual General Meeting Andreas Petrosino
25 August 2021: Publication of half-year results 2021 Deputy Head of Communications & PR
Phone: +41 71 626 19 19
E-mail: medien@stadlerrail.com
Stadler full-year results 2020 | © Stadler | 11 March 2021 33DISCLAIMER
IMPORTANT NOTICE
This presentation (the "Presentation") has been prepared by Stadler Rail AG ("Stadler" and together with its subsidiaries, "we", "us" or the "Group") and includes forward-looking
information and statements concerning the outlook for our business. These statements are based on current expectations, estimates and projections about the factors that may
affect our future performance, including global economic conditions, and the economic conditions of the regions and markets in which the Group operates. These expectations,
estimates and projections are generally identifiable by statements containing words such as “expects,” “believes,” “estimates,” “targets,” “plans,” “outlook” or similar expressions.
There are numerous risks and uncertainties, many of which are beyond our control, that could cause our actual results to differ materially from the forward- looking information
and statements made in this Presentation, which, in turn, could affect our ability to achieve our stated targets. The important factors that could cause such differences include:
changes in the markets the Group serves, including as a result of changes in the global demand for transportation and demographic changes; the Group's ability to successfully
develop, launch and market new products and services; the Group's ability to retain existing customers and/or secure new customers; the Group's ability to compete with existing
and new competitors; the Group's ability to maintain the high quality, reliability, performance and timely delivery of its products and services; the impact of fluctuations in foreign
exchange rates; and such other factors as may be discussed from time to time. Although we believe that our expectations reflected in any such forward-looking statement are
based upon reasonable assumptions, we can give no assurance that those expectations will be achieved.
PRESENTATION OF FINANCIAL INFORMATION
This Presentation has been prepared by Stadler solely for informational purposes. Certain financial data contained herein is based on historical financial information of Stadler
that has been prepared in accordance with the accounting standards of Swiss GAAP FER, unless otherwise stated. In addition, certain financial data included in the Presentation
consists of "non-Swiss GAAP financial measures". These non-Swiss GAAP financial measures may not be comparable to similarly titled measures presented by other companies,
nor should they be construed as an alternative to other financial measures determined in accordance with Swiss GAAP. You are cautioned not to place undue reliance on any
non-Swiss GAAP financial measures and ratios included herein.
In addition, certain financial information contained herein has not been audited, confirmed or otherwise covered by a report by independent auditors and, as such, actual data
could vary, possible significantly, from the data set forth herein.
THIS PRESENTATION IS NOT AN INVITATION TO PURCHASE SECURITIES OF STADLER OR THE GROUP.
Stadler full-year results 2020 | © Stadler | 11 March 2021 34You can also read