UAE MARKET REVIEW AND FORECAST - RESEARCH 2019 - Knight Frank
←
→
Page content transcription
If your browser does not render page correctly, please read the page content below

RESEARCH

                   UAE MARKET
                   REVIEW AND
                   FORECAST
                    2019

                                     THE ANNUAL REVIEW AND FORECAST OF THE UAE REAL ESTATE MARKET

UAE Market Review and Forecast 2019.indd 1                                                          1/9/19 11:33 AM
RESEARCH
UAE MARKET REVIEW
AND FORECAST 2019
Headlines Macroeconomic overview
The UAE’s GDP is expected to grow The United Arab Emirates’ GDP increased by 0.8% in 2017, down from 3.0% in 2016.
by 2.8% in 2018, up from the 0.8% Over the course of 2018, the Central Bank of the UAE’s Overall Augmented Economic
registered in 2017. Composite Indicator, has shown that GDP growth has strengthened throughout the year
on the back on higher oil prices, higher levels of production in the hydrocarbon sector
Residential prices and rents are likely and a strengthening non-oil sector. This indicator estimates that the year-on-year GDP
to continue to soften in 2019, however percentage change to Q3 2018 stands at 3.1%, with the overall 2018 annual growth rate
we may see additional demand which expected to register at 2.8% and 4.2% in 2019 (Figure 1).
helps underpin the market as a result
of the recent approval of a range of
legislations to ease visa regulations, Abu Dhabi’s GDP grew by 1.5% in the to support demand. In addition to this,
given that many of the changes are year to Q2 2018 with both oil and non-oil employment has remained broadly
linked to property ownership. GDP registering year-on-year growth. unchanged in the first 11 months of the
The oil sector’s growth of 1.0%, has been year which has impacted a broad range of
driven by higher levels of production and sectors in terms of demand.
In the short to medium term we expect
that market conditions in the UAE’s by the higher oil price. Growth in the oil
sector is likely to have underpinned Abu
office sector will remain challenging
Dhabi’s non-oil sector, which in the year to
Outlook
with rental rates continuing to fall.
Q2 2018 recorded growth of 2.0%. Outlook for the UAE‘s GDP growth in
As a result of the level of incoming retail 2018 and 2019 remains positive on the
Dubai’s GDP grew 2.8% in 2017, down
supply in Abu Dhabi and more so in back of higher oil prices, a range of
from 3.1% from a year earlier, according
Dubai, it is likely to mean that operators stimulus packages and easing of business
to data from Dubai Statistics Centre.
and retailers are likely to face extreme regulations in both Abu Dhabi and Dubai,
A slowdown in the annual percentage
pressure over the coming five years. which are likely to support activity in both
growth in three out of the five largest
the public and private sectors.
economic sectors within Dubai has led to
In the UAE’s hospitality sector we the overall growth rate slowing. Recent forecasts from the IMF indicate
anticipate that the changing nature global economic growth is likely to
of room night demand and sustained Throughout 2018, the trend of a more
continue its steady expansion with growth
development pipeline will result in tepid economic backdrop has remained
forecast at 3.7% in both 2018 and 2019,
RevPAR levels weakening over 2019. fairly constant, with the Emirates NBD
down only marginally by 0.2% from the
Dubai Economy Tracker Index (DET)
previous forecasts. Despite this slight
recording an average, in the year to
downgrade in global growth forecasts,
November 2018, of 55.2, a figure which
the IMF has revised up the UAE’s GDP
is slightly lower than the average for the
growth forecasts for both 2018 and
same period a year before. More so,
2019 from 2.0% to 2.9% and 3.0% to
consumer demand remains weak with
3.7% respectively. The latter estimate is
the selling price in Dubai’s private sector
materially lower than the aforementioned
declining for the majority of the year, this
estimates by Central Bank of the UAE.
is despite rising input costs, suggesting
firms are having to cut margins in order
FIGURE 1 FIGURE 2
TAIMUR KHAN UAE GDP, Y-o-Y % change UAE GDP Forecast, Y-o-Y % change
Research Manager
8% 8%
“Despite the slight downgrade in 6% 6%
global growth forecasts, the IMF 4% 4%
has revised up the UAE’s GDP 2% 2%
growth forecasts for both 2018
0% 0%
and 2019.” Overall augmented economic
composite indicator
IMF Forecast
-2% -2%
-4% -4%
-6% -6%
2008
2009
2010
2011
2012
2013
2014
2015
2016
2017
Q1 2018
Q2 2018
Q3 2018
Q4 2018 (F)
2008
2009
2010
2011
2012
2013
2014
2015
2016
2017
2018
2019
Please refer to the important
notice at the end of this report. Source: Knight Frank Research, Macrobond and the Central Bank of the UAE Source: Knight Frank Research, Macrobond and the Central Bank of the UAE
UAE Market Review and Forecast 2019.indd 2 1/9/19 11:33 AM
UAE MARKET REVIEW AND FORECAST 2019
Residential decline in transactions moderate with
transactions falling 3% year-on-year to
FIGURE 4
Dubai mainstream rental performance
Dubai November 2018.
12-month 6-month 3-month
Mainstream residential prices in Dubai fell % change % change % change
by 4.1% over the year to November 2018 Abu Dhabi
according to the Property Monitor Index*. In the year to November 2018 average
Prices for villas continue to fall at a faster sales prices in the capital fell by 4.7%,
pace at 6.1%, compared to prices for -3.9%
according to the Property Monitor Index*. -5.1%
apartments which fell by 4.8% over the Annual price declines on average for
same time period (Figure 3). apartments and villas/townhouses were -8.6%
On a community wide basis, data as at recorded at 4.4% and 4.9% respectively
November 2018 shows that of the 61 (Figure 5). Note: Data to November 2018
Source: Knight Frank Research, Property Monitor
communities and property types tracked Key-sub submarkets and property types
in Dubai by Property Monitor, only one in Abu Dhabi have continued to see
FIGURE 5
area has registered an annual increase in prices fall in the year-to November 2018, Abu Dhabi mainstream price performance
prices, this is down from Q1 2018, where however the rate at which prices are
five areas had registered increasing prices falling is slowing. Over this time period, 12-month 6-month 3-month
in Dubai. The current gap between the top the largest declines were witnessed in Al
% change % change % change
and bottom ranking communities, in terms Reem Island’s apartment market which
of annual price performance, currently fell 5.7% and in Saadiyat Island’s and Al
stands at 9.1%, up from the 7.6% Reef’s villa/ townhouse markets, which -2.5%
registered in March 2018. These price -3.8%
fell by 5.6% each. Whilst, seven of the 10 -4.7%
movements show that we are continuing sales markets tracked by Knight Frank
to see a fragmented market operate in have shown annual price declines of
Dubai. 5.0% or more in the year to November
Compared to the mainstream market, 2018, there have been some areas which Note: Data to November 2018
Source: Knight Frank Research, Property Monitor
the prime market has performed better in have outperformed the market in relative
relative terms, however there still has been terms, albeit with prices still declining.
pressure on prices, with prime residential Apartments on Yas Island recorded the FIGURE 6
prices in the year to November 2018 lowest level of annual price falls at 1.4% Abu Dhabi, sub-markets, y-o-y % price
falling on average by 3.3%. (Figure 6). change to November 2018
Rental rates across Dubai fell on average* Rental rates across Abu Dhabi fell on Al Reef -5.0%
average* by 8.7% in the year to November
APARTMENTS
by 7.7% in the year to November 2018 Al Ghadeer -4.2%
with apartment rents falling by 8.4% and 2018 according to the Property Monitor Al Reem Island -5.7%
villa/townhouse rents by 8.3% over the Index*. On average, apartment rents fell Yas Island -1.4%
same time period (Figure 4). by 7.7% and Villa rents by 8.4% over the Al Raha Beach -5.4%
same time period (Figure 7). Saadiyat Island -5.0%
Gross yields in Dubai currently stand at -5.6%
TOWNSHOUSES
Al Reef
6.27% as at November 2018, down from Gross yields in Abu Dhabi currently stand
VILLAS/
Al Raha Gardens -5.6%
6.45% a year earlier, this is as a result of at 6.50% as at November 2018, down
Al Raha Golf Gardens -3.3%
rents declining at a faster pace than sales from 6.71% a year earlier, once again this
Saadiyat Island -5.6%
prices over this time period. is as a result of rents declining at a faster
pace than sales prices over this time Source: Knight Frank Research
Total mainstream transaction volumes in period.
the January to November 2018 period fell
by 14.9% when compared with the same
FIGURE 3 FIGURE 7
period a year earlier. The main contributor
Dubai mainstream price performance Abu Dhabi mainstream rental performance
to this decline has been due to the
slowdown in transactions in the off-plan
12-month 6-month 3-month 12-month 6-month 3-month
market, where over the same time period, % change % change % change % change % change % change
transactions fell by 35%. Whereas, the
secondary market has recorded a growth
in transaction volumes of 2.2%.
-3.1%
The decline in overall transactions had -4.1% -4.0% -4.5%
-5.3%
been particularly severe in the first three
months of the year and then again in the
-8.7%
summer months from June to September.
However since then we have seen the Note: Data to November 2018 Note: Data to November 2018
Source: Knight Frank Research, Property Monitor Source: Knight Frank Research, Property Monitor
* The Property Monitor Index methodology is based on a basket of properties where the property value is estimated using a range of sources compared to the price changes for apartments and
townhouses/villas which is based on DLD transfers which may result in the average price changes not tallying with one another.
UAE Market Review and Forecast 2019.indd 3 1/9/19 11:33 AM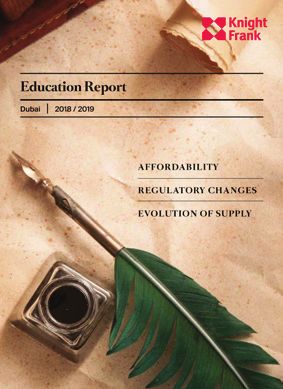
UAE MARKET REVIEW AND FORECAST 2019
Outlook for investing AED 5 million or more in the
property market or those with incomes of Commercial
Whilst the stimulus packages and easing 20,000 per month or more or those with Dubai
of business regulations are positive more than AED 1 million in capital. There
and will provide some support to the are also options to be made available for Dubai’s office market continues to see
residential markets, there is likely to be a non-retiree investors, where investors who performance softening as a result of
time delay in these resulting in increased invest over AED 5 million in property are subdued market activity which has led to
demand in the UAE’s residential sector. able obtain a five year visa. the market remaining tenant favourable.
Currently businesses are looking for In Q3 2018, we have seen limited activity
short to medium term stability before In addition to these property related visas from new corporate occupiers, with new
committing to any expansion plans. In there are a range of business investment licence issuances falling 9% year-on-year
the short run, this hesitation impacts visas have also been approved. Investors in the year to Q2 2018 according to data
consumer confidence, which in turn who invest over AED 10 million in from Dubai Statistics Centre. The primary
impacts residential market activity in both enterprise can obtain a 10-year visa, source of activity has come from firms
the sales and rental markets. Therefore, where up to 40% of the investment looking to consolidate their commercial
until the expected increase in business can be related to property purchases. real estate portfolios or occupiers looking
confidence feeds through to consumer Entrepreneurs in the UAE with previous to downsize. On a positive note, these
confidence, we are likely to see continued business investments worth over AED market conditions do provide opportunity
pressure on real estate prices and rents. 500,000 or those with a business which for occupiers looking to take advantage
is accredited by a business incubator will of softer market conditions and as a result
In Abu Dhabi, at the start of 2018, Knight be able to obtain a 5-year visa with the of this activity, landlords who actively
Frank estimated that total 8,121 units possibility of obtaining the aforementioned manage their assets have fared better.
would be delivered, however, to date initial business investor visa, should they
estimates show that only 3,346 units have eventually meet the criteria. Finally, the More so, given this subdued market
been delivered. In the capital, the lack of approved legislation also allows for a10- activity, we have seen rents soften across
demand is the single largest contributor year visa for high value talent in selected all segments of the market. Average office
to the pressure exerted on prices and fields, as well as 5-year visa for students rents across Dubai softened by 5.8%
rents, therefore until we see a notable and their families, who are studying in the year-on-year to Q3 2018, up from the
improvement in the economic backdrop, UAE. 4.3% decline witnessed in Q1 2018.
we are unlikely to see any significant
improvement in performance.
FIGURE 8
In Dubai, whilst demand had eased in
Dubai average office rents (AED/ sq ft/ p.a.)
2018, prices falls are more due to the
considerable level of supply which has
300
been delivered in 2018 and that which
is expected to be delivered in 2019. In 250
2018, Knight Frank forecast 32,727 units 200
to be completed in Dubai, initial estimates
indicate that to date we have seen 22,476 150
units delivered. This increase in supply, in 100
addition to the unabsorbed supply from
50
previous years has led to the extended
pressure on prices and rents which we 0
are witnessing, this trend is expected to
Q2 2011
Q3 2011
Q4 2011
Q1 2012
Q2 2012
Q3 2012
Q4 2012
Q1 2013
Q2 2013
Q3 2013
Q4 2013
Q1 2014
Q2 2014
Q3 2014
Q4 2014
Q1 2015
Q2 2015
Q3 2015
Q4 2015
Q1 2016
Q2 2016
Q3 2016
Q4 2016
Q1 2017
Q2 2017
Q3 2017
Q4 2017
Q1 2018
continue throughout 2019.
Whilst there are clear challenges facing Source: Knight Frank Research Prime office rents Grade A office rents Citywide office rents
the residential market, the recent approval
of a range of legislations to ease visa
and foreign business ownership by the FIGURE 9
UAE Cabinet are likely to drive addition Dubai office supply
demand to the UAE’s property market,
ESTIMATED SUPPLY, MIILION SQ M OF GLA
given that many of the changes in 12
visa regulations are linked to property
10
ownership. The new visa legislations
8
- which are expected to take effect
towards the end of Q1 2019 and where 6
all investments must be cash which is 4
not loaned - include five year retirement 2
visas for those over 55 years old, in return
0
2014 2015 2016 2017 2018 2019 2020 2021 2022
Source: Knight Frank Research Existing office supply Forecast office supply
UAE Market Review and Forecast 2019.indd 4 1/9/19 11:33 AM
UAE MARKET REVIEW AND FORECAST 2019
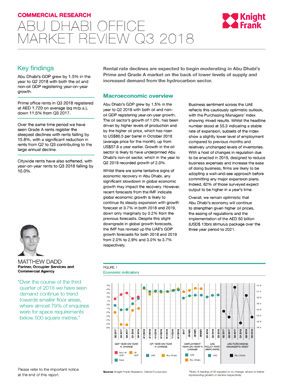
Prime office rents in Q3 2018 registered Abu Dhabi year-on-year rents to Q3 2018 falling
at AED 246 (sq ft/p.a.), down 4.9% in the by 10.0%. Grade A rents registered on
year to Q3 2018. Vacancy in core prime After a relatively strong start to the year average at AED 1,225 (sq m / p.a.) and
assets remains as low as 1%, however in Abu Dhabi’s office market, we have Citywide rents at AED 1,050 (sq m / p.a.).
as you move towards the outskirts of witnessed activity become muted once
these projects we are seeing this rate shift again over the course of Q2 and Q3 2018.
higher. As the Gate Avenue project nears Whilst there is increased activity from Outlook
completion we are likely to see the “core certain sectors in the market, there has In the short to medium term we expect
DIFC” expand and therefore this spread in been a notable slowdown in demand that market conditions in Abu Dhabi’s
vacancies fall. from the general trading and professional office sector will remain challenging with
sectors. Abu Dhabi’s fragile economic rental rates continuing to fall. However we
Grade A rents fell 8.9% in the year to Q3 backdrop is a likely contributor to this expect that the rate of decline is likely to
and now stand at AED 145 (sq ft/p.a.) on slowdown, as firms are likely to hold off start to moderate, particularly in the Prime
average. This rate is likely to continue executing many corporate decisions and Grade A segments.
to slide given a range of Grade A office until there is a clearer understanding
supply due to enter the market and and implementation of 100% foreign Knight Frank’s view is based on limited
existing vacancy. ownership laws and the outcome of levels of supply due to enter the market
proposed mergers in the banking sector. in the Grade A and Prime segments, with
Citywide office rents fell 4.9% in the
the vast majority of the 165,000 square
year to Q3 2018 to AED 123 (sq ft/p.a.), Prime office rents in Q3 2018 registered metres of additional supply expected by
however in the citywide office market at AED 1,720 on average (sq m/p.a.), 2020 being classed as Citywide stock in
we are seeing fragmented market down 11.5% from Q3 2017. Over the non-core locations.
performance continue. Single-ownership same time period we have seen Grade A
assets continue to outperform strata rents register the steepest declines with More so, a result of renewed activity in
owned stock which has underperformed, rents falling by 15.8%, with a significant the oil sector and the expected benefits
due not only to lack of quality but lack of reduction in rents from Q2 to Q3 of the AED 50bn stimulus packages as
demand for this type of space due to its contributing to the large annual decline. well as the easing of regulation, we expect
long term disadvantages as businesses Citywide rents have also softened, with demand to tick up from early 2019.
grow.
Outlook
FIGURE 10
The short to medium term outlook for
Abu Dhabi average office rents (AED/ sq m/ p.a.)
Dubai’s commercial market remains
negative with rents expected to continue
2,500
to decline across all market segments.
This trend is likely to be primarily driven
2,000
by the delivery of additional supply which
we expect to total at over 400,000 square
1,500
metres by the end of 2019. However,
the vast majority of this supply is
1,000
concentrated in the Grade A and Citywide
office market. As a result we expect that
prime market rents are likely to be less 500
impacted by the influx of new supply in
Q3 2004
Q1 2005
Q3 2005
Q1 2006
Q3 2006
Q1 2007
Q3 2007
Q1 2008
Q3 2008
Q1 2009
Q3 2009
Q1 2010
Q3 2010
Q1 2011
Q3 2011
Q1 2012
Q3 2012
Q1 2013
Q3 2013
Q1 2014
Q3 2014
Q1 2015
Q3 2015
Q1 2016
Q3 2016
Q1 2017
Q3 2017
Q1 2018
the medium term.
Whilst demand has been subdued in Source: Knight Frank Research Prime office rents Grade A office rents Citywide office rents
2018, after a strong start to the year,
we believe that due to the easing of
FIGURE 11
regulations, freezing of government
Abu Dhabi office supply
fees, economic stimulus packages, and
continued introduction of dual-licencing ESTIMATED SUPPLY, MIILION SQ M OF GLA
in Free Zones, demand is likely to tick up 4.5
over the short term to medium term from 4
3.5
both existing and new market entrants.
3
However, there will naturally be a lag 2.5
between the implementation and pick-up 2
from corporate occupiers. 1.5
1
.5
0
2008 2009 2010 2011 2012 2013 2014 2015 2016 2017 2018 2019 2020 2021 2022 2023
Source: Knight Frank Research Existing office supply Forecast office supply
UAE Market Review and Forecast 2019.indd 5 1/9/19 11:33 AM
UAE MARKET REVIEW AND FORECAST 2019
Retail Whilst the traditional retail sector
has battled back primarily through
extreme pressure over the coming five
years.
Given the weaker economic climate, participation in sales festivals as a result
In Abu Dhabi, Knight Frank estimate that
a stronger US Dollar and therefore a of the continued growth in tourism levels,
by 2022 we are likely to see the delivery
stronger Dirham (given the Dirham’s but despite this the impact of market
of over 650,000 square metres of retail
US$ peg), lower levels of consumer conditions on profitability has been clear.
space, the vast majority of which will be
confidence, the increasing impact of This in turn has impacted retail real estate
in the form of super regional or regional
e-commerce and the impact of the performance across the board. Rental
malls. Many of these new offerings will be
introduction of VAT in 2018, the UAE’s rates have witnessed double digit declines
destination and entertainment focused so
retail sector, particularly its bricks and on an annual basis on average in both
are likely to attract significant demand,
mortar retail sector is continuing to face Abu Dhabi and Dubai. Despite declining
as currently existing offerings lack this
strong headwinds. rents we are also witnessing occupancy
element, therefore these developments
rates fall, particularly in speciality retail
The impact of e-commerce on the are likely to be most adversely impacted
and community retail locations.
physical retail sector has been particularly in the long term (Figures 14 and 15).
evident over the course of 2018. Dubai’s retail market is set to change
E-commerce firms such as Noon, Souq, Outlook drastically over the next five year with over
Ounass and Nashimi have enacted Although the emergence and increasing 3.7 million square metres of retail space
a range of initiatives, aside from only utilisation of e-commerce will be of set to be delivered by 2024. If the delivery
discounting prices, to improve the range concern to operators, physical retail, of this supply come to fruition, we expect
of products offered and also delivery particularly destination and entertainment Dubai’s total retail stock to be almost 7.1
options, particularly same-day and next- focused retail developments, will continue million square metres, a 111% increase on
day delivery. The impact of e-commerce to attract demand given the extreme current levels. Retail destinations within
has not been limited to non-perishable weather conditions witnessed over developed residential communities and
goods only, with grocery giants such as summer months in the UAE. However, good transport links are least likely to be
Carrefour now offering one-hour delivery the level of incoming supply in Abu Dhabi impacted by this influx of supply (Figures
for everyday basics and same day delivery and more so Dubai is likely to mean that 12 and 13).
on their hypermarket range. operators and retailers are likely to face
FIGURE 12 FIGURE 13
Existing Dubai retail supply, by type Dubai retail supply
MILLION SQ M
3% 1% 8
Open air Community
7
centre mall
6
5
95%
4
Mall
3
2
1% 1
Special
0
purpose
1994
1995
1996
1997
1998
1999
2000
2001
2002
2003
2004
2005
2006
2007
2008
2009
2010
2011
2012
2013
2014
2015
2016
2017
2018
2019
2020
2021
2022
2023
Source: Knight Frank Research Source: Knight Frank Research Existing retail supply Upcoming retail supply
FIGURE 14 FIGURE 15
Existing Abu Dhabi retail supply, by type Abu Dhabi retail supply
MILLION SQ M
2% 3
Strip mall
2.5
2
97%
Mall 1.5
1
1% .5
Souk type
0
1992
1999
2000
2001
2007
2009
2010
2011
2012
2013
2014
2015
2016
2017
2018
2019
2020
2021
2022
Source: Knight Frank Research Source: Knight Frank Research Existing retail supply Upcoming retail supply
UAE Market Review and Forecast 2019.indd 6 1/9/19 11:33 AM
UAE MARKET REVIEW AND FORECAST 2019

        Hospitality                                           choosing to explore franchise agreements
                                                              as a means to drive profitability. In
        Market performance has continued to                   some instances we have even seen
        deteriorate in the UAE’s hospitality sector           operators willing to convert management
        with occupancy falling by 2.0%, ADR by                agreements to franchise agreements
        5.8% and RevPAR by 7.7% in the year to                regardless of contractual obligations if the
        date to November 2018, compared to the                necessary prerequisites are met.
        same period a year earlier.                           Outlook
        This is despite, visitation to the UAE                Looking ahead, we anticipate that the
        continuing to increase, but in light                  changing nature of room night demand           “Whilst there are clear
        of a more cash-constrained guest
        profile, hotels have had to price more
                                                              and sustained development pipeline              challenges facing the
                                                              will result in RevPAR levels weakening
        competitively in order to maintain market                                                             market, a trend we expect
                                                              over 2019. We anticipate that this
        share. This indicates that weaker KPIs are            RevPAR decline will continue to be
                                                                                                              to continue in 2019, the
        not related to occupancy issues but due               attributable to a falling ADR rather than       recent approval of a range
        to the changing nature of source markets              declining occupancy levels. Nonetheless         of legislations to ease
        visiting the UAE.                                     development opportunities still exist in        visa and foreign business
        From an operational perspective, in a                 certain micro markets, but these tend to        ownership by the UAE
        market of softening performance, we are               be in secondary areas rather than in the        Cabinet are likely to drive
        seeing an increasing number of hotel                  more established areas of Dubai (Figure         addition demand in the
                                                              16).
        owners scrutinise operators more critically                                                           UAE’s property market.
        than ever, and this has most often come in
                                                                                                              Looking ahead we expect
        the form of operational reviews, enforced
        headcount reduction, or even termination.
                                                                                                              that the prime segments
                                                                                                              of the market are likely to
        Over the past year we have seen                                                                       continue to outperform the
        developers increasingly moving away from
                                                                                                              mainstream market overall.”
        traditional management contracts, instead

                                                                                                             TAIMUR KHAN
         FIGURE 16                                                                                           Research Manager
         UAE Hospitality Key Performance Indicators, Year to date, Nov 2018 vs Nov 2017

                                                                     Room         Room
                                    OCC      ADR     RevPAR                                    Room Sold
                                                                    Revenue     Availability

           United Arab
                                     -2%     -5.8%    -7.7%          -2.8%         5.3%          3.2%
            Emirates

            Abu Dhabi                0%      -4.6%    -4.6%          -0.3%         4.5%          4.5%

               Dubai               -2.5%     -6.4%    -8.7%          -3.1%         6.2%          3.6%

               Ras
                                   -3.4%     -0.3%    -3.7%           1.0%         4.8%          1.3%
           Al-Khaimah

              Sharjah              -4.0%     -2.5%    -6.4%          -7.5%         -1.2%         -5.2%

             Fujairah              -3.6%     0.1%     -3.5%           0.1%         3.7%          -0.1%

         Source: Knight Frank Research

UAE Market Review and Forecast 2019.indd 7                                                                                                  1/9/19 11:33 AM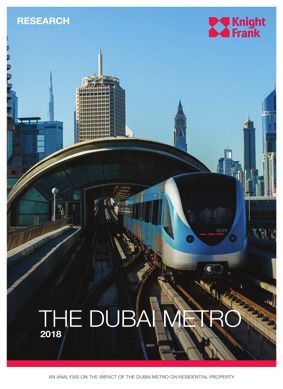
RESEARCH
Taimur Khan
Research Manager
+971 56 4202 312
taimur.khan@knightfrank.com
COMMERCIAL LEASING & AGENCY
Matthew Dadd, MRICS
Partner
+971 56 6146 087
matthew.dadd@me.knightfrank.com
MIDDLE EAST RESIDENTIAL
Maria Morris
Partner
+971 56 4542 983
maria.morris@me.knightfrank.com
DEVELOPMENT CONSULTANCY &
RESEARCH
Harmen De Jong
Partner
+971 56 1766 588
harmen.dejong@me.knightfrank.com
HOSPITALITY & LEISURE
RECENT MARKET-LEADING RESEARCH PUBLICATIONS Ali Manzoor
Partner
+971 56 4202 314
ali.manzoor@me.knightfrank.com
VALUATION & ADVISORY SERVICES
Stephen Flanagan, MRICS
Partner
+971 50 8133 402
stephen.flanagan@me.knightfrank.com
CAPITAL MARKETS / INVESTMENT
Joseph Morris, MRICS
Partner
+971 50 5036 351
Abu Dhabi Office Dubai Office Dubai Metro UAE Hospitality Market joseph.morris@me.knightfrank.com
Market Review Q3 2018 Market Review Q3 2018 2018 Review & Forecast 2018
MEDIA & MARKETING
Nicola Milton
Head of Middle East Marketing
+971 56 6116 368
nicola.milton@me.knightfrank.com
UAE Residential Market Dubai Education Report The Hub Report The Wealth Report City
Review Q1 2018 2018 2018 Series: Dubai Edition
Important Notice
© Knight Frank LLP 2017 - This report is published for
general information only and not to be relied upon in any way.
Although high standards have been used in the preparation
of the information, analysis, views and projections presented
in this report, no responsibility or liability whatsoever can
be accepted by Knight Frank LLP for any loss or damage
resultant from any use of, reliance on or reference to the
contents of this document. As a general report, this material
does not necessarily represent the view of Knight Frank LLP
in relation to particular properties or projects. Reproduction
(Y)our Space The Wealth Report ME The Wealth Report Our Services
of this report in whole or in part is not allowed without prior
Autumn Update 2018 2018 written approval of Knight Frank LLP to the form and content
within which it appears.
Knight Frank Research Reports are available at KnightFrank.com/Research
Knight Frank UAE Limited (Dubai Branch) Prime Star
International Real Estate Brokers (PSIREB RERA ORN:
11964 trading as Knight Frank with registration number
653414. Our registered office is: 5th Floor, Building 2, Emaar
Regional offices in: Business Park, PO Box 487207, Dubai, UAE.
Botswana • Kenya • Malawi • Nigeria • Rwanda • Saudi Arabia • South Africa Knight Frank UAE Limited (Abu Dhabi Branch) is a foreign
branch, with registration number 1189910. Our registered
Tanzania • UAE • Uganda • Zambia • Zimbabwe office is Unit 103, West Tower, Abu Dhabi Trade Center, Abu
Dhabi, PO Box 105374, Abu Dhabi, UAE.
UAE Market Review and Forecast 2019.indd 8 1/9/19 11:33 AM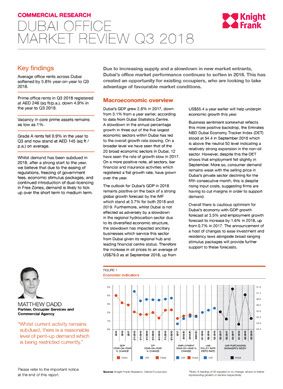
You can also read