LONDON RESIDENTIAL REVIEW - RESIDENTIAL RESEARCH SPRING 2019 - Knight Frank
←
→
Page content transcription
If your browser does not render page correctly, please read the page content below
RESIDENTIAL RESEARCH

               LONDON
               RESIDENTIAL
               REVIEW
               SPRING 2019

                                                OUTPERFORMANCE VERSUS
PENT-UP DEMAND BUILDS    ASKING PRICES ADJUST
                                                  OTHER ASSET CLASSES
LONDON RESIDENTIAL REVIEW SPRING 2019 RESIDENTIAL RESEARCH
PRIME LONDON SALES MARKET INSIGHT
KEY FINDINGS
The prime London property market is in a stronger position than
it appears to be on the surface
4.9 The influence of political uncertainty on the barometer began the year with a reading of
The ratio of new demand versus prime London property market grew markedly 35% in January but had fallen to 17% by
new supply in PCL in Q4 2018, the over the course of 2018. December. Similarly, the Deloitte CFO survey
highest figure in four years fell from a net reading of +1 in Q2 to -30 in Q3
In the first half of the year there were signs
the market was beginning to rally as asking 2018.
prices adjusted more fully to reflect higher
5% transaction costs.
However, there are underlying signs that pent-
up demand and the conditions for a recovery
The rise in the number of new
Sales volumes in PCL were 7% higher in the in the prime London residential market are
prospective buyers during 2018 in
year to March than the previous 12-month building.
PCL and POL
period, LonRes data showed. However by
While the number of exchanges declined over
December, with Brexit uncertainty persisting
2018, the number of new prospective buyers
ahead of the UK’s planned departure from the
15% EU in March 2019, volumes were down by
registering rose by 5%.
The year-on-year decline in 15% year-on-year. Indeed, the ratio of new demand to new
transaction volumes in 2018 in PCL supply rose to 4.9 in the final quarter of 2018,
Pricing behaved in a similar way. While the
the highest level in four years.
annual decline recorded in PCL in January
was 0.7%, by December the decrease Meanwhile, the average number of days
4.4% had widened to 4.4%. between listing and a property going under
The annual price decline in PCL in offer fell 2% in 2018 compared to the
Identifying individual factors affecting the
December 2018 previous year as more appropriately-priced
performance of the prime London property
market can be a complex task but the impact properties went under offer more quickly.
of political uncertainty was decisive during While it is unknown when the current level of
2018.
political uncertainty will recede, the conditions
Indeed, economic sentiment indicators for a recovery in the prime London property
displayed a similar trend. The Lloyds business market appear to be taking shape.
FIGURE 1
New demand rises in relation to new supply Ratio of new prospective buyers/new listings in PCL
5
4
3
2
1
0
Q1-2017
Q2-2017
Q3-2017
Q4-2017
Q1-2018
Q2-2018
Q3-2018
Q4-2018
Source: Knight Frank Research
FIGURE 2
TOM BILL Sentiment dips in H2 2018 Annualised % change in sales volumes compared to business sentiment
Head of London
Sales volumes in PCL and POL Business confidence
Residential Research
10% 35%
“Identifying individual factors 5%
30%
0%
affecting the performance of -5% 25%
the prime London property -10%
20%
market can be a complex -15%
-20% 15%
task but the impact of political
Jan-18
Feb-18
Mar-18
Apr-18
May-18
Jun-18
Jul-18
Aug-18
Sep-18
Oct-18
Nov-18
Dec-18
uncertainty was decisive
during 2018.”
Source: Knight Frank Research / Lloyds Bank Business Barometer
Please refer to the important notice at the end of this report
2
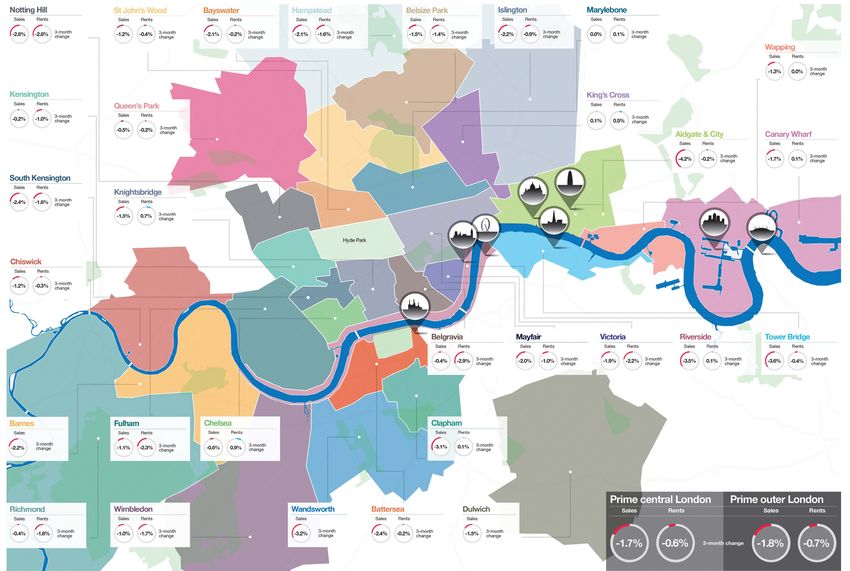
PRIME LONDON PRICE AND RENTAL GROWTH, DECEMBER 2018   DECEMBER 2018

3                                                                 4
LONDON RESIDENTIAL REVIEW SPRING 2019 RESIDENTIAL RESEARCH
PRIME LONDON LETTINGS MARKET INSIGHT
KEY FINDINGS Rising rental values and declining sales values means yields have
risen across prime London
1.1%
Annual rental value growth in
December in PCL Annual rental value growth turned positive in landlords as a result of the ban will lead to
PCL last year due to declining levels of stock. higher rents.
The supply of rental properties has been There has also been speculation the
3.35% curbed by a series of tax changes as government may introduce minimum three-
Average gross PCL yield in December, landlords attempt to leave the sector. year tenancy periods, which could have a
the highest in more than six years similarly dissuasive effect on landlords who
The number of new lettings listings in prime
central and prime outer London was 13% may not want an effective lock-up period on
lower in 2018 compared to 2017, Rightmove their investment.
3.5% data shows. Meanwhile, the overall number of Despite this succession of legislative changes,
Average gross yield in POL in listings declined by 21%. the combination of strengthening rental
December, the highest in almost four values and declining sales values means that
As a result of falling supply, annual rental value
years investment yields have risen in recent months.
growth of 1.1% was recorded in prime central
London in December, while the decline in An average gross yield of 3.35% in prime
prime outer London moderated to -0.2% from central London in December was the highest
a figure of -4% at the start of the year. figure in almost seven years. Meanwhile, a
Future legislative changes are likely to gross yield of 3.5% in prime outer London
exacerbate this trend. was the highest in almost four years.
The tenant fee ban, which comes into effect Indeed, total returns in PCL outperformed
in June this year, may further dissuade a range of other asset classes in 2018.
landlords from entering the sector or for A decline of 1.2% was relatively modest
current landlords it may mean that letting compared to a 8.7% decline in the FTSE 100
their property becomes a less cost-effective total return index, or a 14% decline in the S&P
exercise. Additionally, there is also the GSCI world commodity index and a 70%+ fall
possibility that any extra costs absorbed by in the value of Bitcoin.
FIGURE 3 FIGURE 4
PCL rented property compared to other asset classes The number of lettings listings declines
Percentage change in 2018 Annualised % change
PCL FTSE 100 (total return)
New listings (PCL and POL) All listings (PCL and POL)
Gold Commodities
Global equity indices (S&P GSCI, total return)
25%
(MSCI mid and large cap total return) Bitcoin
20%
0% 15%
-10% 10%
-20% 5%
0%
-30%
-5%
-40%
-10%
-50%
-15%
-60%
-20%
-70% -25%
Feb-17
Apr-17
Jun-17
Aug-17
Oct-17
Dec-17
Feb-18
Apr-18
Jun-18
Aug-18
Oct-18
Dec-18
-80%
Source: Knight Frank Research Source: Knight Frank Research / Rightmove
5
LONDON RESIDENTIAL REVIEW SPRING 2019
RESIDENTIAL RESEARCH
MACROVIEW THE RISK OF A DISORDERLY BREXIT
Tom Bill
Head of London
While political divisions have deepened scrutiny as the government attempts to find Residential Research
in recent months, the central risk for the a deal that can be backed by a majority of +44 20 7861 1492
property market and the UK economy has Conservative MPs. tom.bill@knightfrank.com
remained the same – a disorderly exit from
It should also be noted, however, that
the European Union.
Parliamentarians have also increased their
As we discuss on page 2, the uncertain efforts to prevent a so-called “no-deal
political backdrop has had a discernible Brexit”, which saw sterling strengthen
impact on activity and pricing in prime in early January. Should a “no deal” exit PLEASE GET IN TOUCH
London property markets since the summer. become a remote scenario, this is likely to If you are looking to buy, sell or would
Following the large-scale rejection of Theresa underpin trading activity. just like some property advice, we
would love to hear from you.
May’s Brexit deal by UK lawmakers, there Indeed, the overall impact on prime London
have been a series of cross-party initiatives on
property markets in the first half of the Noel Flint
the next steps. Combined with the fact that Head of London Sales
year will depend on how long it takes the
no majority has so far materialised on how +44 020 7861 5020
government to achieve consensus, thereby
to or whether to achieve Brexit, it means UK noel.flint@knightfrank.com
avoiding the need for a more prolonged
politics has become highly unpredictable.
process that could introduce the uncertainty
Rarely has it been more difficult to second- of a second referendum. If you are a landlord or a tenant and
guess the short-term trajectory of the market. would like some help or information,
While the political backdrop remains volatile,
At the same time, rarely has it been easier to we would love to hear from you
record high levels of employment underline
identify such a dominant reason for market’s
current behaviour. the resilience of the UK economy. Tim Hyatt
Head of Lettings
As the rhetoric rises, it appears the UK Interest rates are also likely to remain low
+44 20 7861 5044
government believes amending its current due to the political uncertainty and falling tim.hyatt@knightfrank.com
proposal is the best way to achieve a inflation, which should help liquidity.
consensus. Furthermore, predictions for how many
finance jobs would leave London as a result Knight Frank Residential Research provides
The presence of the Irish backstop in
strategic advice, consultancy services and
the withdrawal agreement remains the of Brexit have been systematically revised forecasting to a wide range of clients worldwide
most politically sensitive topic for many downwards to levels that will be more than including developers, investors, funding
Parliamentarians, who believe it is likely to compensated for by the arrival of new organisations, corporate institutions and the public
sector. All our clients recognise the need for expert
give the EU excessive leverage in future employees in the tech sector, underpinning independent advice customised to their specific
trade talks. As such, it will be the key focus of future demand for prime London property. needs.
RESIDENTIAL RESEARCH RESIDENTIAL RESEARCH
PRIME LONDON PRIME LONDON
SALES INDEX LETTINGS INDEX
This report analyses the performance of single-unit rental properties in the second-hand prime central and prime outer London
DECEMBER 2018 The prime London sales indices are based on repeat valuations of second-hand stock and do not
include new-build property, although units from completed developments are included over time. DECEMBER 2018 markets between £250 and £5,000+/ week. For an analysis of the build-to-rent market and the institutional private rented sector in
London and the rest of the UK, please see our Private Rented Sector Update http://www.knightfrank.co.uk/research
PRIME CENTRAL LONDON PRIME CENTRAL LONDON
| 5,680.9 | -4.4% | -1.7% | -0.5% Prime central London index | 164.5 Annual rental value change | 1.1% Quarterly rental value change | -0.6%
Prime central London index Annual change Quarterly change Monthly change
PRIME OUTER LONDON PRIME OUTER LONDON
| 270.9 | -4.8% | -1.8% | -0.6% Prime outer London index | 170.6 Annual rental value change | -0.2% Quarterly rental value change | -0.7%
Prime outer London index Annual change Quarterly change Monthly change
Figure 1 New demand for prime central
London property continues to rise in
relation to new supply. The number of new
FIGURE 1
Demand rises in relation to supply in PCL
Ratio of new prospective buyers/new sales listings,
rolling three-month average
FIGURE 2
Pent-up demand forms across PCL and POL
Rolling 12-month average, rebased to 100 at Jan 2017
Figure 1 Average gross yields in prime
central London have risen over the course
of 2018 as a result of rising rents and
downwards pressure on prices. A yield of
FIGURE 1
Rental value growth pushes PCL yields higher
FIGURE 2
Yields rise in POL as rental value declines
moderate
Important Notice
© Knight Frank LLP 2019 – This report is
New prospective buyers 3.35 3.6
prospective buyers per new listing has risen London sales volumes (LonRes) 3.35% in December was the highest since
in the second half of this year, which may 3.5
4.8 110 April 2012 and compares to the yield on a 3.3
put upwards pressure on pricing once the 3.4
4.6 105 10-year UK government bond of less than
current political uncertainty recedes. 3.3
4.4 100 1.3% in early December. 3.25
3.2
Figure 2 Although sales volumes have 4.2 95
3.2
Figure 2 There has been similar upwards
published for general information only and
3.1
declined over the course of 2018, the 4.0 90
pressure on yields in prime outer London as
number of new prospective buyers has 3.8
85 3.15 3.0
rental value declines bottom out. An average
Apr-15
Aug-15
Dec-15
Apr-16
Aug-16
Dec-16
Apr-17
Aug-17
Dec-17
Apr-18
Aug-18
Dec-18
risen in recent months and was 8% higher
Feb-17
Apr-17
Jun-17
Aug-17
Oct-17
Dec-17
Feb-18
Apr-18
Jun-18
Aug-18
Oct-18
Dec-18
80
3.6 gross yield of 3.5% in December was the
in November compared to January 2017. 75
highest recorded since March 2015.
Jan-18
Feb-18
Mar-18
Apr-18
May-18
Jun-18
Jul-18
Aug-18
Sep-18
Oct-18
Nov-18
This divergence suggests pent-up demand
Jan-17
Mar-17
May-17
Jul-17
Sep-17
Nov-17
Jan-18
Mar-18
May-18
Jul-18
Sep-18
Nov-18
is forming. Source: Knight Frank Research Source: Knight Frank Research
not to be relied upon in any way. Although
Source: Knight Frank Research Source: Knight Frank Research / LonRes
FIGURE 3 FIGURE 4
FIGURE 3 FIGURE 4 Figure 3 Lettings activity across prime
Figure 3 As asking prices increasingly London markets has been relatively resilient
Tenant demand remains resilient across Lower supply keeps upwards pressure on rents
Price adjustments lead to more offers The £20 million-plus market strengthens Annualised % change
reflect higher transaction costs, prospective Number of offers made per office, rebased to 100 despite the uncertain political backdrop.
London
in London % change November 2018 vs November 2017
buyers are submitting offers in greater at November 2014 Rolling 12-month average The number of new tenancies agreed in New Listings in PCL New Listings in POL
numbers. In November this year, the
high standards have been used in the
November was 12.3% higher than the same 15%
Value of £20m+ sales 25%
number of offers made per office exceeded 105
Volume of £20m+ sales month last year while the number of new 20%
12%
the figure recorded in the same month four prospective tenants was 2% higher. 15%
100 £100m 3.5 10%
years ago, ahead of a hike to stamp duty for 9%
3.0 5%
£80m
£1million-plus properties. 95
2.5 Figure 4 Falling supply continues to put 0%
6%
£60m -5%
90 2.0 upwards pressure on rental values as
Figure 4 Asking prices for £20 million-plus 1.5 landlords attempt to sell following recent tax
3% -10%
preparation of the information, analysis, views
£40m
85 -15%
properties in prime central London adjusted 1.0
changes. Despite a recent reversal of this 0 -20%
£20m
more quickly to higher transaction costs. 0.5
trend as some owners failed to achieve their
New
Applicants
Tenancies
Agreed
Tenancies
Commenced
Sep-16
Nov-16
Jan-17
Mar-17
May-17
Jul-17
Sep-17
Nov-17
Jan-18
Mar-18
May-18
Jul-18
Sep-18
Nov-18
80
£0 0.0
Combined with the recent weakness of asking price, there were 12% fewer new
Nov-14
Nov-15
Nov-16
Nov-17
Nov-18
Jan-18
Feb-18
Mar-18
Apr-18
May-18
Jun-18
Jul-18
Aug-18
Sep-18
Oct-18
Nov-18
sterling, this has driven rising activity in listings in the year to November than the
the £20 million-plus London market in the previous 12-month period in PCL. Source: Knight Frank Research Source: Knight Frank Research / Rightmove
Source: Knight Frank Research Source: Knight Frank Research
second half of this year.
and projections presented in this report, no
The Wealth Report Prime London Sales Index Prime London Rentals Index UK Residential Market responsibility or liability whatsoever can be
December 2018 December 2018 Forecast 2018
accepted by Knight Frank LLP for any loss or
damage resultant from any use of, reliance on
or reference to the contents of this document.
As a general report, this material does not
MAYFAIR MARKET INSIGHT 2018 RICHMOND LETTINGS MARKET INSIGHT 2018 BAYSWATER LETTINGS MARKET INSIGHT 2018
necessarily represent the view of Knight Frank
FIGURE 1 Achieved property prices in Mayfair
Achieved prices, two years to August 2018
Circles can denote multiple sales in the same postcode, in which case the highest value is displayed
FIGURE 1 Asking rents in Richmond and surrounding area
Monthly asking rents, 12 months to August 2018
Circles can denote multiple listings in the same postcode, in which case the highest value is displayed
FIGURE 1 Achieved rental values in Bayswater and surrounding area
Achieved weekly rental values, 12 months to August 2018
Circles can denote multiple transactions in the same postcode, in which case the highest value is displayed
Up to £500
LLP in relation to particular properties or
projects. Reproduction of this report in whole
Up to £2.5m FIGURE 2 Up to £1,735 FIGURE 2 FIGURE 2
£2.5 to £5m Mayfair fact sheet £1,735 to £2,600 Richmond fact sheet £500 to £750 Bayswater fact sheet
Tottenham Court Road
£5m to £10m £2,600 to £4,335 £750 to £1,00
Population: 15,649 Population: 260,270 Population: 27,135
£10m to £20m Oxford Street £4,335 to £6,500 £1,000 to £2,000
Number of sales Kew Gardens
£20m+ Bond Street £6,500+ Kew £2,000+ NUMBER OF LISTINGS
Gardens
NUMBER OF LISTINGS
£2 MILLION-PLUS Year to August 2018 12,098 Year to August 2018 1,085
Year to May 2018 148
Reg
Year to August 2017 1,295
or in part is not allowed without prior written
Soho Richmond Year to August 2017 13,774
ent
Year to May 2017 111 Year to August 2016 14,711 Year to August 2016 1,168
Stre
Grosvenor Leicester Year to May 2016 118
et
Square Square
St Margarets AVERAGE MONTHLY ASKING RENT AVERAGE WEEKLY RENTAL VALUES
Berkeley £5M MILLION-PLUS Richmond Year to August 2018 £1,690 Ed Year to August 2018 £635
Paddington Basin
t Street Square gw
Pa
Year to May 2018 65 Park
Moun Charing Cross Year to August 2017 £1,740 are Year to August 2017 £607
rk
Richmond Park
Paddington
Lan
Year to May 2017 49 Porchester Ro Year to August 2016 £608
Year to August 2016 £1,810 ad
e
St James’s Year to May 2016 57 Square
approval of Knight Frank LLP to the form
Square
n Street MAXIMUM MONTHLY ASKING RENT MAXIMUM WEEKLY RENTAL VALUES
Curzo Source: Knight Frank Research / LonRes / Land Registry
Year to August 2018 £37,485 Year to August 2018 £3,500
Queensw
Gloucester
Leinster
Year to August 2017 £30,335 Square Connaught Year to August 2017 £10,000
Glo
Square
BLUE PLAQUES Year to August 2016 £6,000
uc
Porche
Green Park Year to August 2016 £28,165
es
ay
Gardens
ter
Jimi Hendrix, Guitarist Source: Knight Frank Research / Rightmove Source: Knight Frank Research / LonRes
Te
ster
rra
St James's Park Lord Nelson, Naval Officer
ce
Terrac
Buckingham Florence Nightingale, Nursing Reformer BLUE PLAQUES BLUE PLAQUES
and content within which it appears. Knight
Hyde Park Palace Lancaster Gate
Corner Frederic Chopin, Composer Virginia Woolf, author Lady Violet Bonham Carter, Politician, Writer
e
Hyde Park
Sir Isaac Newton, Natural Philosopher Sir Christopher Wren, architect Lord Randolph Churchill, Politician
JMW Turner, painter Sir Giles Gilbert Scott, Architect
Sir Noel Coward, playwright Marie Taglioni, Ballet dancer
Source: Knight Frank Research / LonRes
STOCK BY PROPERTY TYPE STOCK BY PROPERTY TYPE
Source: Knight Frank Research / LonRes / Land Registry Source: Knight Frank Research / Rightmove
Frank LLP is a limited liability partnership
STOCK BY PROPERTY TYPE
Bayswater lettings market update John Humphris, Bayswater lettings head
Flat 44% Flat 93%
Mayfair market update Simon Burgoyne, Mayfair Office Head Flat 93% Richmond Lettings Market Update Debbie Pinkham, Richmond Lettings Head The number of lettings listings in “Average rental values in prime central London
Terraced 28%
Average prices for existing Mayfair homes “With high-quality new-build schemes sitting The number of listings in Richmond “Supply and demand in the Richmond lettings Bayswater declined 10% year-on-year are rising on an annual basis after a 28-month
Semi-detached 20% Terraced 7%
increased 0.5% in the year to August, alongside existing homes, the choice for buyers Semi-detached 7% declined 12% year-on-year in August, market is changing, with a number of landlords in August 2018, reflecting a broader period of declines. However, we are still
Detached 6%
compared to a decline of 2.3% across in Mayfair has widened notably in recent years. as figure 2 shows, underlining how opting to sell due to recent tax changes. This pattern in prime central London for lower seeing modest declines in Bayswater, a fact
AGE OF HOUSING STOCK
Semi-detached < 1%
Bungalow 2% levels of supply. More landlords have which underlines how rents in the area need
prime central London. Prices in the area For the second-hand market, there is a risk more landlords are attempting to sell has reduced the number of available rental
registered in England with registered number
have outperformed the PCL average due that asking prices are set at a similar level to 47% their property due to a recent series of properties which is underpinning rental values. explored a sale due to a recent series of to reflect good value because of historically AGE OF HOUSING STOCK
Pre-1900 AGE OF HOUSING STOCK
to the arrival of high-quality new-build new-build developments, however vendors tax changes. A number of owners have That said, there are still a number of ‘accidental’ tax changes. As a result of falling supply, weaker demand compared to the other
Pre-1900 18% annual rental values are strengthening markets around the perimter of Hyde Park. Pre-1900 45%
developments and improvements to increasingly appreciate that direct comparisons 1900-1939 13% also listed their property for sale and landlords in the market who have attempted to
public areas by the Grosvenor Estate are not possible with schemes that include to let at the same time in case pricing sell but were unable to achieve their asking price across prime central London. Rental However, properties that are specified and
1900-1939 37% 1900-1939 13%
and the Crown Estate, which have amenities like a 24-hour concierge service, expectations are not met in either market. and will sell when market conditions become values in Bayswater declined 0.4% in furnished to a sufficiently high standard are
1945-1972 11%
underpinned demand across the whole parking spaces or a gym. In overall terms, the £10 Rental values have been broadly flat over more favourable. Many families relocating to the year to August, which compared to more likely to attract tenants to Bayswater. 1945-1972 23%
OC305934. Our registered office is 55 Baker
1945-1972 20%
market. The rise in transaction levels million-plus market in prime central London has the last 12 months. Meanwhile, activity London from overseas still choose to live in declines of more than 5% recorded at This fact favours institutional landlords like
1973-1999 10% 8%
the start of 2017. Meanwhile, activity has the Church Commissioners. Its properties 1973-1999
for homes priced above £2 million and now absorbed higher rates of stamp duty and as levels remain stable, with the number of Richmond due to the area’s high-quality schools. 1973-1999 16%
£5 million over the last three years also buyers sense price declines may be bottoming tenancies agreed in south-west London However, corporate housing allowances are increased and the number of tenancies generally have lower void periods than the
2000-present 19% 2000-present 10%
2000-present 9% agreed by Knight Frank in Bayswater market average in Bayswater and rental values
reflects higher levels of activity at those out, we have noticed activity strengthening in rising by 3% year-on-year in August, lower than they were a couple of years ago so Source: Knight Frank Research
Source: Knight Frank Research Source: Knight Frank Research rose 17% year-on-year in August. for its properties are still robust.”
price points in the new-build market. higher price-brackets.” Knight Frank data shows. landlords need to set prices competitively.”
Street, London, W1U 8AN, where you may
Prime Country Index Mayfair and St James’s Richmond lettings Bayswater lettings
Market Insight 2018 Market Insight 2018 Market Insight 2018
look at a list of members’ names.
6You can also read


