Key Regional UK Markets - christie.com - Christie & Co
←
→
Page content transcription
If your browser does not render page correctly, please read the page content below
Key Regional UK Markets

christie.com
UK Hotel Market Overview
                               The United Kingdom is the 10th most internationally visited destination in the
                               world, according to the UNWTO, with over 266m international overnights in 2018.
                               Domestic visitation is also very strong with British travellers accounting for over
                               122m overnights in 2018, a 2.8% increase on the previous year.

                               The UK market has seen strong results in hotel performance and visitation,
                               despite political and socio-economic challenges. The UK has recorded year-on-
                               year RevPAR growth since 2010, supported by a positive economic background
                               and a global increase in travel. Whilst London remains a key driver of UK tourism,
                               capturing a large proportion of overall visitation, Regional UK markets have
                               significantly gained popularity with both tourists and investors. In the past five
                               years RevPAR growth in Regional UK has surpassed London, with a 2.4% 5-year
                               CAGR, albeit with significant variances across markets.

                               However, new supply has started to impact performance in some markets and
                               the number of hotel rooms in the pipeline shows that the trend will continue
                               in the foreseeable future, although this varies considerably by market. Other
                               challenges such as National Living Wage increases, business rates revaluation and
                               recruitment and retention difficulties have had some impact on profitability levels.

                               The Regional UK market still presents opportunities for investors, developers
                               and operators but it is necessary to understand the fundamentals and drivers of
                               each individual market to accurately assess investment prospects. This report
                               looks at the six largest regional cities by number of overnight stays and outlines
                               each market dynamic by analysing the distinct context of demand, supply,
                               performance and transactional trends.

                               We hope that you enjoy reading this report and that you will consider our
                               advice when assessing your future investment decisions.

                                               Carine Bonnejean                               Olivia Chaplin
                                               Managing Director Hotels                       Director Hotels Consultancy
                                               T: +44 20 7227 0714                            T: +44 20 7227 0740
                                               M: +44 7921 063 548                            M: +44 7592 775 311
                                               E: carine.bonnejean@christie.com               E: olivia.chaplin@christie.com

christie.com | February 2020                                                                                                   2
UK Market Ranking
                                                                                                                                             Understanding the dynamics of each individual market in Regional UK is
                                                                                                                                             key in identifying the right opportunities. We have analysed the drivers of
                                                                                                                                             18 Regional UK markets based on the below metrics:

                                                                                                                                             Overnights stays

                                                                                                                                             The metric captures the size of the demand in each market combining
                                                                                                                                             both international and national stays in the city. We consider this to be a
                                                                                                                                             key factor when determining the fundamentals of a market and we have
                                                                                                                                             selected the top 6 markets to be analysed in detail in this report based on
                                                                                                                                             this indicator of demand levels.

                                                                                                                                             Room supply

                                                                                                                                             Markets with large room supply indicate the maturity of the market
                                                                                                                                             and expected local competition. Supply additions have been a factor
                                                                                                                                             of concern for investors in markets such as Manchester, Liverpool and
                                                                                                                                             Glasgow. However, a larger market can also indicate opportunities for
                                                                                                                                             international brands. to convert existing stock and for investors to benefit
                                                                                                                                             of higher liquidity.

                                                                                                                                             OTR ratio

                                                                                                                                             Analyses the relationship between overnight stays and the available
    1                                                                           18                                                           supply in the market. Whilst some markets, such as Plymouth, present
                                                                                                                                             low levels of overnight stays we identify that the supply is well-adjusted
    Each key market has been ranked relative to each other as follows:
                                                                                                                                             to the level of supply and therefore benefits of a very strong OTR ratio.
    Overnight Stays: 1 being the market with the most overnight stays and 18 with the least, in 2018 which is the latest available data      Markets such as Manchester, with the lowest OTR ratio amongst the
                                                                                                                                             analysed markets, might indicate the first signs of oversupply.
    Room Supply: 1 being the market with the most supply and 18 with the least, in 2019

    OTR Ratio: 1 being the market with the highest ratio and 18 with the lowest
                                                                                                                                             Room Pipeline
    UK Competitiveness Index: 1 being the market with the highest index and 18 with the lowest, in 2018 which is the latest available data
                                                                                                                                             The metric presents the current pipeline under construction and in final
    Room Pipeline: 1 being the market with the highest room pipeline as a percentage of its current supply and 18 with the lowest            planning stages relative to the current existing room supply. In markets
    UK Competitiveness Index: captures the future development of the market assessed from an economic and social perspective. The
                                                                                                                                             that currently have a low OTR ratio, further additions to the inventory
    metric captures the markets that are outlined as having strong economic outlook and therefore provide strong fundamentals for hotels     might lead to oversupply, unless demand levels are to pick up. However,
    going forward.                                                                                                                           in markets with stock concentrated in certain classes, such as Liverpool,
                                                                                                                                             additional room stock in the right segment might respond to local
    1
        Overnight To Room ratio is the quotient between overnight stays and hotel room supply.
    2
        The UK Competitiveness Index is prepared by the universities of Cardiff and Nottingham. It has been designed to be an integrated     demand and bring balance and diversity of offering in the market.
        measure of competitiveness focusing on both the development and sustainability of businesses and the economic welfare of
        individuals.

christie.com | February 2020                                                                                                                                                                                                3
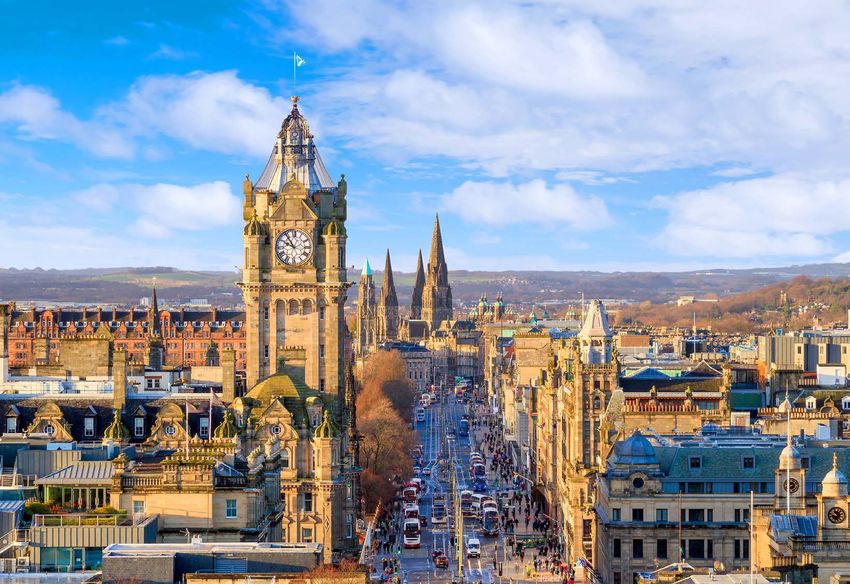
Edinburgh

                                                                                                                                       Edinburgh is the most visited UK destination
                    KEY INFORMATION                                               DEMAND TRENDS
                                                                                                                                       after London

                                                                        2019 REVPAR SEASONALITY                                                                                 Leisure                            4%
             518,500                         3.8%
             Population                Unemployment                                                                                                                                                          13%
                                                                                                                                                    Visiting Friends and Relatives (VFR)

                                                                                                                                                                              Business          25%
             £26.56bn                       113.1
             Edinburgh GDP (2018)     Competitiveness                                                                                                                           Others
             +5.6%/2017                         Index

   MAIN COMPANIES                   MAJOR EVENTS
   • University of Edinburgh        • UK ICCA ranking: 2nd
   • Lloyds Banking Group           • Fringe Festival
   • Royal Bank of Scotland         • Edinburgh International                                                                                                                                     58%
   • Standard Life                    Festival
   • Scottish Widows                • Edinburgh International
                                                                            Jan      Feb       Mar      Apr      May     Jun     Jul    Aug   Sep    Oct    Nov    Dec
                                      Book Festival
                                    • Edinburgh Art Festival

                                                                        TOTAL ANNUAL OVERNIGHTS
   DEMAND                           DEVELOPMENT
   GENERATORS                       PROJECTS                                                                                                                                    International
   • Edinburgh International        • St James Scheme                                                                                                                                                 63%
                                                                                                                                                                                   Domestic
     Conference Centre              • Meadowbank Stadium
   • National Museum                                                                                                                                  16.9m
                                    • The India Quay                                                                      13.4m
   • Edinburgh Castle                 Development                                      13.3m
   • Scottish National Gallery      • Waverley Train Station
                                                                                        2012                              2015                          2018
   • St Giles’ Cathedral            • HS2                                                                                                                                                                   37%

                                                                         Overnights increased by a CAGR of 4.1% between 2012 and 2018

christie.com | February 2020                                    Sources: ONS, STR, Christie & Co Research and Analysis                                                                                              5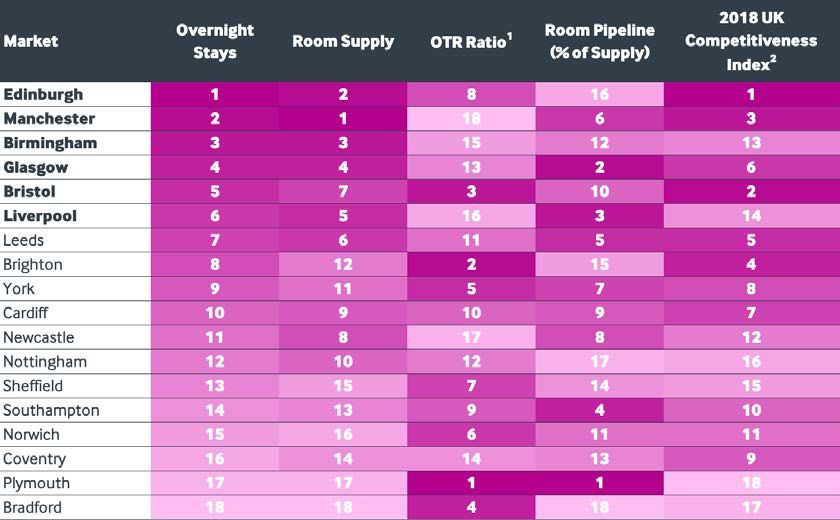
Edinburgh
CHRISTIE & CO’S
COMMENTS
12,887 13,849 15,324 16,275 +3.4% +17.0%
Supply
Room
CAGR Active pipeline
2012 2015 2018 2019 as percentage of
current supply*
Edinburgh, the gateway to Scotland, has experienced an increasing
appeal for several years, mostly driven by international visitors. The
busy conference and festival calendar, historic buildings and financial
institutions make the city a popular destination for both business and
leisure visitors.
Supply
+1.2% +13.4%
Hotel
220 229 235 239 Active pipeline
As a result, the market has attracted many investors leading to a 26%
increase in supply since 2012, comprising mostly branded budget hotels
2012 2015 2018 2019 CAGR
as percentage of and aparthotels.
current supply* Despite continuous supply additions, demand levels remain strong, with
* Pipeline includes hotels in “Under Construction” and “Final Planning” phases Edinburgh recording occupancy levels above 80% for the past five years.
After double-digit RevPAR growth in 2017, 2018 growth was flat and 2019
performance shows a slight decrease as competition intensifies adding
Luxury Midscale pressure on ADR and occupancy levels.
After a record transaction year in 2018 when several UK portfolios
Upper Upscale Economy transacted, the market has seen a slow down in 2019 due to lack of
ROOM SUPPLY available stock as well as some economic uncertainty.
BREAKDOWN Upscale Hostel The market is expecting moderate supply increase given the current
pipeline and given the strong fundamentals, performance is expected to
Upper Midscale remain positive and investor appetite strong.
SELECTED FUTURE OPENINGS SELECTED LATEST TRANSACTIONS
Hotel Opening Date Rooms Class Hotel Date Rooms Price (£m)
Premier Inn Edinburgh City Centre BHS Store May-2020 133 Economy Travelodge Haymarket Aug-2019 73 9.5
Voco Edinburgh Haymarket Jul-2020 150 Upscale Hilton Edinburgh Grosvenor Jun-2019 184 17.5
Premier Inn Haymarket 2 Aug-2020 196 Economy Travelodge Edinburgh Central Apr-2019 43 7.7
Roomzzz Edinburgh Aug-2020 73 Upper Midscale Princes Street Suites Mar-2019 37 15.1
Moxy Edinburgh Fountainbridge Sept-2020 262 Upper Midscale Atlas Hotel Jan-2019 101 Undisclosed
Sources: Real Capital Analytics www.rcanalytics.com, STR, AM:PM Hotels, Christie & Co Research and Analysis
christie.com | February 2020 Republication or other re-use of this data without the express written permission of STR is strictly prohibited. 6Manchester
KEY INFORMATION DEMAND TRENDS Manchester is the economic powerhouse of the North
2019 REVPAR SEASONALITY Leisure
547,600 4.7%
Population Unemployment 7%
Visiting Friends and Relatives (VFR)
26%
Business
£24.53bn 105.7
Manchester GDP (2018) Competitiveness
Index Others
+3.4%/2017
32%
MAIN COMPANIES MAJOR EVENTS
• Co-Operative Group • UK ICCA ranking: 4th
• BBC • Park Life Festival
• Google • Chinese New Year
35%
• John Lewis Partnership Plc • Manchester Day
• Manchester Airport Group Plc • Manchester Pride Jan Feb Mar Apr May Jun Jul Aug Sep Oct Nov Dec
TOTAL ANNUAL OVERNIGHTS
DEMAND DEVELOPMENT International
GENERATORS PROJECTS
• Manchester Central • Manchester Airport Domestic 59%
Convention Complex • North Campus University
• Manchester Arena of Manchester 12.5m
12.9m
• The Lowry Museum • NOMA, RedFern 10.2m
• Media City UK redevelopment
2012 2015 2018
• Old Trafford and Emirates • Manchester Mayfield 41%
Stadiums • HS2 (Piccadilly Station)
Tourism overnights increased by a CAGR of 3.5% between 2012 and 2018
christie.com | February 2020 Sources: ONS, STR, Christie & Co Research and Analysis 8Manchester
CHRISTIE & CO’S
COMMENTS
14,884 15,947 18,298 18,475 +3.1% +33.7%
Supply
Room
CAGR Active pipeline
2012 2015 2018 2019 as percentage of
current supply* Manchester is the third most popular UK destination after London
and Edinburgh by number of overnight stays. Seasonality is
mitigated by the many conferences, events, retail and sport events
attracting leisure and corporate visitors all year round.
Supply
Since 2014 Manchester has recorded a significant amount of new
+1.6% +24.1%
Hotel
149 155 164 166 Active pipeline
supply and is now the largest market outside London (by room
2012 2015 2018 2019 CAGR count). Despite continuous supply additions, performance levels
as percentage of saw moderate growth in RevPAR between 2013 and 2018. There
current supply* was some minimal short-term impact as a result of the June 2017
* Pipeline includes hotels in “Under Construction” and “Final Planning” phases terrorist attacks but the market proved to be very resilient. In
2019, RevPAR performance decreased by 5%, mostly ADR driven,
Luxury Midscale as competition in the market intensifies with new hotels gaining
market share.
Upper Upscale Economy 2019 was a record year for transactions in Manchester, being
ROOM SUPPLY the largest Regional UK market in terms of transactional volume,
BREAKDOWN Upscale Hostel as several large single assets exchanged hands. Appetite from
investors remains strong albeit with the background of hotel
performance creating some concerns as supply additions are
Upper Midscale creating increasing pressure.
SELECTED FUTURE OPENINGS SELECTED LATEST TRANSACTIONS
Hotel Opening Date Rooms Class Hotel Date Rooms Price (£m)
Leonardo Hotel Manchester Sep-2020 275 Upscale DoubleTree by Hilton Manchester Dec-2019 285 37.8
Malmaison Manchester Mar-2021 70 Upper Upscale Holiday Inn Manchester City Centre Oct-2019 297 70
Maldron Hotel Manchester Jun-2021 278 Upscale Clayton Hotel May-2019 329 62.5
Moxy Manchester Aug-2021 145 Upper Midscale Circle Square Hotel Feb-2019 158 45
Motel One Manchester St Peter’s Square Sep-2021 330 Midscale Hallmark Leyland Hotel Feb-2019 93 Portfolio
Sources: Real Capital Analytics www.rcanalytics.com, STR, AM:PM Hotels, Christie & Co Research and Analysis
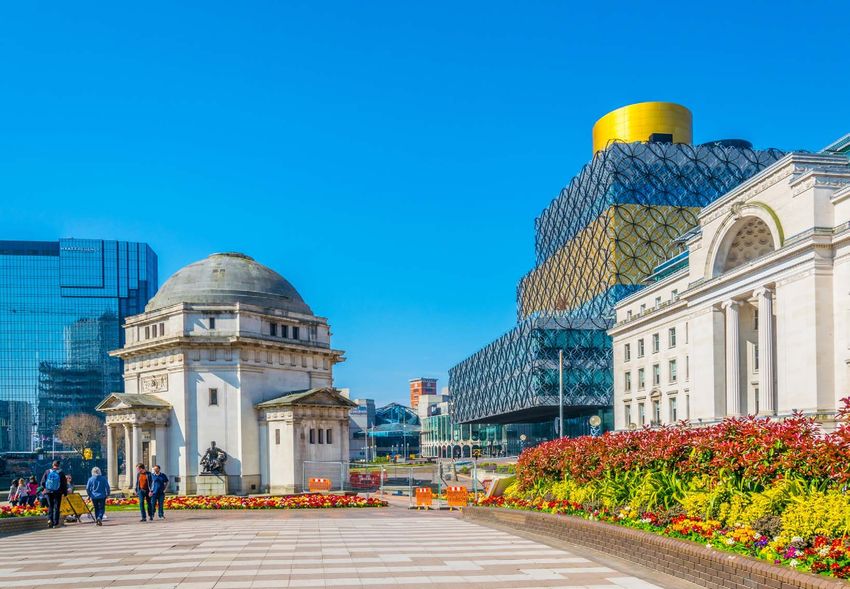
christie.com | February 2020 Republication or other re-use of this data without the express written permission of STR is strictly prohibited. 9Birmingham
KEY INFORMATION DEMAND TRENDS Balanced demand with limited seasonality
2019 REVPAR SEASONALITY Leisure 3%
1,141,400 7.2%
Population Unemployment
Visiting Friends and Relatives (VFR)
41%
Business
£31.90bn 92.5
Birmingham GDP (2018) Competitiveness Others
+6.0%/2017 Index
MAIN COMPANIES MAJOR EVENTS 34%
• National Express Group Plc • UK ICCA ranking: 8th
• J Sainsbury Plc • MADE Festival
• Lloyds Bank Plc • Conservative Party
• Kraft (Cadbury & Trebor) Conference (Biennial) 22%
• Asda • Magical Lantern Festival
Jan Feb Mar Apr May Jun Jul Aug Sep Oct Nov Dec
• Flatpack Festival
TOTAL ANNUAL OVERNIGHTS
DEMAND DEVELOPMENT
GENERATORS PROJECTS International
56%
• NEC • Paradise Square Domestic
• ICC • Smithfield Development
• Jewellery Quarter • The Big City Plan 11.2m 10.9m
• Edgbaston Cricket Ground • Eastside Locks 9.4m
• University of Birmingham • HS2 2012 2015 2018
44%
Tourism overnights increased by a CAGR of 2.4% between 2012 and 2018
christie.com | February 2020 Sources: ONS, STR, Christie & Co Research and Analysis 11Birmingham
CHRISTIE & CO’S
COMMENTS
+1.9% +21.8%
Supply
Room
12,670 13,255 14,394 14,410 CAGR Active pipeline
2012 2015 2018 2019 as percentage of
current supply* Birmingham is a popular conference destination due to its great
connectivity by road, rail and air. Demand growth since 2012 has been
driven by international visitors whereas domestic demand remained
relatively flat.
Currently, hotels in the Upper Midscale class and below account for
+0.1% +16.9%
Supply
approximately 60% of the supply. After limited growth in 2014 and
Hotel
135 129 135 136 CAGR Active pipeline
2015, supply increased by 8.7% between 2015 and 2019. The size of the
pipeline is relatively moderate compared to the other main UK cities and is
2012 2015 2018 2019 as percentage of composed of Upper Midscale and Upscale hotel rooms.
current supply*
The market records occupancy levels that are constantly above 70%
* Pipeline includes hotels in “Under Construction” and “Final Planning” phases
paired with a discounted ADR, in line with markets that rely on negotiated
rates driven by business demand. Whilst the ADR levels are some of the
Luxury Midscale lowest from the six cities analysed, it also presents the least year-on-year
fluctuations, proof of a stable market with strong demand.
Upper Upscale Economy In terms of transactions, the market recorded its lowest volume since 2013,
ROOM SUPPLY with the majority of transactional evidence being made of portfolio sales.
However, there have been a number of development sites transacting in
BREAKDOWN Upscale Hostel the market indicating strong hotel development interest.
The outlook for Birmingham is positive, with demand expected to be driven
Upper Midscale
by the nearby city of Coventry being City of Culture 2021 and the city
hosting the Commonwealth Games in 2022.
SELECTED FUTURE OPENINGS SELECTED LATEST TRANSACTIONS
Hotel Opening Date Rooms Class Hotel Date Rooms Price (£m)
Moxy Birmingham NEC Jan-2020 224 Upper Midscale Holiday Inn Birmingham Airport Aug-2019 241 33.0
aloft Eastside Locks Apr-2020 195 Upscale Hallmark Birmingham City Feb-2019 135 Portfolio
Unscripted Central Hall Dec-2020 147 Upper Upscale Hilton Garden Inn Birmingham
Sep-2018 178 31.0
Airport
Bloc Hotel Grand Central Sept-2021 238 Economy
The Grand Jul-2018 180 Portfolio
NYX Hotel By Leonardo Hotels Sept-2021 261 Upper Midscale
Crowne Plaza Birmingham NEC Apr-2018 242 Portfolio
Sources: Real Capital Analytics www.rcanalytics.com, STR, AM:PM Hotels, Christie & Co Research and Analysis
christie.com | February 2020 Republication or other re-use of this data without the express written permission of STR is strictly prohibited. 12Glasgow
KEY INFORMATION DEMAND TRENDS Growing popularity of Scotland’s largest city
2019 REVPAR SEASONALITY Leisure
626,400 5.5% 4%
Population Unemployment
Visiting Friends and Relatives (VFR)
20%
Business
£22.51bn 92.5
Glasgow GDP (2018) Competitiveness 27%
Index Others
+3.9%/2017
MAIN COMPANIES MAJOR EVENTS
• Barclays Wealth • UK ICCA ranking: 3rd
• Morgan Stanley • Glasgow Film Festival
• JP Morgan • World Curling Championship
49%
• Clydesdale Bank • UEFA Euro 2020
• Scottish Power • UCI Cycling World Jan Feb Mar Apr May Jun Jul Aug Sep Oct Nov Dec
Championships (2023)
TOTAL ANNUAL OVERNIGHTS
DEMAND DEVELOPMENT
GENERATORS PROJECTS International
• SSE Hydro Arena • Glasgow Harbour 59%
Domestic
• Scottish Exhibition & Confer- Scheme (phased)
ence Centre (SECC) • Clyde Waterfront & West 8.3m
7.3m
• (IFSD) International Financial End Innovation (2025) 6.8m
Services District • Airport Development
2012 2015 2018
• Queen Elizabeth University • HS2 41%
Hospital
Tourism overnights increased by a CAGR of 3.1% between 2012 and 2018
christie.com | February 2020 Sources: ONS, STR, Christie & Co Research and Analysis 14Glasgow
CHRISTIE & CO’S
COMMENTS
9,348 10,580 10,741 +2.8% +46.9%
Supply
Room
8,852 CAGR Active pipeline
2012 2015 2018 2019 as percentage of
current supply* Glasgow’s international overnights surpassed domestic visitation for the first
time in 2017. A strong North American marketing campaign to increase
visitors from across the ocean has proven to be effective, with American
visitors increasing by approximately 40% in 2017. Glasgow is becoming a
strong tourist destination promoting a diverse events offering throughout
the year as well as benefiting from strong commercial activity and a
Supply
+1.3% +27.7%
Hotel
119 119 128 130 Active pipeline
developing corporate environment.
2012 2015 2018 2019 CAGR After several years of limited supply growth, an impressive 1,000 new rooms
as percentage of opened in 2018. With the second largest pipelines relative to current supply
current supply* (c. 4,900 rooms) in the UK, KPIs and profitability will be put under pressure.
* Pipeline includes hotels in “Under Construction” and “Final Planning” phases Following five years of strong growth and a record ADR level in 2018,
2019 saw an 8.8% decrease in RevPAR as supply additions impacted both
occupancy and ADR.
Luxury Midscale
After a record transactional volume in 2018 when several large assets
transacted as part of portfolios, 2019 returned to more normal levels with
Upper Upscale Economy transaction volume being led by single assets.
ROOM SUPPLY
Glasgow remains one of the main tourism destinations in the UK. However,
BREAKDOWN Upscale Hostel new supply has started to impact performance negatively and is expected to
continue until the market absorbs the newly-opened hotels and the coming
pipeline.
Upper Midscale
SELECTED FUTURE OPENINGS SELECTED LATEST TRANSACTIONS
Hotel Opening Date Rooms Class Hotel Date Rooms Price (£m)
Yotel Glasgow Apr-2020 257 Economy Erskine Bridge Hotel Feb-2020 177 5.2
Clayton Hotel Sep-2020 294 Upscale AC Marriott George Square Dec-2019 245 19.3
Moxy Glasgow Sep-2020 243 Upper Midscale Best Western City Hotel Oct-2019 52 Undisclosed
TRIBE Clyde Street Sep-2020 290 Midscale The Maldron Glasgow Jul-2019 300 39.7
The Maldron Glasgow May-2021 300 Upscale Travelodge Glasgow Govan Mar-2019 60 5.2
Sources: Real Capital Analytics www.rcanalytics.com, STR, AM:PM Hotels, Christie & Co Research and Analysis
christie.com | February 2020 Republication or other re-use of this data without the express written permission of STR is strictly prohibited. 15Bristol
KEY INFORMATION DEMAND TRENDS Increasingly attractive market for tourists
2019 REVPAR SEASONALITY Leisure
3%
463,300 3.8%
Population Unemployment
Visiting Friends and Relatives (VFR) 21%
Business
£15.95bn 106.0
Bristol GDP (2018) Competitiveness Others
-1.4%/2017 Index
46%
MAIN COMPANIES MAJOR EVENTS
• ALD Automotive • UK ICCA ranking: 9th
• Airbus • Bristol International Balloon
• Hargreaves Lansdown Fiesta
30%
(Financial Services) • UpFest (Urban Paint
• Rolls-Royce Festival)
Jan Feb Mar Apr May Jun Jul Aug Sep Oct Nov Dec
• Computershare (IT) • Bristol Jazz and Blues
Festival
TOTAL ANNUAL OVERNIGHTS
DEMAND DEVELOPMENT
GENERATORS PROJECTS International
54%
• University of Bristol • YTL Arena Bristol Domestic
• Bristol Museum and Art Gallery • Temple Quay North
• The Bristol Hippodrome • Temple Quarter 7.5m
6.8m
• Bristol Cathedral Enterprise Zone 5.5m
• Ashton Gate Stadium • Temple Island
2012 2015 2018
• Redcliff Quarter 46%
Tourism overnights increased by a CAGR of 5.3% between 2012 and 2018
christie.com | February 2020 Sources: ONS, STR, Christie & Co Research and Analysis 17Bristol
CHRISTIE & CO’S
COMMENTS
+1.9% +25.4%
Supply
Room
5,749 5,744 6,564 6,564 CAGR Active pipeline
2012 2015 2018 2019 as percentage of
current supply* Since 2015, international overnights have outweighed domestic visitation
capitalising on the international exposure driven by the Rugby World Cup
taking place in Cardiff. The Universities also play a key role in driving tourist
demand as families and friends visit its students.
Supply decreased between 2012 and 2015 when small independent
Supply
+0.0% +23.4% properties closed amid increased competition. Since then, the inventory has
Hotel
79 74 79 79 Active pipeline
been replaced by new, branded properties. Half of the pipeline is made up of
2012 2015 2018 2019 CAGR Upper Midscale hotels such as Moxy.
as percentage of
After double-digit RevPAR growth in 2014 and 2015, the market has been
current supply*
relatively unstable with no clear growth trajectory. After a decrease in
* Pipeline includes hotels in “Under Construction” and “Final Planning” phases RevPAR in 2018, 2019 performance was back on an upward trend, finishing
the year 1.6% above 2018 RevPAR levels.
Luxury Midscale 2015 was a record year for Bristol transactions as a large number of
properties transacted as part of distressed portfolios. 2018 represented
another peak of activity led by portfolio sales, followed by a slow 2019, as
Upper Upscale Economy
only two assets transacted in the market. It is worth noting that international
ROOM SUPPLY investment has intensified in the market with interest from Asian investors
BREAKDOWN Upscale Hostel and continental Europe.
The outlook for Bristol is positive, supported by growing popularity from
Upper Midscale domestic and international visitors and a reasonable pipeline. Furthermore,
Bristol is the largest UK city without an arena-style venue. Once completed
in 2023, it is expected to drive significant levels of demand.
SELECTED FUTURE OPENINGS SELECTED LATEST TRANSACTIONS
Hotel Opening Date Rooms Class Hotel Date Rooms Price (£m)
Travelodge Bristol Severnside Nov-2020 81 Economy Travelodge Central Park Dec-2019 81 8.5
Jurys Inn Bristol Nov-2020 200 Upper Midscale Hilton Garden Inn Bristol Dec-2019 167 24.1
Cribbs Lodge Hotel Jan-2021 123 Upper Midscale De Vere Tortworth Court Oct-2018 201 20.6
Moxy Bristol Downtown Feb-2021 220 Upper Midscale Premier Inn Bristol South Oct-2018 89 3.6
Clayton Hotel Bristol Mar-2021 255 Upscale DoubleTree by Hilton Bristol North Jul-2018 201 10.9
Sources: Real Capital Analytics www.rcanalytics.com, STR, AM:PM Hotels, Christie & Co Research and Analysis
christie.com | February 2020 Republication or other re-use of this data without the express written permission of STR is strictly prohibited. 18Liverpool
KEY INFORMATION DEMAND TRENDS The UK’s largest transatlantic port
2019 REVPAR SEASONALITY Leisure
494,800 3.9% 7%
Population Unemployment Visiting Friends and Relatives (VFR) 17%
Business
£14.85bn 90.5
Liverpool GDP (2018) Competitiveness Others 28%
+4.2%/2017 Index
MAIN COMPANIES MAJOR EVENTS
• Shop Direct Ltd • UK ICCA ranking: 6th
• Bibby Line Group Ltd • The Grand National at
• T.J. Morris Ltd Aintree 48%
• Matalan Retail Ltd • Liverpool Biennial Festival
of Contemporary Art
• BPS Development Ltd Jan Feb Mar Apr May Jun Jul Aug Sep Oct Nov Dec
• Liverpool’s Dream Giants
TOTAL ANNUAL OVERNIGHTS
DEMAND DEVELOPMENT
GENERATORS PROJECTS International 52%
• ACC Liverpool (Convention • New China Town (2019) Domestic
Centre) • Liverpool Waters (2025)
• Liverpool Port and Cruise • Airport Development 7.2m
6.5m
Terminal (2030) 5.5m
• M&S Bank Arena • Wirral Waters
2012 2015 2018 48%
• The Beatles Story • Liverpool Triple Tower
• The Tate Liverpool • Baltic Triangle Overnights increased by a CAGR of 4.6% between 2012 and 2018
christie.com | February 2020 Sources: ONS, STR, Christie & Co Research and Analysis 20Liverpool
CHRISTIE & CO’S
COMMENTS
+3.4% +44.9%
Supply
Room
7,717 8,600 9,525 9,734 CAGR Active pipeline
2012 2015 2018 2019 as percentage of
current supply* Historically a leisure destination, business visitation in Liverpool has
increased in recent years driven by the opening of the ACC in 2008 and the
Exhibition Centre in 2015. The city benefits from a number of attractions
and events that have led to growth in domestic and international overnights.
The city has seen substantial additions to supply in the past five years
Supply
+2.7% +41.4% as regeneration schemes across the city created opportunities for new
Hotel
109 116 127 131 Active pipeline
entrants in the market. Almost 600 rooms were opened in 2018 alone as
2012 2015 2018 2019 CAGR new concepts replace the outdated supply.
as percentage of
Both occupancy and ADR have been on an upward trend since 2013
current supply*
resulting in Liverpool climbing from the 13th highest RevPAR in the UK in
* Pipeline includes hotels in “Under Construction” and “Final Planning” phases 2013 to 5th in 2018. 2019 showed a slight decrease, albeit on the back of a
7% RevPAR growth in 2018.
Luxury Midscale 2018 was a record year for transactions in Liverpool predominately driven by
portfolio acquisitions. In comparison, 2019 was a modest year with only two
properties changing hands as part of a portfolio. However, investor interest
Upper Upscale Economy in conversions and redevelopment of existing properties remains strong.
ROOM SUPPLY
The next two years are expected to be challenging for RevPAR growth as
BREAKDOWN Upscale Hostel new supply enters the market (c. 860 and 500 rooms in 2020 and 2021
respectively) and competition within a relatively small market intensifies.
Upper Midscale
SELECTED FUTURE OPENINGS SELECTED LATEST TRANSACTIONS
Hotel Opening Date Rooms Class Hotel Date Rooms Price (£m)
Roomzzz Liverpool Mar-2020 105 Upper Midscale Hallmark Liverpool Hotel Feb-2019 41 Portfolio
Innside by Melia Liverpool July-2020 207 Upscale Hallmark Liverpool Hotel South Feb-2019 81 Portfolio
Staycity Corn Exchange Dec-2018 212 22.8
Moxy Liverpool City Centre Nov-2020 153 Upper Midscale
Travelodge Liverpool Nov-2018 105 11.1
Hilton Garden Inn July-2021 108 Upscale
Mercure St Helens Jul-2018 84 3.1
Novotel Paddington Village Aug-2021 221 Upscale
Martins Bank Jul-2018 227 47.2
Sources: Real Capital Analytics www.rcanalytics.com, STR, AM:PM Hotels, Christie & Co Research and Analysis
christie.com | February 2020 Republication or other re-use of this data without the express written permission of STR is strictly prohibited. 21Christie & Co Range of advisory and brokerage services
PLAN GROW OPTIMISE
• Understanding Challenges and Strategic Planning • Acquisition Support • Strategic Repositioning
• Market Entrance Studies and Business Plan Reviews • Acquisition Target Search and Site Identification • Identifying Performance Improvements
• Industry Analysis and Market Intelligence Studies • Buyer Due Diligence and Pricing Advice • Independent Business Reviews
• Development Advice and Feasibility Studies • KPI Development and Benchmarking
• Rent and Contract Advice
• Operator Search & Selection
EVALUATE EXIT
• Owner and Operator Advice • Achieving a Successful Exit at the Best Possible Price
• Fully RICS “Red Book” and IVSC Compliant Valuations • Vendor Due Dilligence
• Rent Review Negotiation • Marketing, Sales and PR Strategy
• Expert Witness and Litigation Support • Route-to-value Planning
• Identifying Market Trends & Value Curves
• Strategic Disposals
christie.com | February 2020Christie & Co
85
Years of Experience
Business built around you
We are the leading valuers,
consultants and brokers
across Europe in our 29
specialist sectors European Offices
120
15 offices Sector Specialists
across the UK
&
14 international offices
across Europe today 450
Valuations per Year
550+
Current Hotel Sale Instructions
christie.com | February 2020 23christie.com
You can also read