Commercial Real Estate Trends & Outlook - April 2020 National Association of REALTORS Research Group - National ...

Page created by Sam Nguyen
 
CONTINUE READING
Commercial Real Estate Trends & Outlook - April 2020 National Association of REALTORS Research Group - National ...
Commercial Real Estate
Trends & Outlook
April 2020
National Association of REALTORS®
Research Group
Commercial Real Estate Trends & Outlook - April 2020 National Association of REALTORS Research Group - National ...
COMMERCIAL REAL ESTATE TRENDS & OUTLOOK
April 2020 Report

  The Commercial Real Estate Trends & Outlook Report discusses trends in the small
  commercial market (transactions that are typically less than $2.5 million) based on a survey of
  members of the National Association of Realtors® engaged in commercial real estate about
  their transactions in the first quarter of 2020 and the latest publicly available data.

  Current conditions. This latest report shows the very early impact of the coronavirus
  pandemic on commercial real estate. On average, respondents reported a 1% decline in their
  commercial sales volume during the first quarter of 2020 compared to transactions in the
  same period last year. On average, respondents reported a 2% decline in the dollar volume of
  new leases compared to the level one year ago.

  Across the multifamily, industrial, office, retail, and hotel sectors, a lower fraction of
  respondents reported higher sales transactions and new lease volume on an annual basis in
  the first quarter of 2020 compared to the fraction of respondents who reported an increase in
  sales and leasing activity in the prior quarter.

  Respondents reported that commercial prices rose at a slower pace of 1% from one year ago.
  Other price indicators show prices are softening. The Green Street Property Price Index which
  is compiled from high quality properties in REITs portfolios fell slightly by less than half a
  percent in 2020 Q1 from the prior quarter.

  Respondents reported higher vacancy rates for office, 10.5%; retail, 10.1%; and multifamily, 5%.
  Vacancy rates in industrial properties were flat at 5%.

  A lower fraction of respondents reported an improvement in access to financing: 57% reported
  an improvement in debt financing conditions compared to one year ago, and 53% reported an
  improvement in equity financing conditions.

  Economic outlook. We expect the second quarter GDP growth to be the steepest decline in
  the U.S. history – likely in excess of 15% contraction on an annualized basis. What will be critical
  is the recovery in the second half of the year. Is it going to be sharp and quick rebound of a V-
  shaped or a sluggish recovery of staying low for a period before a recovery of a U-shaped?
  That will depend on the economy’s response to the stimulus measures and the path of virus
  containment. The best guess is for the second half GDP growth to be insufficient to
  compensate for the loss in the second quarter. Therefore, we expect GDP to have contracted
  around 3% to 5% for the year as a whole and net job losses totaling around 3 to 5 million.
Commercial Real Estate Trends & Outlook - April 2020 National Association of REALTORS Research Group - National ...
COMMERCIAL REAL ESTATE TRENDS & OUTLOOK
April 2020 Report

  1 | Economic Conditions.……………………………………………………………………………………………..   4

  2 |Commercial Sales……………………………………………………………………………………………………..     5

  3 | Commercial Leasing ………………………………………….………………………………………………….    8

  4 | Commercial Construction …………………………………………………………………………………..   10

  5 | Commercial Outlook……………………………………………………………………………………………..     11

  6 |Business Trends…..……………………………………………………………………………………………….….    14

  7 | About the Survey……………………….…………………………………………………………………………      17
Commercial Real Estate Trends & Outlook - April 2020 National Association of REALTORS Research Group - National ...
1 | ECONOMIC CONDITIONS
   Fewer Jobs, Declining Wages in March 2020                                                                                                                                    Nonfarm Payroll Jobs Lost in
   In March 2020, 701,000 non-farm employment                                                                                                                                          March 2020
                                                                                                                                                                 -459                                                                         Leisure and Hospitality
   jobs were lost in all industries (2-digit level) except                                                                                                                                   -76                                              Education and Health
   in the utilities, wholesale trade, information, and                                                                                                                                         -52                                            Professional and Business Services
   the government sectors. Sixty-five percent of the                                                                                                                                         -46.2                                            Retail Trade
   job losses were in leisure and hospitality (-                                                                                                                                                -29                                           Construction
   459,000). Professional and business services lost                                                                                                                                             -24                                          Other Services
   52,000 jobs, and retail trade shed 46,200 jobs.                                                                                                                                                                                            Manufacturing
                                                                                                                                                                                                 -18
                                                                                                                                                                                                    -7                                        Mining and Logging Employment
   In March, the number of unemployed surged to
                                                                                                                                                                                                  -4.9                                        Transportation and Warehousing
   7.14 million, from 5.79 million in February. Since
                                                                                                                                                                                                    -1                                        Financial Activities
   the weeks of March 21 through April 4, 15.1 million
                                                                                                                                                                                                                            0.8               Utilities
   people have already filed for unemployment
                                                                                                                                                                                                                            0.9               Wholesale Trade
   insurance benefits.
                                                                                                                                                                                                                            2                 Information
                                                                                                                                                                   Source: BLS                                              12                Government
   The average weekly wage (seasonally adjusted)
   has started to decline, to $978.8 in March 2020
   from $980.7 in February 2020.

   In an effort to bolster economic activity, the
                                                                                                                                                                             Number of Unemployed as of
   Federal Open Market Committee reduced the                                                                                                                                   March 2020 (in millions)
   federal funds rate to 0% on March 15 and
                                                                                                                                                                  20.0
   announced an open-ended commitment to
   purchase mortgage-backed securities and                                                                                                                        15.0
   investment-grade corporate debt to keep credit
   flowing. Under an accommodating monetary                                                                                                                       10.0                                                                                                                                               7.14
   policy, the 10-year T-note has declined to 0.87% in
                                                                                                                                                                   5.0
   March 2020. On April 9, the Federal Reserve Board                                                                                                                                                                                                                                                                           5.79
   released a statement that it will provide $2.3                                                                                                                  0.0
   trillion in loans to support the flow of credit to
                                                                                                                                                                         2006-Jan
                                                                                                                                                                         2006-Oct
                                                                                                                                                                          2007-Jul
                                                                                                                                                                         2008-Apr
                                                                                                                                                                         2009-Jan
                                                                                                                                                                         2009-Oct
                                                                                                                                                                          2010-Jul
                                                                                                                                                                         2011-Apr
                                                                                                                                                                         2012-Jan
                                                                                                                                                                         2012-Oct
                                                                                                                                                                          2013-Jul
                                                                                                                                                                         2014-Apr
                                                                                                                                                                         2015-Jan
                                                                                                                                                                         2015-Oct
                                                                                                                                                                          2016-Jul
                                                                                                                                                                         2017-Apr
                                                                                                                                                                         2018-Jan
                                                                                                                                                                         2018-Oct
                                                                                                                                                                          2019-Jul
   households, businesses, and the state and local
   governments.

                  10-Year Treasury Note Yield at                                                                                                                                          Average Weekly Wages,
                       Constant Maturity                                                                                                                         $1,000.0
                                                                                                                                                                                           Seasonally Adjusted
3.50                                                                                                                                                                                                                                                                                                              $980.7
                                                                                                                                                                  $980.0                                                                                                                                             $978.8
3.00
                                                                                                                                                                  $960.0
2.50
2.00                                                                                                                                                              $940.0
1.50                                                                                                                                                              $920.0
1.00                                                                                                                                                    0.87      $900.0
0.50
                                                                                                                                                                  $880.0
0.00
                                                                                                                                                                                                                                   Nov/2018

                                                                                                                                                                                                                                                                                                     Nov/2019
                                                                                                                                                                                                  May/2018
                                                                                                                                                                                                             Jul/2018

                                                                                                                                                                                                                                                                    May/2019
                                                                                                                                                                                                                                                                               Jul/2019
                                                                                                                                                                            Jan/2018
                                                                                                                                                                                       Mar/2018

                                                                                                                                                                                                                        Sep/2018

                                                                                                                                                                                                                                              Jan/2019
                                                                                                                                                                                                                                                         Mar/2019

                                                                                                                                                                                                                                                                                          Sep/2019

                                                                                                                                                                                                                                                                                                                Jan/2020
                                                                                                                                                                                                                                                                                                                           Mar/2020
                                                              Nov/2018

                                                                                                                                Nov/2019
                             May/2018
                                        Jul/2018

                                                                                               May/2019
                                                                                                          Jul/2019
       Jan/2018
                  Mar/2018

                                                   Sep/2018

                                                                         Jan/2019
                                                                                    Mar/2019

                                                                                                                     Sep/2019

                                                                                                                                           Jan/2020
                                                                                                                                                      Mar/2020

 NATIONAL ASSOCIATION of REALTORS® | RESEARCH GROUP | www.nar.realtor/research-and-statistics                                                                                                                                                                                                                                         4
2 | COMMERCIAL SALES
Commercial Sales Declined 1% in 2020 Q1

Sales volume fell on average by 1% among                                     Quarterly Sales Volume
                                                             40%
commercial members of the National Association                                    (Y/Y % Chg)
of REALTORS® who responded to NAR’s 2020 Q1                  20%
Commercial Real Estate Quarterly Market Survey.
NAR commercial members’ transactions are                      0%                                                                           -1%
typically below $2.5 million (small commercia
market). Real Capital Analytics also reported that           -20%
during January—February 2020, sales transactions                                                                                         -35%
                                                             -40%
volume fell by 35%. RCA tracks transactions of at

                                                                                                                                         2020.Q1
                                                                     2012

                                                                             2013

                                                                                      2014

                                                                                              2015

                                                                                                       2016

                                                                                                               2017

                                                                                                                        2018

                                                                                                                                2019
least $2.5 million (middle to large commercial
market).
                                                                                       REALTOR® CRE Markets
                                                                                       $2.5+M Market
Not all respondents reported a decline, as 42% of                           Sources: National Association of REALTORS®, Real Capital Analytics
respondents reported increase in sales compared
to one year ago. However, this share is lower than
the 61% share in 2019 Q4. A higher fraction of
respondents, 18%, reported a sales decline of at                         Distribution of Y/Y Sales Change
least 20%, compared to 7% in the prior quarter.
                                                                    25%
Across all property types, a lower fraction of                      20%
respondents reported an annual gain in sales                        15%
                                                                    10%
volume in 2020 Q1 compared to the fraction of
                                                                     5%
respondents who reported an annual increase in
                                                                     0%
2019 Q4. For example, in the apartment class B/C
properties, 35% reported higher sales from one year
ago compared (44% in the prior quarter). In the
office class A market, only 15% of respondents
reported an increase in sales volume (22% in the
prior quarter). In the retail mall class A, only 6%
                                                                                          2019.Q4         2020.Q1
reported an increase (12% in the prior quarter).

                  Percent of Respondents Who Reported a Y/Y Increase in
                                   Dollar Sales Volume
        50%
        40%                       32%                                                33% 35%
                                              26%
        30%                 25%
                      22%               20%                17%                                                  14%
        20%     15%                                 12%                                               12%
                                                                    6%      7%
        10%
         0%

                                              2019 Q4     2020 Q1

 NATIONAL ASSOCIATION of REALTORS® | RESEARCH GROUP | www.nar.realtor/research-and-statistics                                                5
2 | COMMERCIAL SALES
 Commercial Prices Rose 1% in 2020 Q1
                                                                                                                                                    Y/Y Change in Commercial Sales
 While dollar sales volume fell, commercial prices                                                                                                              Prices
 rose 1% in markets where commercial members of                                                                                            15%
 the National Association of REALTORS® are                                                                                                 10%
 engaged in. These markets are typically below $2.5                                                                                         5%                                                     6.6%
 million (small commercial market).                                                                                                         0%                                                     0.8%
                                                                                                                                           -5%
 Among respondents, 56% reported an increase in
                                                                                                                                           -10%
 commercial sales prices in their markets (75% in
 the prior quarter), while 25% reported a decline (16%                                                                                     -15%
 in the prior quarter). Only 5% reported a decline in                                                                                      -20%
 prices of at least 20% (1% in the prior quarter).                                                                                         -25%

 The Green Street Commercial Price Index, which is
 an indicator for high-quality properties held by
 REITs indicates commercial property prices are                                                                                                       REALTOR® CRE Markets             $2.5M+ Market
 declining, although not collapsing. The index
 declined by 0.3% in 2020 Q1 compared to the prior
 quarter.

 Real Capital Analytics also reported that during                                                                                                   Distribution of Y/Y Commercial
 January-February 2020, commercial prices rose on                                                                                                            Price Change
 average by nearly 7%. The coronavirus pandemic
 escalated in March 2020 so the strong price growth                                                                                           30%
 does not capture the impact of the pandemic. RCA                                                                                             25%
 tracks transactions of at least $2.5 million (middle                                                                                         20%
 to large commercial market).                                                                                                                 15%
                                                                                                                                              10%
                                                                                                                                               5%
                                                                                                                                               0%

                   Green Street Commercial
                     Property Price Index
                      (August 2007=100)                                                                                                                        2019.Q4       2020.Q1
136.00
134.00
132.00
130.00
128.00
126.00
124.00
         Q1/2017
                   Q2/2017
                             Q3/2017
                                       Q4/2017
                                                 Q1/2018
                                                           Q2/2018
                                                                     Q3/2018
                                                                               Q4/2018
                                                                                         Q1/2019
                                                                                                   Q2/2019
                                                                                                             Q3/2019
                                                                                                                       Q4/2019
                                                                                                                                 Q1/2020

   NATIONAL ASSOCIATION of REALTORS® | RESEARCH GROUP | www.nar.realtor/research-and-statistics                                                                                                        6
2 | COMMERCIAL SALES
Cap Rates Trended Down to 6.5%
                                                                  Cap Rates in REALTORS® Market
Cap rates for transactions in the first quarter of
2020 reported by NAR commercial member                  10.0%        and $2.5+M Transactions
average 6.5%. The average cap rate in the large          9.0%
commercial market ($2.5 million or more                  8.0%
transactions) reported by Real Capital Analytics         7.0%
was 6.7%.                                                6.0%                                                                                                      6.5%
                                                         5.0%
In the small commercial real estate market,
Apartment Class A properties had the lowest              4.0%

                                                                                                                                  2019.Q1
                                                                                                                                            2019.Q2
                                                                                                                                                      2019.Q3
                                                                                                                                                                2019.Q4
                                                                                                                                                                          2020.Q1
                                                                  2010
                                                                         2011
                                                                                2012
                                                                                        2013
                                                                                               2014
                                                                                                      2015
                                                                                                             2016
                                                                                                                    2017
                                                                                                                           2018
cap rate, with a median of 5.4% among
respondents. Apartment Class B/C cap rates
were typically one percentage point higher, at                                                 REALTOR® CRE Markets
                                                                                               $2.5+M Market
6.5%. Cap rates for office class B/C, industrial
                                                                                                                           Sources: NAR, Real Capital
flex, free-standing retail, and senior housing
were typically around 7%.

In the $2.5M or more market tracked by Real                                 REALTORS® Commercial
Capital Analytics, apartment and office-CBD
properties had the lowest average cap rates of                                Capitalization Rates
5.4% based on January—February 2020                      11.0%
transactions. Hotel had the highest cap rate at           9.0%
nearly 9%. The lower cap rate for office-CBD              7.0%
properties indicates investor preference for the          5.0%
                                                                    2010

                                                                            2011

                                                                                       2012

                                                                                               2013

                                                                                                      2014

                                                                                                              2015

                                                                                                                      2016

                                                                                                                              2017

                                                                                                                                            2018

                                                                                                                                                      2019

                                                                                                                                                                 2020Q1
CBD market relative to the office-suburban
market where cap rates were around one
percentage points higher.
                                                                                   Office                             Industrial
                                                                                   Retail                             Multifamily
 Cap Rates in 2020 Q1
                                                                                   Hotel                              All commercial
 Apartment: Class A                           5.4
 Apartment: Class B/C                         6.5
 Industrial: Warehouse                        6.5
                                                                   Cap Rates in February 2020 for
 Industrial: Flex                             7.0
                                                                      $2.5+ Million Properties
 Office: Class A                              6.5
 Office: Class B/C                            7.0                                                                                               8.6%
                                                                           6.3%         6.6%          6.6%                    6.8%                                 6.9%
 Retail: Strip Center                         6.5               5.4%                                                5.4%
 Retail: Mall                                 6.0
 Retail: Free standing                        7.0
 Hotel/Hospitality                            6.5
 Student housing                              6.0
 Senior housing                               7.0
 Source: 2020 Q1 NAR CRE Market Survey
                                                          Source: Real Capital Analytics
 For $2.5 million or less properties

NATIONAL ASSOCIATION of REALTORS® | RESEARCH GROUP | www.nar.realtor/research-and-statistics                                                                              7
3 | COMMERCIAL LEASING
 New Lease Volume Declined 1.5%
                                                                           Y/Y Change in REALTORS®
 The dollar volume of new lease transactions in
 2020 Q1 fell on average by 1.5% compared to
                                                                          Commercial Leasing Volume
                                                           20%
 one year ago among commercial members of
 the National Association of REALTORS® who                 10%
 responded to NAR’s 2020 Q1 Commercial Real
                                                            0%
 Estate Quarterly Market Survey.
                                                                                                                                                -1.5%
                                                          -10%
 While the new volume declined overall, 41% of
 respondents reported an increase in new                  -20%
 leases, and 27% reported no change.
                                                          -30%

                                                                                                                                                 2020.Q1
                                                                   2009

                                                                          2010

                                                                                 2011

                                                                                        2012

                                                                                               2013

                                                                                                      2014

                                                                                                             2015

                                                                                                                    2016

                                                                                                                           2017

                                                                                                                                  2018

                                                                                                                                         2019
 Across all property types, a lower fraction of
 respondents reported an increase in dollar
 volume of new leases in 2020 Q1 on a year-
 over-year basis compared to the fraction of
 respondents who reported annual gains in
 2019 Q4. For example, in the apartment Class
                                                                   Distribution of Y/Y Change in New
 A market, only 35% reported an increase in                                   Lease Volume
 new leasing activity in 2020 Q1 compared to
                                                             30.0%
 44% in 2019 Q4. In the office class A market,               25.0%
 21% of respondents reported an increase in                  20.0%
 leasing activity, down from 39% in the prior                15.0%
 quarter. In the retail strip Class A, only 14%              10.0%
 reported an increase in new leasing activity on              5.0%
 a y/y basis in 2020 Q1 compared to 40% in the                0.0%
 prior quarter.

                       Percent of Respondents Who Reported a Y/Y Increase in
                                    Dollar Volume of New Leases
         60%
         50%
         40%                         30%                                                                                   33%
                                            25%    28%                                                       35%
         30%     21%     22%   24%
                                                           14%       16%
         20%                                                                                   10%
                                                                                   6%
         10%
          0%

                                              2019 Q4    2020 Q1

NATIONAL ASSOCIATION of REALTORS® | RESEARCH GROUP | www.nar.realtor/research-and-statistics                                                       8
3 | COMMERCIAL LEASING
Respondents reported higher vacancy rates
across all property markets in 2020 Q1
compared to the prior quarter. The steepest
                                                                               Vacancy Rates
increase was in the hotel sector where                    20.0%                                           18%
vacancy rates rose to nearly 18%. Far higher
                                                          15.0%
vacancy rates will occur in the upcoming                             11%               10%                        10%
months due to near travel lockdown in April.              10.0%
In the retail, office, and multifamily sectors,                                5%                 5%
                                                           5.0%
vacancy rates rose by about one percentage
point. Vacancy rates for industrial properties             0.0%
were unchanged at 5%. In these asset classes,
the overall vacancy rate rose to 10% from 7% in
the prior quarter.

In the multifamily market, the tight vacancy                                    2019.Q4        2020.Q1
rate (6.4% U.S. rental vacancy rate in 2019 Q4)
has pushed rent prices up. Nationally,
apartment rent prices rose 3.7% in 2019 Q4. As
of 2019 Q4, the median price for a 2-bedroom                      U.S. Rental Vacancy Rate and Rent
apartment was $1,067, with 28% of                                               Growth
apartments rented out for $1,500 or more.                10.0                                                           4.0%
                                                          9.0                                                    3.7%
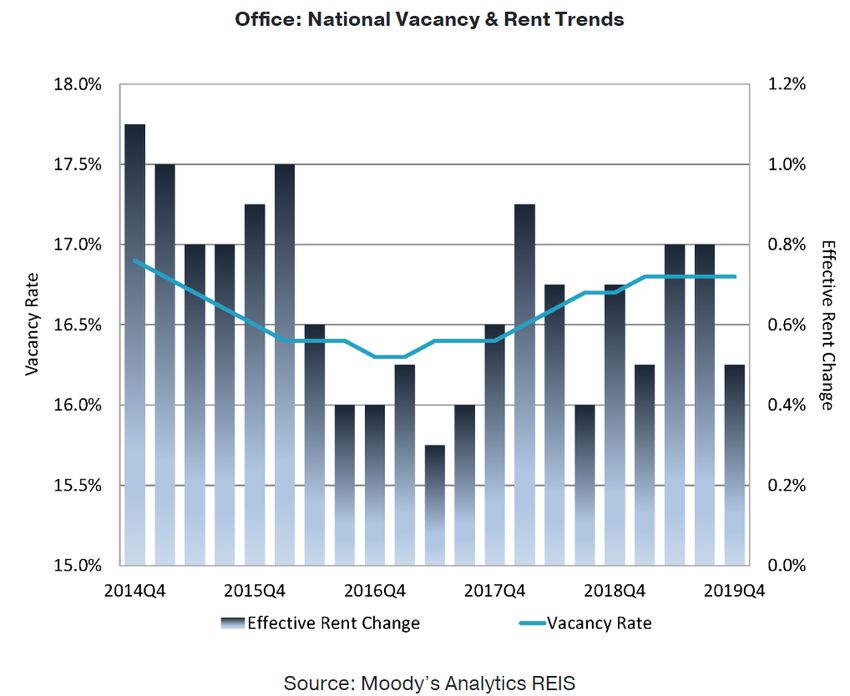
REIS reported that the office vacancy rate                                                                              3.5%
averaged 16.8% in 2019 Q4. At $34.31 per                  8.0
square foot (asking) and $27.87 per square                7.0                                                     6.4 3.0%
foot (effective), the average rents rose 2.6%             6.0
and 2.7%, respectively, from one year ago.                                                                              2.5%
                                                          5.0
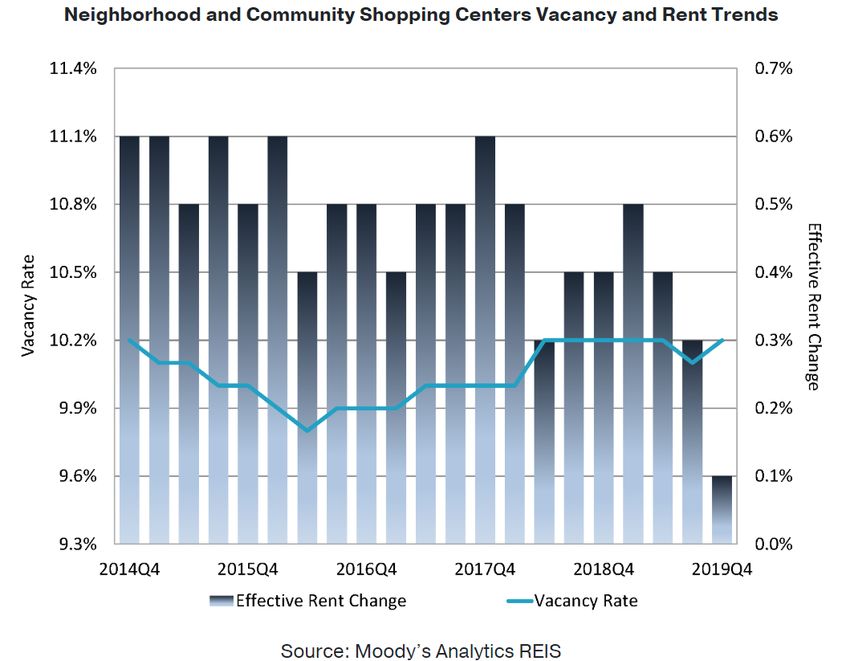
REIS also reported that retail vacancy rate               4.0                                                           2.0%
climbed rose to 10.2% in 2019 Q4. At $21.48 per
                                                                Q1/2012
                                                                Q3/2012
                                                                Q1/2013
                                                                Q3/2013
                                                                Q1/2014
                                                                Q3/2014
                                                                Q1/2015
                                                                Q3/2015
                                                                Q1/2016
                                                                Q3/2016
                                                                Q1/2017
                                                                Q3/2017
                                                                Q1/2018
                                                                Q3/2018
                                                                Q1/2019
                                                                Q3/2019
square foot (asking) and $18.82 per square
foot (effective), the average rents increased
1.2% and 1.3%, respectively from one year ago.
                                                                    U.S. Rental Vacancy Rate        Y/Y Rent Growth (%)

NATIONAL ASSOCIATION of REALTORS® | RESEARCH GROUP | www.nar.realtor/research-and-statistics                              9
4 | COMMERCIAL CONSTRUCTION
  Value of Construction Put in Place Declined
  2% in 2019 Q4                                                 Value of Construction Put in Place,
  The value of construction put in place for
                                                                 Seasonally Adjusted Annual Rate
  multifamily, office, lodging, and commercial            $260,000          (Million $)
  (includes industrial properties, retail, and            $255,000
  specialty stores) declined by 2%, to a                  $250,000
  seasonally adjusted annual volume of $239.5             $245,000
  billion in February 2020, according to data             $240,000
  from the U.S. Census Bureau. The value of               $235,000                                                 $239,501
  construction put in place for lodging,                  $230,000
  commercial, and office buildings declined by            $225,000
  2% to a seasonally adjusted annual rate of              $220,000
  $181.2 billion while the value of construction

                                                                     Nov/2018

                                                                     Nov/2019
                                                                     Apr/2018
                                                                     May/2018
                                                                       Jul/2018

                                                                     Oct/2018

                                                                     Apr/2019
                                                                     May/2019
                                                                     Aug/2018

                                                                       Jul/2019

                                                                     Oct/2019
                                                                      Jan/2018
                                                                     Feb/2018
                                                                     Mar/2018

                                                                     Dec/2018

                                                                     Dec/2019
                                                                     Jun/2018

                                                                     Sep/2018

                                                                      Jan/2019
                                                                     Feb/2019
                                                                     Mar/2019

                                                                     Aug/2019
                                                                     Jun/2019

                                                                     Sep/2019

                                                                      Jan/2020
                                                                     Feb/2020
  put in place for multifamily buildings was
  essentially unchanged at $58.while the
  construction for multifamily buildings was
  essentially at $58.27 billion.                            Source: US Census

  Housing starts for multifamily units have
  been generally on the rise since July 2019,
  increasing from an annual rate of only                               Housing Starts, Seasonally
  333,000 in July 2019 to a peak of 619,000 in
  January.                                                               Adjusted Annual Rate
                                                          1200              (in thousands)
  Housing starts have increased as the                    1000                                                          1072
  availability of non-residential construction
                                                           800
  workers and specialty trade contractors has
  increased over time. Still, there are about              600
                                                                                                                         527
  75,000 fewer construction workers today than             400
  before the Great Recession. Only 24% of                  200
  respondents reported that the cost and                     0
  availability of labor has improved from one
                                                                 Nov/2018

                                                                 Nov/2019
                                                                 Apr/2018
                                                                 May/2018
                                                                   Jul/2018

                                                                 Oct/2018

                                                                 Apr/2019
                                                                 May/2019
                                                                   Jul/2019

                                                                 Oct/2019
                                                                 Aug/2018

                                                                 Dec/2018

                                                                 Aug/2019

                                                                 Dec/2019
                                                                 Feb/2019
                                                                 Mar/2019

                                                                 Jun/2019

                                                                 Sep/2019

                                                                  Jan/2020
                                                                 Feb/2020
                                                                  Jan/2018
                                                                 Feb/2018
                                                                 Mar/2018

                                                                 Jun/2018

                                                                 Sep/2018

                                                                  Jan/2019

  year ago.

                                                                     Housing Starts: 1 Unit (SAAR, Thous.Units)
         Non-residential Construction and                            Housing Starts: Total Multifamily (SAAR, Thous.Units)
            Specialty Contractor Jobs
4000.0
3500.0                                       3447.6
3000.0
2500.0
2000.0
1500.0
1000.0
         Nov/2006

         Nov/2013
         May/2003
           Jul/2004

         May/2010
           Jul/2011

         May/2017
           Jul/2018
          Jan/2001
         Mar/2002

         Sep/2005

          Jan/2008
         Mar/2009

         Sep/2012

          Jan/2015
         Mar/2016

         Sep/2019

 NATIONAL ASSOCIATION of REALTORS® | RESEARCH GROUP | www.nar.realtor/research-and-statistics                            10
5 | COMMERCIAL OUTLOOK
  Commercial Outlook Among Respondents

  Respondents held mixed views about the                         Distribution of 1-Year Commercial
  commercial market outlook in the next 12
                                                                   22%
                                                                        Transactions Outlook
  months. Among commercial members of the
  National Association of REALTORS® who
                                                                                                    15%
  responded to NAR’s 2020 Q1 Commercial Real                                                                           11%
  Estate Quarterly Market Survey, respondents                                 9%                          9% 9%
  expect on average a 3% decline in their                                                                         5%              6%
                                                                      4%
                                                                                    2% 3% 3%                                 2%
  commercial transactions (sales, leasing,
  construction) in the coming 12 months. Forty-
  three percent expect a decline in their
  commercial transactions.

  Respondents expect commercial prices to
  decrease by 5% on average. Fifty-six percent
  expect prices to decline.

  Respondents expect new lease dollar volume
  to decline 4% in the coming 12 months. Forty-                     Distribution of 1-Year Price
  six percent expect a decline in new lease                                   Outlook
  volume.
                                                                              16%                   15%
  Respondents expect commercial construction                       12%
                                                                                         10%          10% 9%
  measured in square feet to decline by 5% in                                       8%
                                                                         6%
  the coming 12 months. Forty-nine percent                                                     4%                 4% 5%
  expect a decline in construction activity.                                                                              1% 1%

    Distribution of 1-Year Costruction
             Activity Outlook
       18%
                  13%              12%11%11%

                                               5%
                                                    8%
                                                                   Distribution of 1-Year Leasing
             5%         4% 5% 4%
                                                         1% 2%            Volume Outlook
                                                                                                    18%
                                                                   15%
                                                                                                      12%
                                                                              10%                        10%
                                                                         5%         5% 6% 5%                      5% 6%
                                                                                                                          1% 2%

NATIONAL ASSOCIATION of REALTORS® | RESEARCH GROUP | www.nar.realtor/research-and-statistics                           11
5 | COMMERCIAL OUTLOOK
Impact of the coronavirus pandemic on commercial real estate and economic outlook

Multifamily properties. Demand for multifamily properties, especially class B/C, and rents will likely
increase in the next 12 months. The concentration of job loss in these sectors has an impact on the
multifamily market because food service workers, housekeeping and personal care workers are more
likely to be renters compared to other occupational groups. Only 51% of food service workers are
homeowners and only 58% of housekeeping and personal care workers are homeowners, well below
the national rate of 64% .The large but temporary loss of jobs will make saving for a down payment for a
home purchase more difficult. NAR’s Flash Survey conducted April 5-6 reported that 59% of NAR
members reported that buyers are delaying a home purchase for a couple of months. These factors will
increase the demand for rentals. Class B/C properties that are more affordable will tend to be in higher
demand than Class A due as households work through improving their financial positions.

Industrial properties. Demand for industrial properties and rents will likely increase in the next 12
months. The retail brick-and-mortars were already buffeted by the rise of e-commerce sales prior to the
coronavirus outbreak. As of 2019, e-commerce sales accounted for nearly 12% of retail sales from 1% in
2000. The shift towards online shopping during the coronavirus period may result in a change in
buying behavior for consumers that can only favor e-commerce sales. Industrial warehouses that are
part of the critical logistics for e-commerce will benefit from this shift. The demand for data centers will
tend to increase given the increasing demand for online/virtual transactions and data security.

Retail properties. Demand for retail properties and rents will likely be decrease in the next 12 months
with a large potential for the adaptive reuse of vacant malls. Retail nearly came to a complete stop as
more than 47,000 retailers across the U.S. temporarily shut their doors or adjusted store hours in an
effort to help slow the spread of the coronavirus pandemic. This disruption can potentially lead to a
permanent shuttering of these stores which is more severe than the 9,350 big retailers that closed in
2019. Retail operations and foot traffic in retail stores and malls could normalize but there could be a
slow progression to the normalization of retail store foot traffic with shoppers staying away from
enclosed malls as they remain wary of being infected. However, there is a large potential for
repurposing the vacant malls, such as for health care armories or medical care centers.

Office properties. Demand for office space and rents will likely decrease in the next 12 months. The
federal government and the Federal Reserve have put in place several measures to contain the
economic fallout and keep businesses afloat. These measures will help retain current tenants. However,
some businesses may shutter permanently, especially businesses who don’t have the office and
business tools in place to avail of the small business loans (Paycheck Protection Program, Economic
Injury Disaster loans). Businesses will also likely put on hold new hiring of employees given the
uncertainty of a resurgence of the coronavirus pandemic and until after a vaccine is found. Leases will
likely become more short-term, and businesses may opt for smaller office spaces because they don’t
want to carry that rent burden if another pandemic strikes. Demand for co-working space may fall as
freelances decide to just work from home rather than in co-working spaces.

Economic outlook. We expect the second quarter GDP growth to be the steepest decline in the U.S.
history – likely in excess of 15% contraction on an annualized basis. What will be critical is the recovery in
the second half of the year. Is it going to be sharp and quick rebound of a V-shaped or a sluggish
recovery of staying low for a period before a recovery of a U-shaped? That will depend on the economy’s
response to the stimulus measures and the path of virus containment. The best guess is for the second
half GDP growth to be insufficient to compensate for the loss in the second quarter. Therefore, we
expect GDP to have contracted around 3% to 5% for the year as a whole and net job losses totaling
around 3 to 5 million.

NATIONAL ASSOCIATION of REALTORS® | RESEARCH GROUP | www.nar.realtor/research-and-statistics          12
5 | COMMERCIAL OUTLOOK

   All out monetary and fiscal policy to bolster economic activity and ensure a strong
   recovery

   The social distancing measures have resulted in the temporary closings of many retail stores,
   schools, offices, restaurants, and places of amusement and leisure. At this time, fiscal and
   monetary policies are on an all out support mode to minimize the economic fallout of these
   measures at this critical time and to ensure a strong recovery.

   On March 27, Congress passed a $2.2 trillion Coronavirus Aid, Relief, and Economic Security
   (CARES) Act to provide financial assistance to workers and businesses through an expanded
   unemployment insurance program (Pandemic Unemployment Assistance) and loans for
   small businesses loans (Paycheck Protection Program, Economic Injury Disaster Loan).
   Borrowers of single-family and multifamily mortgages can also request forbearance for up to
   three months on federally backed mortgages. The Act provides for a moratorium on eviction
   filings and imposition of fees or penalties for non-payment of rent on federally backed loans
   for up to 120 days.

   On March 15, the Federal Open Market Committee lowered the target range for the federal
   funds rate to 0 to 1/4 percent. In its statement, the FOMC also announced that “the Federal
   Reserve is prepared to use its full range of tools to support the flow of credit to households
   and businesses and thereby promote its maximum employment and price stability goals.” It
   announced to increase its holdings of Treasury securities by at least $500 billion and its
   holdings of agency mortgage-backed securities by at least $200 billion and to reinvest all
   principal payments from the Federal Reserve's holdings of agency debt and agency
   mortgage-backed securities in agency mortgage-backed securities. On March 16, it reduced
   the rate charged to depository institutions (discount window) by 150 basis points to 0.25% to
   encourage banks to “turn to the discount window to help meet demands for credit from
   households and businesses at this time”. On April 9, the FOMC announced it will provide up
   to $1.3 trillion in loans to assist households, businesses, and state and local governments and
   announced that “The Fed’s role is to provide as much relief and stability as we can during
   this period of constrained economic activity, and our actions today will help ensure that the
   eventual recovery is as vigorous as possible." keep businesses afloat and support the
   provision of critical services.

NATIONAL ASSOCIATION of REALTORS® | RESEARCH GROUP | www.nar.realtor/research-and-statistics         13
6 | COMMERCIAL BUSINESS TRENDS
  A 2020 Q1 survey of commercial members of the National Association of
  REALTORS® were asked: “Did you observe an Increase in the following
  developments in your primary market compared to one year ago? The
  fraction of respondents* who reported Yes:

                     Senior housing: 56%

                     Smart home technology: 49%

                       Group-living: 41%

                       Micro-apartments: 23%

                       Transit-oriented development: 60%

                        Parking-free apartments: 31%

*1,019 respondents

NATIONAL ASSOCIATION of REALTORS® | RESEARCH GROUP | www.nar.realtor/research-and-statistics   14
6 | COMMERCIAL BUSINESS TRENDS
  A 2020 Q1 survey of commercial members of the National Association of
  REALTORS® were asked: “Did you observe an increase in the following
  developments in your primary market compared to one year ago? The
  fraction of respondents* who reported Yes:

                      Construction outside CBD: 64%

                      Repurposing of Retail Malls: 54%

                      Co-working/flex spaces: 47%

                      Opportunity Zone Fund investments: 46%

                      LEED Certification: 30%

                      WELL Certification: 14%

*1,019 respondents

NATIONAL ASSOCIATION of REALTORS® | RESEARCH GROUP | www.nar.realtor/research-and-statistics   15
6 | COMMERCIAL BUSINESS TRENDS
  A 2020 Q1 survey of commercial members of the National Association of
  REALTORS® were asked: “Did you see an improvement in these
  conditions in your primary market area compared to one year ago? The
  fraction of respondents* who reported Yes:

                     Local economic conditions: 58%

                      National economic conditions: 51%

                      Obtaining debt /equity financing: 57% / 53%

                        Zoning regulations: 29%

                      Hiring and cost of labor : 24%

                      Obtaining and cost of raw materials: 21%

*921 respondents

NATIONAL ASSOCIATION of REALTORS® | RESEARCH GROUP | www.nar.realtor/research-and-statistics   16
7 | ABOUT THE SURVEY

      NAR’s Quarterly Market Survey gathers information about the commercial transactions
      of REALTORS® and members of affiliate organizations (CCIM, SIOR, RLI, IREM, and the
      Counselors of Real Estate) and the opportunities and challenges facing commercial
      practitioners.

      The 2020 Q1 survey was sent to approximately 75,000 commercial REALTORS® and
      members of affiliate organizations during April 1–8, 2020, of which 1,463 responded to the
      survey. A smaller number of respondents reported their sales (951) and leasing (931)
      transactions or market observations.

      Among sales agents who had a sale during 2019 Q4, the average sales transaction was
      $502,305.

      Among 1,494 respondents, 23% reported a designation granted by a NAR commercial
      institute, society, or council. The NAR Research Group acknowledges Charlie Dawson,
      Vice-President, Engagement, and Rodney Gansho, Director of Engagement, in reaching
      out to CCIM, CRE, IREM, SIOR, and RLI designees to respond to the survey.

                              Designations Reported by 1,494 Respondents

                                                                                                   1155

                                   228

                    23                              57              27              58

                   ALC:        CCIM: (The CCIM CPM®: (Institute   CRE™:      SIOR: (Society of No designation
                (REALTORS®        Institute)    of Real Estate (Counselor of Industrial and from these NAR
               Land Institute)                  Management) Real Estate™)         Office          affiliated
                                                                               REALTORS®)         councils,
                                                                                                 institutes,
                                                                                                  societies

NATIONAL ASSOCIATION of REALTORS® | RESEARCH GROUP | www.nar.realtor/research-and-statistics                    17
COMMERCIAL REAL ESTATE TRENDS & OUTLOOK
 April 2020

 NAR RESEARCH GROUP Lead Team

 Research and Analysis

 LAWRENCE YUN, PhD
 Chief Economist & Senior Vice President for Research

 GAY CORORATON
 Senior Economist & Director of Housing and Commercial Research

 BRANDON HARDIN
 Research Economist

 Survey Deployment and Editing

 MEREDITH DUNN
 Research Communications Manager

 ANNA SCHNERRE
 Research Assistant

©2020 National Association of REALTORS®
All Rights Reserved. May not be reprinted in whole or in part without permission of the National
Association of REALTORS®. For question about this report or reprint information, contact
data@realtors.org.

Download report at: https://www.nar.realtor/commercial-real-estate-market-survey
The National Association of REALTORS® is America’s largest trade association,
representing more than 1.3 million members, including NAR’s institutes, societies
and councils, involved in all aspects of the real estate industry. NAR membership
includes brokers, salespeople, property managers, appraisers, counselors and
others engaged in both residential and commercial real estate. The term
REALTOR® is a registered collective membership mark that identifies a real estate
professional who is a member of the National Association of REALTORS® and
subscribes to its strict Code of Ethics. Working for America's property owners, the
National Association provides a facility for professional development, research and
exchange of information among its members and to the public and government
for the purpose of preserving the free enterprise system and the right to own real
property.

NATIONAL ASSOCIATION OF REALTORS®
RESEARCH GROUP

The Mission of the NATIONAL ASSOCIATION OF REALTORS® Research Group is to
produce timely, data-driven market analysis and authoritative business intelligence
to serve members, and inform consumers, policymakers and the media in a
professional and accessible manner.

To find out about other products from NAR’s Research Group, visit
www.nar.realtor/research-and-statistics

500 New Jersey Avenue, NW
Washington, DC 20001
202.383.1000
You can also read