3Q-2021 Market Intelligence Reports Release Presentation - Better Lodging Analytics For Better Business Decisions
←
→
Page content transcription
If your browser does not render page correctly, please read the page content below

3Q-2021 Market Intelligence
             Reports Release
              Presentation

Better Lodging Analytics For Better Business Decisions
1. Our Approach to Market Intelligence
2. U.S. Market Review
3. This Recovery Will Be Different
4. U.S. Outlook
5. Market Highlights
6. Q&A

Our Approach

The LARC Approach

                          Everything To Analyze a Market in One Place
•   Historical Operating Results                 Forecasts for the following key industry metrics:
                                                 On a Quarterly Basis
•   Detailed Economic Summary                         •    Supply
•   Citywide Pacing Data                              •    Demand
                                                      •    Occupancy
•   Air Traffic Data                                  •    Average Daily Rate
•   Office Market                                     •    RevPAR
                                                      •    Wages
•   Supply Pipeline                                   •    Hotel EBITDA and Margins
•   Home Sharing                                 On an Annual Basis
                                                      •    Property Taxes
•   Recent Transactions                               •    Cap Rates
•   Key Capital Projects (Public and Private)         •    Hotel Values
LARC’s Core Values

     Transparency                     Market-Based                          Realism

LARC believes its forecast       LARC recognizes that each         LARC’s baseline forecasts
accuracy      should        be   forecast/ project completed       represent the most likely
transparent and offer a          should be constructed with        outcomes, grounded in the
means for clients to alter       the specific factors that drive   current market environment
inputs to key drivers, should    that individual market in         and realistic outlooks for key
they      have       differing   mind, yielding a unique           macro drivers.
assumptions.                     analytical model that results
                                 in highly accurate findings
                                 and conclusions.
Forecast Methodology

    Multi-Variable Linear Regression                        No Subjective Adjustments
•   We find the industry and macro-economic           •   We incorporate special events like the Super
    factors that drive lodging fundamentals in            Bowl into our models
    each market we analyze                            •   Taking the time to build market specific models
     o While there is overlap among the markets, no       creates heightened forecasting accuracy
       two markets have the same forecast model
     o We include leading indicators as well as       •   We don’t allow the psychology of the moment to
       concurrent indicators                              alter our forecasts by applying subjective
                                                          adjustments.
•   We build as many factors as necessary into
    our models (usually between 3 and 7) to           •   Subjectively adjusting the results eliminates the
    build a model that has impeccable back                advantage of using data analytics
    testing strength going back to 2000
     o Our models account for past downturns
Only the Best Data Sources

                               Better Data In = Better Data Out
• We know that regression forecasting is based      Key Data Providers
  on data and specifically forecasts for key        •   Historical Operating Results- STR
  industry drivers that come from platforms other
  than us.                                          •   Detailed Economic Summary- Moody’s Analytics

• We use the best data providers we can find to     •   Citywide Pacing Data- Local CVBs
  make sure that our outputs are the best           •   Office Market- Moody’s Analytics
  possible.                                         •   Supply Pipeline- BuildCentral
                                                    •   Home Sharing- AirDNA
                                                    •   Historical Cap Rates and Transactions – Real
                                                        Capital Analytics, LW Hospitality Advisors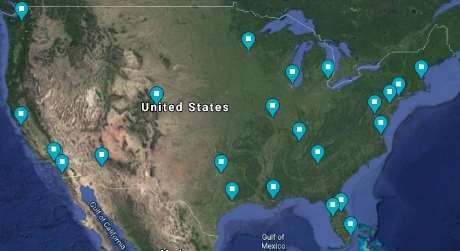
U.S. Market Review
Monthly 2021 RevPAR Growth From 2019

         Recovery Progressing                               Monthly RevPAR Change vs. 2019
•   U.S RevPAR has been on a steady          20%
    recovery since the start of the year
                                                0%
     • January: -48%
                                             -20%
     • April: -29%
     • July: +0.2%                           -40%
                                                                                                                            U.S.
•   STR’s Top-25 markets are down            -60%                                                                           Top 25
    more, but recovering at a similar pace                                                                                  All Other
                                             -80%
•   Smaller markets turned positive vs.

                                                                                                                            June
                                                                     January

                                                                                                                      May

                                                                                                                                    July
                                                                                                      March
                                                                                           February

                                                                                                              April
    2019 in June
                                             Source: Lodging Analytics Research & Consulting, STR
4%
• Market
from 2019
through July
down 25.2%
Extreme YTD
Divergence is
is down 71%
• Norfolk is up
• San Francisco
U.S. Headlines
• 2021 U.S. RevPAR
10%
0%
-80%
-70%
-60%
-50%
-40%
-30%
-20%
-10%
Norfolk/Virginia Beach, VA
Miami, FL
Tampa, FL
Charleston, SC
Memphis, TN
Omaha, NE
San Antonio, TX
Dayton, OH
Source: Lodging Analytics Research & Consulting, STR, LVCVA
Salt Lake City, UT
Phoenix, AZ
Des Moines, IA
Saint Louis, MO
Cleveland, OH
Kansas City, MO
Houston, TX
Indianapolis, IN
Detroit, MI
San Diego, CA
Atlanta, GA
Dallas, TX
Pittsburgh, PA
Ann Arbor, MI
Orlando, FL
An Inconsistent Start to the Recovery
Los Angeles, CA
Austin, TX
Orange County, CA
Columbus, OH
YTD-July RevPAR vs. YTD 2019
Nashville, TN
Raleigh, NC
Las Vegas
Louisville, KY
Philadelphia, PA
Denver, CO
YTD-July 2021 RevPAR vs. 2019
Portland, OR
Oahu Island, HI
Chicago, IL
Minneapolis, MN
New Orleans, LA
Seattle, WA
New York, NY
Washington, DC
Boston, MA
San Jose, CA
San Francisco/San Mateo, CAJuly
36%
vs. 2019 in July
• U.S. RevPAR up
• 11 of LARC’s 44
0.2% vs. 2019 in
markets positive
Remains Extreme
• San Francisco
U.S. Headlines
• Miami was up
• Market Divergence
was down 50%
10%
20%
30%
40%
0%
-60%
-50%
-40%
-30%
-20%
-10%
Miami, FL
Tampa, FL
Norfolk/Virginia Beach, VA
Charleston, SC
Phoenix, AZ
Orlando, FL
San Antonio, TX
Omaha, NE
Source: Lodging Analytics Research & Consulting, STR, LVCVA
Las Vegas
Nashville, TN
Memphis, TN
Atlanta, GA
San Diego, CA
Kansas City, MO
Orange County, CA
Austin, TX
Salt Lake City, UT
Oahu Island, HI
Des Moines, IA
Houston, TX
Detroit, MI
Saint Louis, MO
Indianapolis, IN
An Inconsistent Start to the Recovery
Los Angeles, CA
Dayton, OH
Louisville, KY
New Orleans, LA
July 2021 RevPAR vs. July 2019
Dallas, TX
Pittsburgh, PA
Cleveland, OH
Ann Arbor, MI
July 2021 RevPAR vs. 2019
Denver, CO
Philadelphia, PA
Raleigh, NC
Columbus, OH
Chicago, IL
Portland, OR
New York, NY
Seattle, WA
Minneapolis, MN
Washington, DC
Boston, MA
San Jose, CA
San Francisco/San Mateo, CATSA Throughput
Air Traffic Recovery Stalled
TSA Throughput Growth vs. 2019
On 14-Day Moving Average
• Air traffic volumes troughed at year- 0%
over-year declines of 96% in mid-April -20%
2020
-40%
• From September 2020 through June -60%
2021 there was steady improvement
-80%
• However, since the start of July
-100%
throughput has stabilized at levels
about 20% below 2019 -120%
10/14/2020
11/14/2020
12/14/2020
3/14/2020
4/14/2020
5/14/2020
6/14/2020
7/14/2020
8/14/2020
9/14/2020
1/14/2021
2/14/2021
3/14/2021
4/14/2021
5/14/2021
6/14/2021
7/14/2021
8/14/2021
Source: Lodging Analytics Research & Consulting, TSAVaccinations Driving Increased Travel
Vaccinations Driving Air Traffic
TSA Throughput Relative to 2019 vs. U.S.
Vaccination Totals
• As of September 4, approximately 176 0% 200
million U.S. citizens had been fully
Millions
180
vaccinated -10%
160
• Data From January 19 to September 4 -20% 140
shows that vaccinations are driving an -30% 120
increase in air traffic 100
• 97.1% correlation -40% 80
• 94.4% R-squared -50% 60
Air Traffic vs. 2019 40
• However, moving forward vaccinations -60%
20
will slow and the recovery will be reliant U.S. Vaccination Total
on the return of corporate and group -70% 0
2/2/2021
3/2/2021
6/8/2021
7/6/2021
8/3/2021
demand
1/19/2021
2/16/2021
3/16/2021
3/30/2021
4/13/2021
4/27/2021
5/11/2021
5/25/2021
6/22/2021
7/20/2021
8/17/2021
8/31/2021
• Less than 30% of the global population
is fully vaccinated
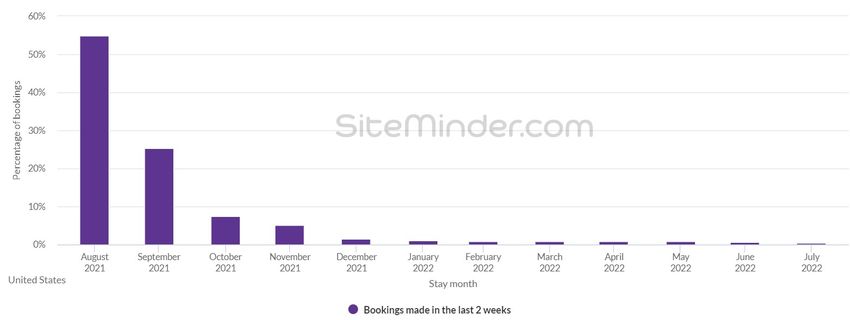
Source: Lodging Analytics Research & Consulting, TSA, CDCHotel Booking Volumes
Volumes Beginning to Hotel Booking Volumes as % of 2019
Accelerate Levels
• U.S. hotel booking volumes have started to
improve
• As of 2/1, 54.6% of 2019 booking volumes
were completed
• As of 3/1, 62.8%
• As of 5/27, 88.4%
• As of 7/1, 82.0%
• As of 8/13, 74.2%
• As of 9/5, 82.4%
• The Delta Variant clearly caused a
deceleration in the bookings recovery from Booking Window is Very Short
late July through Mid-August, but booking
volumes have recovered that lost ground
• Booking windows remain extremely short
Source: Siteminder.comSupply- Hotel Closures
Peak Rooms Closures
Peak Room Closure Highlights
as a % of Existing Market Inventory
• The U.S. closure peak occurred in April 60%
2020 at almost 800,000 rooms,
50%
equating to 14.3% of the rooms
inventory 40%
• Markets with the highest level of peak 30%
closures have the following attributes:
20%
• Heavy concentration of union labor
10%
• Large resorts
• International destination 0%
Anaheim
San Francisco
Orlando
San Diego
Nashville
New York
Norfolk
St. Louis
Philadelphia
Denver
Boston
Washington D.C.
Honolulu
Chicago
Seattle
Houston
Phoenix
Minneapolis
Miami
Tampa
Atlanta
Detroit
Los Angeles
Dallas
New Orleans
• Theme parks as a large demand
driver
Source: Lodging Analytics Research & Consulting, BuildCentral and STRSupply- Closures As of July 2021
July Room Closure Highlights July Room Closures
as a % of Existing Inventory
• As of July 2021, only about 20,000 10%
rooms remained closed across the 7.8%
U.S., equating to 0.4% of the rooms
inventory
• New York now accounts for about half 3.7%
of all closures, though we estimate 2.3%
that only about 5,500 rooms across 1.6% 1.3%
0.9%
the New York market will be 0.4% 0.3% 0.3% 0.2%
0%
permanently closed
Source: Lodging Analytics Research & Consulting, BuildCentral and STRHome Sharing- Leisure Focused and Supply Driven
Hotel-Comparable Home Sharing Revenue and YoY Hotel-Comparable Home Sharing Available Room Hotel-Comparable Home Sharing ADR and YoY
Growth on a Rolling 4-Quarter Basis Nights and YoY Growth on a Rolling 4-Quarter Basis Growth on a Rolling 4-Quarter Basis
$2,500 120% 20 120% $180 8%
Millions
Millions
100% 18 100% $170 7%
$2,000 16 $160 6%
80% 80% 5%
14 $150
$1,500 60% 12 60% $140 4%
40% 10 40% 3%
$130
2%
$1,000 20% 8 20% $120 1%
6 $110 0%
0% 0%
$500 4 $100 -1%
-20% 2 -20% $90 -2%
$0 -40% 0 -40% $80 -3%
2016-3Q
2016-4Q
2017-1Q
2017-2Q
2017-3Q
2017-4Q
2018-1Q
2018-2Q
2018-3Q
2018-4Q
2019-1Q
2019-2Q
2019-3Q
2019-4Q
2020-1Q
2020-2Q
2020-3Q
2020-4Q
2021-1Q
2021-2Q
2016-3Q
2016-4Q
2017-1Q
2017-2Q
2017-3Q
2017-4Q
2018-1Q
2018-2Q
2018-3Q
2018-4Q
2019-1Q
2019-2Q
2019-3Q
2019-4Q
2020-1Q
2020-2Q
2020-3Q
2020-4Q
2021-1Q
2021-2Q
2016-3Q
2017-1Q
2017-3Q
2018-1Q
2018-3Q
2019-1Q
2019-3Q
2020-1Q
2020-3Q
2021-1Q
Source: AirDNA and Lodging Analytics Research & Consulting Source: AirDNA and Lodging Analytics Research & Consulting Source: AirDNA and Lodging Analytics Research & Consulting
Hotel-Comparable Home Sharing Segment Share of
Accommodations Revenue
8%
7%
6%
5%
4%
3%
2%
1%
0%
2014-4Q
2015-2Q
2015-4Q
2016-2Q
2016-4Q
2017-2Q
2017-4Q
2018-2Q
2018-4Q
2019-2Q
2019-4Q
2020-2Q
2020-4Q
2021-2Q
Source: AirDNA and Lodging Analytics Research & ConsultingThis Recovery Will be Different
This Cycle is Unlike Any Other- RevPAR

    RevPAR Recovery Timeline                       RevPAR Recovery in Past Cycles (TTM)
                                               110
•   This cycle’s RevPAR decline is
    deeper and steeper than any                100
    experienced prior                          90

•   Following the Great Financial Crisis, it   80
    took 59 months for trailing-12-month
                                               70
    RevPAR to recover to the prior peak
                                                                                                                                                                                                                Current Downturn
    level                                      60
                                                                                                                                                                                                                Great Financial Crisis
                                               50
•   Following 9/11, it took 52 months                                                                                                                                                                           9/11

                                               40

                                                      Month 0
                                                                Month 3
                                                                          Month 6
                                                                                    Month 9
                                                                                              Month 12
                                                                                                         Month 15
                                                                                                                    Month 18
                                                                                                                               Month 21
                                                                                                                                          Month 24
                                                                                                                                                     Month 27
                                                                                                                                                                Month 30
                                                                                                                                                                           Month 33
                                                                                                                                                                                      Month 36
                                                                                                                                                                                                 Month 39
                                                                                                                                                                                                            Month 42
                                                                                                                                                                                                                       Month 45
                                                                                                                                                                                                                                  Month 48
                                                                                                                                                                                                                                             Month 51
                                                                                                                                                                                                                                                        Month 54
                                                                                                                                                                                                                                                                   Month 57
                                               Source: Lodging Analytics Research & Consulting, STR
This Cycle is Unlike Any Other- Occupancy
Occupancy Recovery in Past Cycles
Occupancy Recovery Timeline
(TTM)
110
• This cycle’s Occupancy decline is
deeper and steeper than any 100
experienced prior
90
• Following the Great Financial Crisis, it
took 81 months for trailing-12-month 80
Occupancy to recover to the prior 70 Current Downturn
peak level Great Financial Crisis
60
• Following 9/11, it took 65 months 9/11
50
Month 0
Month 12
Month 24
Month 36
Month 48
Month 60
Month 72
Source: Lodging Analytics Research & Consulting, STRThis Cycle is Unlike Any Other- ADR
ADR Recovery Timeline ADR Recovery in Past Cycles (TTM)
110
• This cycle’s ADR decline is deeper
and steeper than any experienced 100
prior
90
• Following the Great Financial Crisis, it
took 52 months for trailing-12-month 80
ADR to recover to the prior peak level 70 Current Downturn
• Following 9/11, it took 45 months 60
Great Financial Crisis
9/11
50
Month 0
Month 2
Month 4
Month 6
Month 8
Month 10
Month 12
Month 14
Month 16
Month 18
Month 20
Month 22
Month 24
Month 26
Month 28
Month 30
Month 32
Month 34
Month 36
Month 38
Month 40
Month 42
Month 44
Month 46
Month 48
Month 50
Month 52
Source: Lodging Analytics Research & Consulting, STRThis Cycle is Unlike Any Other- Hotel Values
Hotel Value Recovery in Past Cycles
Hotel Value Recovery Timeline
(Values Indexed to 2019)
• Following the Great Financial Crisis, 110
Hotel Values dropped 27% from the
2007 peak to the 2009 trough 100
• Following the Great Financial Crisis,
Hotel Values did not recover to the 2007 90
peak until 2015
80
• By 2018, values were 18% above the
prior 2007 peak 70
• Values began declining in 2019, in
advance of the pandemic 60
2020 E
2005
2006
2007
2008
2009
2010
2011
2012
2013
2014
2015
2016
2017
2018
2019
• We estimate that in a fully transparent
environment, 2020 values would have
fallen another 24% Source: Lodging Analytics Research & Consulting, Real Capital AnalyticsConvention Demand Could Recover Quickly
Recovery Will Be Faster Than U.S. Convention Center Bookings as of
Past Cycles June 2021
• We have aggregated definite room nights for over 30 120 Index 10%
of the largest convention centers across the United
% Chg vs. 2019 0%
States 100
-10%
• 2021 is pacing up 21% from 2020 but still 58% below 80
that of 2019 as cancellations have continued to -20%
materialize. Regardless, the majority of 2021 softness 60 -30%
was in the front half of the year, so if cancellations
-40%
don’t accelerate (something we believe is unlikely) the 40
recovery will begin in 4Q-2021. -50%
20
• 2022 is pacing just 11% below 2019 levels -60%
• While group is normally the slowest segment to 0 -70%
2019 2020 2021 2022 2023 2024
recover, with so many definite room nights already on
Source: Lodging Analytics Research & Consulting
the books, we believe convention group will snap back
faster than in past recoveriesGross Savings Rate
Unprecedented Savings Rate NIPA U.S. Gross Savings Rate
Coming Out of Downturn (Billions, SAAR)
• The U.S. Gross Savings Rate ended 2020 at
$4.2 trillion $4,500
• Not only is this the highest level on record, $4,000
but it is a 3% increase from pre-pandemic $3,500
levels $3,000
• The increase is primarily fueled by stock
$2,500
market gains and low spending during the $2,000
pandemic $1,500
$1,000
• During the GFC the gross savings rate
declined 11% and during the 9/11 downturn
$500
the gross savings rate declined 5% $0
1990Q1
1992Q1
1994Q1
1996Q1
1998Q1
2000Q1
2002Q1
2004Q1
2006Q1
2008Q1
2010Q1
2012Q1
2014Q1
2016Q1
2018Q1
2020Q1
• The current U.S. gross savings rate is
approximately double what it was after the
GFC Source: Moody’s Analytics, Lodging Analytics Research & Consulting2020 Economic Activity Better than Headlines for Lodging
Sector Performance, Stock Market
Support Corporate Transient 2020 Sector GDP Growth
Recovery
• Combined- the sectors that drive the most 10%
5% 3.6%
corporate transient demand across the 0.3%
lodging sector experienced no decline in 0%
2020; information Technology was up 3.6%, -5% -3.2% -2.2% -2.2% -2.1%
Financial Activities were up 0.3% and -10% -5.8% -5.6% -4.5%
Professional Services were down 2.2% -15% -12.3%
• In 2020, the S&P 500 set an all-time high -20%
and closed 15.2% above year-end 2019. It -25%
is up another 22% year-to-date (9/7/2021). -30% -27.2%
Education and Health
Leisure and Hospitality
Professional and Business
Information Technology
Other Services
Financial Activities
Natural Resources and
Trade, Transportation and
Manufacturing
Government
Construction
• During the GFC, the S&P 500 dropped
27%
Services
Mining
Services
• During the 9/11 Downturn, the S&P 500
Utilities
dropped 40%
Source: Lodging Analytics Research & ConsultingFiscal Stimulus- Covid-19 is 5x As Large as the GFC
Fiscal Stimulus Packages Fiscal Stimulus Totals (Billions)
Stimulus Package Value (Billions)
$9,000 $8,320
Great Financial Crisis
2008 Economic Stimulus Act $152 $8,000
American Recovery Act $840
$7,000
Total $992
as % of 2007 GDP 6.3% $6,000
$4,820
$5,000
Covid-19 Pandemic
CARES Act $2,000 $4,000
December Emergency Coronavius Relief $920
American Rescue Plan $1,900
$3,000
Total Covid-19 Stimulus To Date $4,820 $2,000
as % of 2019 GDP 25.2% $992
$1,000
Infrastucture Plan + Budget Reconcilation "Build Back Better" Agenda $3,500 $0
Total Assumed Covid-19 Stimulus $8,320 Great Financial Crisis Total Covid-19 Stimulus To Total Assumed Covid-19
as % of 2019 GDP 43.6% Date Stimulus
Source: Lodging Analytics Research & ConsultingU.S. Outlook
Covid-19 and Fiscal Policy Assumptions

•   The Delta Variant slows the corporate/ group travel recovery by a couple months
•   No new variants impact children or the vaccinated in any meaningful way
•   $550 billion infrastructure bill gets signed in the Fall
•   President Biden’s $3 trillion “Build Back Better” fiscal package will pass in late 2021 via
    budget reconciliation and be implemented beginning in 2022
•   Elevated inflation is transitory and labor supply constraints will ease in September
Delta Impact – Return to Office Delays
Sampling of Delta-Induced Reopening Delays
Company Scheduled Date Comments
Goldman Sachs June-21 Vaccinated only
• Many companies have pushed JP Morgan Chase July-21 Encouraging vaccines
back their return to the office as a Eli Lilly
Bank of America
July-21
September-21
Vaccine Mandate by 11/15
Vaccinated only
little as one month, to all the way CVS September-21
to early 2022 Pfizer September-21 Vaccine/ Testing mandate
UPS September-21 Vaccine Mandate by 10/1/2021
• Financial services are generally Washington Post September-21 Vaccination Mandate
the more aggressive companies Wells Fargo
Blackrock
October-21
October-21
Pushed back from 10/4 to 10/18
Vaccinated only
in the timing of a return to the Microsoft October-21 Vaccinated only
office Comcast October-21 Pushed back from September
Viacom CBS October-21 Delayed from September
• Tech companies are less Travelers Cos. October-21 Delayed "at least a month" from September
aggressive TJ Maxx
PwC
November-21
November-21
Vaccine Mandate
Delayed from September
• Some companies have Apple
Amazon
January-22
January-22
Pushed back from October
Pushed back from September
postponed their returns Starbucks January-22 Pushed back from October
indefinitely Ford Motor Company January-22
Google January-22 Pushed back from mid-October to January
Uber January-22 Pushed back from late September
Lyft February-22
Airbnb September-22 No change due to Delta variant
Twitter TBD Closed offices in New York and San Francisco in July
New York Times TBD Cancelled September return
Source: Lodging Analytics Research & ConsultingSupply
Key Supply Assumptions U.S. Lodging Supply Growth
(forecasts begin 3Q-2021)
• Almost all current hotel closures are 2019
1Q
2.0%
2Q
2.0%
3Q
2.0%
4Q
2.1%
Year
2.0%
temporary and virtually all temporarily 2020 2.0% -10.2% -3.4% -3.4% -3.6%
closed hotels will be open by the end 2021 F -1.9% 13.4% 7.9% 5.6% 6.3%
2022 F 5.7% 4.1% 1.9% 1.8% 3.4%
of 3Q-2021. 2023 F 1.5% 1.1% 1.1% 1.5% 1.3%
• Construction/ opening delays have '20 - '23F CAGR 3.6%
been rolling off throughout 2021, '20 - '25F CAGR 2.9%
which will cause more hotels to open
in late 2021 driving an acceleration in U.S. Economic Supply Growth
economic supply growth into late 2021 (forecasts begin 3Q-2021)
and early 2022, before supply growth 1Q 2Q 3Q 4Q Year
begins to moderate again. 2019 2.0% 2.0% 2.0% 2.1% 2.0%
2020 2.0% 2.7% 1.3% 1.2% 1.4%
2021 F 1.0% 1.6% 1.4% 2.3% 1.6%
2022 F 2.7% 2.0% 1.9% 1.8% 2.1%
2023 F 1.5% 1.1% 1.1% 1.5% 1.3%
'20 - '23F CAGR 1.7%
'20 - '25F CAGR 1.8%
Source: Lodging Analytics Research & Consulting, BuildCentral and STRRevPAR Model
Key Model Drivers RevPAR, Seasonally Adjusted
$120
Actual RevPAR, SA
• Unemployment Rate Modeled RevPAR, SA
• Real GDP $100 R-Squared = 99.7%
Standard Error = 4.3%
• Business Investment $80
• S&P 500 Index
• Real Foreign Exchange Rate $60
• Supply $40
$20
$0
1Q00
1Q01
1Q02
1Q03
1Q04
1Q05
1Q06
1Q07
1Q08
1Q09
1Q10
1Q11
1Q12
1Q13
1Q14
1Q15
1Q16
1Q17
1Q18
1Q19
1Q20
1Q21
1Q22
1Q23
1Q24
1Q25
Source: STR and Lodging Analytics Research & ConsultingADR Model
Key Model Drivers ADR, Seasonally Adjusted
$160
Actual ADR, SA
• Business Investment Modeled ADR, SA
$140
• Inflation R-Squared = 98.6%
Standard Error = 3.0%
$120
• Consumer Confidence
$100
• Unemployment Rate
$80
$60
$40
$20
$0
1Q00
1Q01
1Q02
1Q03
1Q04
1Q05
1Q06
1Q07
1Q08
1Q09
1Q10
1Q11
1Q12
1Q13
1Q14
1Q15
1Q16
1Q17
1Q18
1Q19
1Q20
1Q21
1Q22
1Q23
1Q24
1Q25
Source: STR and Lodging Analytics Research & ConsultingExpenses and EBITDA
U.S. Lodging Wage Growth
Key Expense Assumptions (forecasts begin 2Q-2021)
1Q 2Q 3Q 4Q Annual
• Property Taxes will grow at a 4.5% 2019 3.8% 3.8% 3.9% 2.4% 3.5%
CAGR through 2025 2020 2.3% -2.9% 0.0% 4.8% 1.1%
2021 F 8.0% 7.9% 2.3% -3.1% 3.7%
• Wages will increase at a 3.4% CAGR
through 2025 2022 F -5.9% -0.7% 2.3% 3.9% -0.2%
2023 F 4.4% 4.5% 4.4% 5.1% 4.6%
• Other Expenses will grow at inflation 2024 F 5.0% 4.8% 4.8% 4.5% 4.8%
• We assume historical levels of cost 2025 F 4.3% 4.3% 4.3% 4.3% 4.3%
Source: Lodging Analytics Research & Consulting, Moody’s Analytics
flexing related to occupancy and for
negative environments U.S. Hotel EBITDA Growth
1Q 2Q 3Q 4Q Annual Vs. 2019
2021 F -84.0% -330.1% -28995% 863.7% 403.1% -51.0%
2022 F 601% 71% 5.0% 78.6% 65.2% -19.1%
2023 F 50.0% 26.7% 15.0% 7.8% 23.1% -0.4%
2024 F 10.5% 10.3% 8.2% 7.0% 9.1% 8.6%
2025 F -0.2% -2.1% -1.6% -1.1% -1.3% 7.2%
Source: Lodging Analytics Research & ConsultingCap Rate Model
Key Model Drivers Hotel Cap Rates
10.0%
Macro-economic Factors 9.0%
• Baa Bond Yields 8.0%
• High Yield Bond Spreads 7.0%
• Real Foreign Exchange Rate 6.0%
• Real GDP 5.0%
4.0%
• Unemployment Rate Actual Cap Rate
3.0% Modeled Cap Rate
Lodging Industry Factors: R-Squared= 98.3%
2.0% Standard Error= 22 bps
• Lodging Supply
1.0%
0.0%
2005-2Q
2006-2Q
2007-2Q
2008-2Q
2009-2Q
2010-2Q
2011-2Q
2012-2Q
2013-2Q
2014-2Q
2015-2Q
2016-2Q
2017-2Q
2018-2Q
2019-2Q
2020-2Q
2021-2Q
2022-2Q
2023-2Q
2024-2Q
2025-2Q
Source: Real Capital Analytics and Lodging Analytics Research & ConsultingU.S. Forecast Summary
U.S. Hotel Industry Forecast Summary
Key Takeaways 3-Year 5-Year
We forecast ADR to recover to 2019 levels in 2022, while RevPAR,
2021 Forward Forward
Hotel EBITDA and asset values will reach 2019 levels in 2023. Growth CAGR CAGR
Occupancy won’t reach 2019 levels until 2024. Economic Supply 1.6% 1.7% 1.8%
Key changes from June Outlook: Demand 29.6% 15.9% 10.4%
• The summer leisure season proved stronger than expected as ADR Occupancy 28.0% 14.2% 8.6%
proved much more resilient despite low absolute occupancy levels ADR 17.1% 10.7% 7.5%
• The Delta Variant has delayed the acceleration of corporate and RevPAR 49.9% 26.4% 16.8%
group travel by at least a couple months. In June, we had expected it
to occur after Labor Day, now we are looking at November and Hotel EBITDA 403.1% 117.1% 61.6%
possibly after the new year. Hotel Values 19.5% 11.8% 7.0%
• Despite the stronger summer leisure season, our longer-term outlook
for demand and occupancy is essentially unchanged 2021 U.S. Hotel Industry Outlook
9/2021 Update 6/2021 Update Outlook
• Our long-term outlook on ADR has improved by about 3% as the
improved 2021 ADR recovery will give the industry a stronger base to YoY Growth YoY Growth Change
build from going forward, slightly enhancing pricing power over the Growth vs. 2019 Growth vs. 2019 vs. 2019
course of the next few years. Economic Supply 1.6% 2.9% 1.4% 2.9% 0.0%
• 2021 values improve tied to lower base rates and better cash flows, Demand 29.6% -13.7% 28.4% -17.4% 3.8%
but longer–term values are only slightly higher. Occupancy 28.0% -14.7% 21.8% -18.8% 4.1%
ADR 17.1% -7.9% 7.2% -15.7% 7.8%
RevPAR 49.9% -21.4% 30.6% -31.5% 10.1%
Hotel EBITDA 403.1% -51.0% 167.7% -73.8% 22.8%
Hotel Values 19.5% -8.9% 1.2% -22.9% 14.1%
Source: Lodging Analytics Research & ConsultingHotel Values- This Cycle
Hotel Value Recovery in GFC vs.
Hotel Value Recovery Timeline
Forecast for Current Cycle
• Following the Great Financial Crisis, Hotel Values dropped
27% from the 2007 peak to the 2009 trough 110 GFC Downturn Current Cycle
• Following the Great Financial Crisis, Hotel Values did not
recover to the 2007 peak until 2015
100
• Roughly $1 trillion in fiscal stimulus passed
• By 2018, values were 18% above the prior 2007 peak 90
• Values began declining in 2019, in advance of the
pandemic
80
• We assume $8 trillion in fiscal stimulus- $4.8 trillion
already passed and another $3.5 trillion passed in late
2021, but rolled out over several years for Biden’s “Build 70
Back Better” agenda
• We estimate values would have declined 23.8% in 2020, in
a fully transparent environment, which will bring the total 60
decline from the 2018 peak to 29%, comparable to the
Year 0
Year 1
Year 2
Year 3
Year 4
Year 5
Year 6
Year 7
Year 8
decline experienced in the GFC
• We forecast values to recover to 2019 levels by 2023, and
to the 2018 prior peak by 2024. However, we forecast a
decline in values in 2025, that will bring 2025 values on par Source: Lodging Analytics Research & Consulting, Real Capital Analytics
with the 2018 peak.Outlook vs. Past Cycles
Months of Recovery to Prior Peak
Recovery Timeline
By Cycle
• In general, we expect the recovery 120 9/11 GFC Covid
from this cycle to be meaningfully 100 vs. 9/11 vs. GFC 96
swifter than past cycles, despite the 81
80 72
deeper decline 65 63 59
60 45
52 52
• Relative to the Great Financial Crisis, 36
42
our outlook is anywhere from a year 40
and a half to two years faster, 20
depending on the metric 0
-2
• Relative to 9/11, our outlook is -20 -18
-9
-16
-10
-17
anywhere from 2 to 10 months faster, -40
-24
depending on the metric Occupancy ADR RevPAR Values
Source: Lodging Analytics Research & Consulting, Real Capital AnalyticsLARC vs. Other Forecasts
Highlights Current Forecasts
2021 2022 2023 2024 2025
STR/ Tourism Economics - August 12
• Most recent forecasts are most
Occupancy 57.9% 65.5%
positive for 2021 (LARC and STR) as ADR $115.64 $122.58
the summer season exceed all RevPAR $66.99 $80.19 $84.99 $90.10
expectations
PwC - May 28
• LARC remains much more positive for Occupancy 57.2% 61.8%
ADR recovery than others ADR $111.20 $118.49
RevPAR $63.57 $73.25
CBRE - March 30
Occupancy 49.1% 61.7% 65.1% 65.5% 65.2%
ADR $99.46 $113.21 $127.02 $136.63 $143.07
RevPAR $48.81 $69.85 $82.65 $89.51 $93.27
July 20 Update
ADR $107.69 $119.97
LARC - September 1
Occupancy 56.4% 61.1% 65.6% 66.5% 66.6%
ADR $120.86 $133.42 $140.06 $145.31 $148.16
RevPAR $68.15 $81.47 $91.88 $96.66 $98.71
Source: Lodging Analytics Research & Consulting, STR, PwC, CBREMarket Highlights
LARC’s Top-26 Market Coverage Universe

           26 Hotel Markets: STR’s Top 25, Las Vegas
Model Statistics
Model Accuracy Based on R-squareds and
Back-Testing to 2000 (2005 for cap rates)
R-Squareds for our Mult-Variable Regression Forecasting Models
RevPAR Forecast ADR Forecast Cap Rate Forecast
Anaheim, CA 99.2% 99.8% 99.6%
Atlanta, GA 99.2% 99.8% 98.2%
Boston, MA 99.4% 91.1% 99.5%
Chicago, IL 99.2% 99.7% 98.3%
Dallas, TX 99.5% 89.2% 99.8%
Denver, CO 92.3% 99.7% 99.8%
Detroit, MI 99.4% 89.9% 99.6%
Houston, TX 91.7% 92.1% 98.2%
Las Vegas, NV 99.5% 99.7% 99.5%
Los Angeles, CA 94.0% 93.8% 98.3%
Miami, FL 99.5% 99.6% 99.7%
Minneapolis, MN 99.4% 99.8% 99.7%
Nashville, TN 99.3% 99.6% 99.6%
New Orleans, LA 99.2% 99.6% 98.4%
New York, NY 99.6% 99.7% 94.8%
Norfolk, VA 98.9% 99.7% 98.4%
Honolulu, HI 95.5% 97.6% 98.3%
Orlando, FL 99.5% 98.7% 98.3%
Philadelphia, PA 99.6% 99.8% 99.7%
Phoenix, AZ 99.5% 99.8% 99.2%
San Diego, CA 99.6% 99.8% 98.3%
San Francisco, CA 94.7% 92.3% 98.3%
Seattle, WA 93.6% 92.9% 99.7%
St Louis, MO 89.8% 93.1% 99.6%
Tampa, FL 99.2% 91.2% 99.8%
Washington, DC 89.7% 99.8% 99.5%
United States Total 99.7% 98.6% 98.3%
Source: Lodging Analytics Research & Consulting2021 Outlook
2021 Top Performers (vs. 2019) 2020 Market
2021 Performance
Bottom Performers (vs. 2019)
Norfolk, Miami and Tampa: The only markets San Francisco, Boston, New York, Washington,
among the top-26 with RevPAR projected to D.C., and Seattle: Fly-to, High-Density,
exceed 2019 levels this year. They all have International-Focus
strong leisure activity and two of the three are
almost exclusively domestic markets.
RevPAR Growth Rates for the Top 26 Markets - 2021 vs. 2019
20%
10%
0%
-10%
-20%
-30%
-40%
-50%
-60%
-70%
Dallas, TX
New York, NY
Denver, CO
Miami, FL
Atlanta, GA
Orlando, FL
Los Angeles, CA
San Diego, CA
St Louis, MO
Las Vegas, NV
Phoenix, AZ
Seattle, WA
Boston, MA
Tampa, FL
Minneapolis, MN
San Francisco, CA
Honolulu, HI
New Orleans, LA
Anaheim, CA
Philadelphia, PA
Houston, TX
Nashville, TN
Chicago, IL
Norfolk, VA
Detroit, MI
Washington, DC
Source: Lodging Analytics Research & ConsultingRevPAR Recovery Back to 2019 Levels- Markets Diverge
% of Markets Reaching 2019 RevPAR by Year
Key Takeaways 70%
60%
• The majority of the 44 markets in our standard
coverage universe will recover to 2019 in 2023 or 50%
2024. However, some will diverge 40%
30%
• 3 will recover in 2021
20%
• 2 in 2022
10%
• 2 in 2025
0%
2021 2022 2023 2024 2025
• A faster recovery largely coincides with a higher Comparison of RevPAR recovery Year to
RevPAR looking out to 2025, but not always.
2025 RevPAR Premium to 2019 Levels
30%
There are several markets that won’t reach 2019
levels until 2023 or 2024 but will have higher 25%
2025 RevPAR vs. 2019
relative RevPAR by 2025 than markets that reach 20%
2019 levels in 2021 or 2022. 15%
10%
5%
0%
2020 2021 2022 2023 2024 2025 2026
Year Back to 2019 RevPAR
Source: Lodging Analytics Research & Consulting2025 Outlook Relative to 2019
Top Performers
Tampa: Strong economic growth, moderate supply growth and outsized exposure to domestic RevPAR Growth Rates for the Top 26 Markets – 2025 Outlook vs. 2019
leisure demand will make Tampa an outperformer. Additionally, with cap rates stabilizing only 30%
slightly above 2019 levels, 2025 asset values will be 18% above 2019 levels. 25%
20%
Phoenix: Strong economic growth will offset elevated supply growth, driving Phoenix operating
fundamentals to recover to 2019 levels at a swifter pace than most other major markets. We 15%
expect RevPAR to reach 2019 levels by 2022 and Hotel EBITDA by 2023. EBITDA growth, 10%
coupled with modest cap rate compression, will result in 2025 asset values that are 15% above 5%
2019 levels.
0%
Denver, CO
Dallas, TX
Orlando, FL
New York, NY
Las Vegas, NV
Los Angeles, CA
Atlanta, GA
St Louis, MO
Boston, MA
Miami, FL
San Diego, CA
Seattle, WA
San Francisco, CA
Anaheim, CA
Philadelphia, PA
Tampa, FL
Phoenix, AZ
New Orleans, LA
Houston, TX
Nashville, TN
Minneapolis, MN
Honolulu, HI
Norfolk, VA
Detroit, MI
Washington, DC
Chicago, IL
Denver: Fueled by above average economic growth and moderating economic supply growth,
Denver’s recovery is off to a strong start and is expected to accelerate into 2022. Outsized
economic growth will generate outsized ADR and RevPAR growth, while limited expense
growth will help drive outsized EBITDA growth. While cap rates will stabilize slightly below 2019
levels, EBITDA growth will be the primary driver of value appreciation as we expect 2025 asset
values to be 12% above 2019 levels. Source: Lodging Analytics Research & Consulting
Los Angeles: Once occupancy begins to recover, the market will have robust pricing power, Hotel Value Change for the Top 26 Markets – 2025 Outlook vs. 2019
driving outsized RevPAR and ADR growth. Elevated expense growth will mitigate some of the
20%
benefits of strong ADR growth, limiting EBITDA growth. However, EBITDA growth coupled with 15%
cap rate compression will result in 2025 asset values which are 10% above 2019 levels. 10%
5%
Nashville: Elevated supply growth will weigh on the market, preventing occupancy from fully 0%
recovering to 2019 levels by 2025. However, the market’s emergence as a three-demand- -5%
-10%
segment (corporate, group and leisure) locale will drive ADR and RevPAR to 2019 levels by -15%
2023. By 2025, Hotel EBITDA will be just 1% below 2019 levels, while cap rate compression -20%
drives 2025 asset values to be 7% above 2019 levels. -25%
Dallas, TX
New York, NY
Denver, CO
Los Angeles, CA
San Diego, CA
Miami, FL
Orlando, FL
Atlanta, GA
Seattle, WA
Las Vegas, NV
Boston, MA
St Louis, MO
Tampa, FL
Phoenix, AZ
Minneapolis, MN
Anaheim, CA
Philadelphia, PA
San Francisco, CA
New Orleans, LA
Honolulu, HI
Nashville, TN
Houston, TX
Detroit, MI
Chicago, IL
Washington, DC
Norfolk, VA
Source: Lodging Analytics Research & ConsultingThird Quarter Sentiment Shifts
Improving Outlook 2020Markets
Marketswith Greatestwith
Changes inlargest
Long-Term Value Change (vs. 2019)
Norfolk: Much stronger ADR growth through the summer leisure season indicates the market has
much more pricing power than previously expected. That will support stronger ADR growth, change Outlook vs. Last Quarter
Current Quarter Value Change
which will drive EBITDA and values higher. Last Quarter Value Change
13.6%
Anaheim & Orlando: The recovery of the theme park demand happened much more quickly than 15% Difference
anticipated. We now forecast these leisure heavy markets to recover more quickly than last 10% 6.9% 8.3%
quarter, particularly pertaining to ADR growth which fuel an increase in our EBITDA outlook, 3.9% 5.5% 4.2% 5.4% 4.2%
2.6% 3.6%
driving values higher.
5% 2.3%
Seattle: An improving economic outlook, across the market support an improvement to our long- 0%
term views on Seattle, making us less cautious on the market long-term. -5% -1.6% -1.2% -1.2%
-3.3%
-10% -6.0% -5.4%
Deteriorating Outlook -15% -11.1%
Atlanta
Orlando
Anaheim
Seattle
Boston
Norfolk
Boston: Our cap rate outlook, while still very positive is not as positive as a quarter ago, as rising
base rates, coupled with slowing fundamentals in the later years of our forecast weigh on Boston
values. We remain positive on Boston, but our outlook is moderating
Atlanta: Our models now forecast lower ADR growth over the long-term based on the components
Source: Lodging Analytics Research & Consulting
of economic growth across the market. That lower ADR growth will limit revenues and EBITDA
over the longer-term. That will weigh on cap rates and drive modest value erosion vs. our prior
forecast.Standard Pricing Product Standard Pricing December Promotion Single Report $2,000 - Single-Market Annual Contract $3,000 - (4 Quarterly Reports) Annual Contract - Full Research Platform $29,500 $19,500 • 4 Quarters of Reports • 26 Markets • U.S. Market Intelligence Report • Market Comparison Report • Excel Forecast Files • Access to LARC Team for assistance related to market analysis/understanding
Questions?

If you are interested in access to LARC’s industry-leading Market Intelligence
Reports, please contact us.

information@larcanalytics.com
Better Lodging
    Analytics For Better
    Business Decisions

         Ryan Meliker
           President
200 West 41st Street, Suite 602
     New York, NY 10036
         929.416.4783
information@larcanalytics.com
You can also read