Maple Leaf Foods Q1 2021 Business & Financial Review
←
→
Page content transcription
If your browser does not render page correctly, please read the page content below
Maple
                                      Leaf
                                      Foods
                                      Q1 2021 Business
All dollar amounts are presented in
CAD dollars unless otherwise noted.
                                      & Financial Review
Forward-looking Statements and non-IFRS Measures
    This presentation contains “forward-looking information” within the meaning of applicable securities law. These statements are based on current expectations, estimates, forecasts,
    and projections about the industries in which the Company operates, as well as beliefs and assumptions made by the Management of the Company. The COVID-19 pandemic
    creates a very fluid situation with many uncertainties. Based on its experience to date, the Company has made certain assumptions about the implications of COVID-19 for its
    business, including:
    shifting demand balance between retail and foodservice channels, product mix, productivity, supply chain disruptions, operating cost pressures and business continuity.
    The Company’s expectations with respect to future sales and returns associated with the anticipated growth of its plant protein business are based on a number of assumptions,
    estimates and projections, including but not limited to: the impact of COVID-19 (including expected increase in demand in foodservice channels in the back half of 2021), market
    growth assumptions, market share assumptions, new product innovation and commercialization, results of brand renovation initiatives, foreign exchange rates, supply chain
    effectiveness, customer and consumer behaviour and competition.
    The Company’s expectations with respect to the growth of its meat protein business, such as anticipated growth in sales, adjusted EBITDA margin and gross margin, are based on a
    number of assumptions, estimates and projections, including but not limited to: the impact of COVID-19 (including expected increase in demand in foodservice channels in the last
    half of 2021), commodity prices, hog and pork processor margins, demand for pork and access to export markets, poultry markets and supply management, foreign exchange rates,
    growth in demand for sustainable meats and branded products; supply chain effectiveness, customer and consumer behaviour and competition.
    The Company's assumptions about capital project expenditures and timing are based on a number of assumptions, including but not limited to: the impact of COVID-19, availability
    and cost of materials, labour, productivity levels, quality of estimating, weather conditions, and project scope.
    These statements are not guarantees of future performance and involve assumptions, risks and uncertainties that are difficult to predict. These assumptions have been derived from
    information currently available to the Company, including information obtained by the Company from third-party sources. These assumptions may prove to be incorrect in whole or in
    part. In addition, actual results may differ materially from those expressed, implied, or forecasted in such forward-looking information, which reflect the Company’s expectations only
    as of the date hereof. Please refer to the sections entitled “Risk Factors” and “Forward-Looking Statements” in the Company's Management Discussion and Analysis for the quarter
    ended March 31, 2021 for additional detail.
    In addition, this presentation contains the following non-IFRS measures:
    Adjusted Operating Earnings: Earnings before income taxes and interest expect adjusted for items that are not considered representative of ongoing operational activities of the
    business, and items where the economic impact of the transactions will be reflected in earnings in future periods when the underlying asset is sold or transferred.
    Adjusted Earnings per Share: Defined as basic earnings per share adjusted for all items that are not considered representative of ongoing operational activities of the business, and
    items where the economic impact of the transactions will be reflected in earnings in future periods when the underlying asset is sold or transferred.
    Adjusted Earnings Before Interest, Taxes, Depreciation and Amortization: Defined as Adjusted Operating Earnings plus depreciation and intangible asset amortization, adjusted for
    items included in other expense that are not considered representative of ongoing operational activities. Adjusted EBITDA Margin is calculated as Adjusted EBITDA divided by sales.
    Net (Debt) Cash: Defined as cash and cash equivalents, less long-term debt and bank indebtedness.
    Construction Capital: Defined as investments and related financing charges in projects over $50.0 million that are related to longer-term strategic initiatives, with no returns expected
    for at least 12 months in the future and the asset will be re-categorized from Construction Capital once operational.

    Please refer to the Company’s Management and Discussion and Analysis for the quarter ended March 31, 2021 (as filed on SEDAR) for additional information on non-IFRS financial
    measures.
2                                                                                                                               MAPLE LEAF FOODS – Q1 2021 BUSINESS AND FINANCIAL REVIEW | MAY 5, 2021
Built for
    Growth

3
Enroute to Becoming the Most Sustainable Protein Company on Earth

          13,500 employees
                                                        Total Sales (2020)         $4,304 million
                                                        Meat Protein Group                     Plant Protein Group
          31 manufacturing facilities*                                     2020 Adj.                                     2020
          prepared meats, fresh pork,
          fresh poultry and plant protein
                                                        12.4%              EBITDA
                                                                            Margin            19.5%                      Sales
                                                                                                                        Growth

          4M hogs processed annually                     Iconic
          (40% are raised in ~200                      National &
          company-operated barns with                   Regional
          leading animal care practices)                 Brand
                                                        Portfolio
          Largest producer of RWA
          pork in North America and
          poultry in Canada

          Leading presence in North
          American plant-based protein

    *Includes 5 feed mills and 3 chicken hatcheries.
4   Notes: RWA: raised without antibiotics.                  MAPLE LEAF FOODS – Q1 2021 BUSINESS AND FINANCIAL REVIEW | MAY 5, 2021
The Maple Leaf Foods Blueprint

55                                    MAPLE LEAF FOODS – Q1 2021 BUSINESS AND FINANCIAL REVIEW | MAY 5, 2021

We Built a Profitable Base; Now We’re Focused on Profitable Growth
2010 Transformation 2014 2015 Brand-led Growth Today
Exited non-core businesses Expanding sustainable meats platform
Rothsay (2013)
Olivieri (2013)
Canada Bread (2014)
Renovated core brands
Transformed our supply chain
Established scale prepared meats network,
consolidating fragmented supply chain
Delivered significant efficiency and margin
improvements Establishing leadership in plant protein
Invested in technology
Deployed SAP
6 MAPLE LEAF FOODS – Q1 2021 BUSINESS AND FINANCIAL REVIEW | MAY 5, 2021
Well-defined Strategies and the Leading Brands to Support Them
                                                       Two businesses, with two distinct strategies
                                Meat Protein Group                                                   Plant Protein Group
                            Strategy: Drive profitable growth                                          Strategy: Invest for growth

      Our
     Brands

                Adjusted EBITDA Dollars & Margin                                   Sales
                (in millions; margin as % of sales)              $508              (in millions)

                                                                                                                                +20%             $211
    Financial
                                                      $393
      Track                                                      12.4%
                                                                                                       +27%            $176
                        $332
     Record
                                                      10.4%                                $139
                        9.9%

                        2018                          2019       2020                       2018                        2019                     2020

7                                                                                                  MAPLE LEAF FOODS – Q1 2021 BUSINESS AND FINANCIAL REVIEW | MAY 5, 2021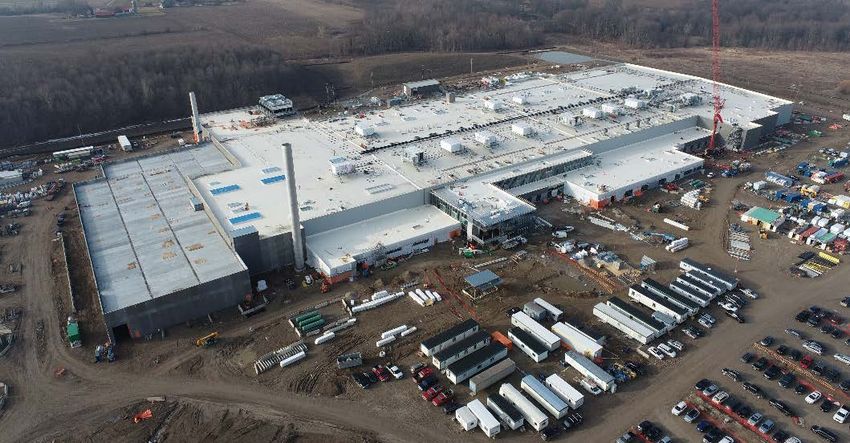
Built for Growth: 20% of Portfolio now Growing at 3-yr CAGR* >25%

    Percentage of Total Company Sales in Sustainable Meats and Plant-based Protein

                              ~10%                                                                                     ~20%

                                                                                                               2020
                                                                              High growth
                  2017
                      $3.5B                                                   Steady growth                    $4.3B

                              Deliberate repositioning of portfolio towards two high-growth categories,
                            now generating a compounded growth rate in excess of 25% in the last 3 years

     *CAGR = Compound annual growth rate; Calculated between 2017 and 2020.
8    Note: Sustainable meats includes RWA and organic sales in prepared meats, fresh poultry and fresh pork.           MAPLE LEAF FOODS – Q1 2021 BUSINESS AND FINANCIAL REVIEW | MAY 5, 2021
Q1 2021
    Results

9
Key Highlights from Q1 2021
• Protecting health, safety & security during third wave of COVID-19
Safeguarded the health and safety of our team members through adherence to our COVID-19 protocols
All facilities remained fully operational, despite rising community transmission
• Meat Protein continues to deliver excellent financial and operating results
Sales of $1.0B (+3.3%); Adj. EBITDA margin of 12.2% (+90 bps; 6th consecutive quarter of y/y expansion),
despite limited sales to China and market tailwinds not fully realized
Another quarter of strong operational performance and efficiencies across the network
• Plant Protein LT growth expectations unchanged despite market disruptions
Sales of $42.6M (-2.5% excl. FX) as COVID-19 weighed on foodservice activity & inhibited ability to reinvigorate
growth in fresh products
Core products continued to outpace market sub-segment
• 2021 outlook unchanged
Meat Protein: Mid-to-high single digit sales growth1, coupled with Adj. EBITDA margin expansion, despite
temporary margin compression in Q2 before fully recovering in the back half of the year
Plant Protein: Sales growth broadly in-line with 30% (largely tied to the abatement of COVID-19 restrictions),
supported by SG&A investment broadly in-line with 2020 levels
1On a 52-week comparable basis. MAPLE LEAF FOODS – Q1 2021 BUSINESS AND FINANCIAL REVIEW | MAY 5, 2021
10Meat Protein Group – Q1 2021 Strategic & Operational Highlights
Drive Profitable Growth by… Q1 2021 Highlights
• Excellent results in prepared meats, highlighted
Investing in our brands by strong sales growth and market share1
to build demand & loyalty expansion in Schneiders brand
• 6th consecutive quarter of double-digit growth
within the sustainable meats portfolio
Leveraging our leadership
in sustainable meats • Continued double-digit sales momentum in the
U.S. market, including expansion of our
Greenfield brand with new strategic customers
Broadening reach into new • Continued growth of value-added fresh pork &
geographies & channels
fresh poultry portfolio
• Lower direct product costs in prepared meats and
higher raw material utilization in primary
processing driving operational efficiencies
Delivering operational
excellence
11 1 Nielsen Canada Nat+Nfld GB+DR+MM, 12 weeks ended 03/27/2021. MAPLE LEAF FOODS – Q1 2021 BUSINESS AND FINANCIAL REVIEW | MAY 5, 2021Meat Protein Group – Q1 2021 Key Financial Metrics
Q1 2021 vs. LY Drivers
• Pricing implemented in Q4 2020, favourable mix-shift and
Sales $1,013.7 3.3% higher fresh pork volumes tied to more hogs processed
• Partially offset by FX and lower PM volumes & China sales
Gross Profit $166.1 +5.6% • Strong operating performance and mix-shift benefits,
which more than offset lower profits in China
Gross Margin 16.4% +40 bps • Q4 2020 pricing offset inflation & higher structural costs
SG&A Expenses $87.1 (1.1%) • Lower discretionary spend and lapping of donations
made in 2020 to support front-line healthcare workers
SG&A (as a % of sales) 8.6% (40 bps) • Partially offset by higher personnel costs
Adj. Operating Earnings $79.0 +14.2%
Adj. EBITDA $123.3 +11.0%
Adj. EBITDA Margin 12.2% +90 bps
Strong commercial and operating performance driving continued progress towards 2022 target
12 Note: All figures in millions, unless noted otherwise MAPLE LEAF FOODS – Q1 2021 BUSINESS AND FINANCIAL REVIEW | MAY 5, 2021Meat Protein Group – Putting the Q1 Pork Complex in Context
Hog Production Margins Pork Processor Margins Pork By-Product Markets
$20 $20 $8.0
$7.0
$10 $15
US/CWT
$6.0
US/CWT
US/CWT
$0 $10 $5.0
5-yr avg. 5-yr avg.
$5 $4.0
-$10
$3.0
$0
-$20 Q1 Q2 Q3 Q4 Q1 Q2 Q3 Q4 $2.0 Q1 Q2 Q3 Q4
Hog production margins = live hog cost (CME) less Hog Raising Index Pork processor margins = pork cutout less live hog cost (CME) Notes: Figures shown represent USDA by-product drop value.
Source: Informa; CME Group. Source: USDA; CME Group. Source: USDA.
• Surging hog prices outpaced the lagged impact of • Packer margins trended slightly above seasonal • Pork by-product markets strengthened in Q1
rising feed costs, which drove market hog levels as higher pork cut-out prices largely kept due to sustained strong US exports in China.
production margins well above average pace with rising live hog costs
Pork complex tailwinds of 160 bps, Maple Leaf only experienced a slight
primarily driven by aggressive benefit, given its limited access to
surge in live hog prices China and forward hog sales
13 Note: 5-yr average represents smoothed trendline of 2016-2020 data for each metric. MAPLE LEAF FOODS – Q1 2021 BUSINESS AND FINANCIAL REVIEW | MAY 5, 2021Plant Protein Group – Q1 2021 Strategic & Operational Highlights
Invest for Growth by… Q1 2021 Highlights
• Soft start to 2021, as COVID-19 disruptions continued
Entrenching prominent
market share position
COVID-19 restrictions heavily impeded foodservice activity,
while delaying fresh innovation and retail shelf resets
Market has begun to lap COVID-related retail surge starting in Mar. ‘20,
which will temporarily suppress y/y growth rates
Fostering & growing a
powerful portfolio of brands • Maintaining leading market position, with momentum in core
Greenleaf continues to hold #2 market share position in U.S. retail with
Relentlessly pursuing market leading distribution1
innovation Core product POS growth continued to outpace market sub-segment1
• Meanwhile, we are advancing our strategic agenda
Leveraging the full suite of
Maple Leaf capabilities
Freight and sourcing strategies lowering supply chain costs
Completed rollout of new Field Roast packaging look and feel
Launched new products: Stadium Dog and plant-based pepperoni
Driving efficiencies,
scale & stability
Announced foodservice partnerships with Wienershnitzel and Pizza Nova
Closed on the acquisition of the food processing site in Indianapolis
1IRI/SPINS (US MULO + US Natural); 12 weeks ended 03/21/2021. MAPLE LEAF FOODS – Q1 2021 BUSINESS AND FINANCIAL REVIEW | MAY 5, 2021
14Core Products Continue to Outperform
Core products continue
to outperform market Foodservice activity still
impacted by COVID-19 Fresh sub-segment
disruption continues
• Core products’ POS grew +2%1 in Q1, • Depressed foodservice activity continued • COVID-19 continues to delay roll-out of
in an environment where the market in Q1 2021 due to pandemic product innovation
sub-segment declined (5%1) • Rebound tied to abatement of COVID-19 • POS stabilizing as velocities and
• Lightlife tempeh and Field Roast Chao restrictions distribution largely unchanged from Q4
cheese products continue to expand • Meanwhile, a clear point of differentiation
leading market position with competition has been established
1IRI/SPINS (US MULO + US Natural); 12 weeks ended 03/21/2021. MAPLE LEAF FOODS – Q1 2021 BUSINESS AND FINANCIAL REVIEW | MAY 5, 2021
15Recent Foodservice Wins Showcase Product Innovation
Field Roast Signature Stadium Dog Field Roast Plant-Based Pepperoni
North America’s first pea-based hot dog Market’s first pea-based pepperoni alternative
• Launched in February across 20 Wienerschnitzel • Launched in January
locations in California, Texas and New Mexico across all Pizza Nova
locations across Canada
• Expanded to Kogi Trucks in L.A. and Orange
Country (as the “Home Run” dog) in March • Planned roll-out to retail
shelves in Canada and
• Rolled out to retail channel with launch across U.S. the U.S. later this year
Whole Foods locations in April
16 MAPLE LEAF FOODS – Q1 2021 BUSINESS AND FINANCIAL REVIEW | MAY 5, 2021Plant Protein Group – Q1 2021 Key Financial Metrics
Q1 2021 vs. LY Drivers
• Lower volumes in fresh retail products more than offset
Sales $42.6 (2.5%) continued growth in core retail volumes and pricing
(ex-FX)
implemented in Q4 2020 to mitigate inflation & higher costs
Gross Profit $0.1 (97.9%) • Improvement in distribution costs was more than offset by
lower sales volume and capacity utilization
Gross Margin 0.3% (1430 bps) • Q4 2020 pricing offset inflation & higher structural costs
SG&A Expenses $28.8 (6.7%) • Timing of certain advertising & promotional expenses,
which more than offset higher organizational costs
SG&A (as a % of sales) 67.6% (100 bps) • As a % of sales, SG&A expenses were similar to last year
Adj. Operating Earnings ($28.7) nm
Adj. EBITDA ($25.0) nm
Continued growth in core product line was more than offset by softer volumes in fresh
17 Note: All figures in millions, unless noted otherwise; nm = not meaningful MAPLE LEAF FOODS – Q1 2021 BUSINESS AND FINANCIAL REVIEW | MAY 5, 2021Total Company – Q1 2021 Key Financial Metrics
Q1 2021 vs. LY Drivers
Sales $1,053.1 +3.0% • Solid growth in Meat, partially offset by lower sales in Plant
Adj. Operating Earnings $50.4 +11.6%
Adj. EBITDA $98.3 +8.6% • Improvement driven by continued structural margin
expansion in Meat Protein
Adj. EBITDA Margin 9.3% +40 bps
Net earnings $47.7 nm
Adj. EPS $0.26 +23.8%
Net Debt1 $865.4 +$224.8
Debt related to Construction Capital $580.2 +$418.1 • Increase in construction capital primarily related to the
London poultry facility
Capital Expenditure (YTD) $184.7 +$85.5
Construction Capital CapEx (YTD) $152.3 +$94.5
Strong consolidated results, while maintaining financial flexibility for future growth
1Excludes $239.2 million in lease obligations.
18 Notes: All figures in millions, except per share amounts. MAPLE LEAF FOODS – Q1 2021 BUSINESS AND FINANCIAL REVIEW | MAY 5, 2021Summary of our Key Construction Capital Projects
London Poultry Facility Indianapolis Tempeh Facility
• Increases processing capacity for value-
• Cost effective and scalable approach to meet
Strategic added, higher margin poultry products Strategic burgeoning consumer demand for high-
Rationale • Gains operating efficiencies through lower Rationale growth, high-margin tempeh products
costs and consolidation of 3 sub-scale plants
• Existing 118K sq. ft. food facility
• Continued focus on paneling, mechanical,
• US$100M for acquisition & build-out of initial
plumbing and electrical work
Update • No change to budget ($720M) or Details capacity (4.5M kg/yr of tempeh production
beginning in H1/2022)
completion timing (mid-2022)
• Additional space for future growth opportunities
19 MAPLE LEAF FOODS – Q1 2021 BUSINESS AND FINANCIAL REVIEW | MAY 5, 20212021 &
Long-Term
Outlook
20No Change to our 2021 Financial Outlook
Mid-to-high single digit sales growth on a 52-week comparable basis, driven by continued momentum in
Meat sustainable meats, leveraging brand renovation, and growth into the U.S. market.
Protein Adj. EBITDA margin expansion, progressing towards the 2022 target of 14-16%, driven by mix-shift benefits in
Group prepared meats resulting from growth in sustainable meats and brand renovation, as well as operating efficiencies,
assuming pork complex conditions in-line with the 5-year average.*
Sales growth for the year broadly in-line with the strategic target of 30%, excluding FX. Growth is expected to be
driven by continued momentum in the core product line, product innovation, improved velocities and distribution in the
fresh line and resurgence in foodservice activity which is largely tied to the abatement of COVID-19 restrictions. Growth
Plant is expected to accelerate as the year progresses.
Protein Gross margin volatility in the near-term, as benefits from structural improvements in the supply chain may be
Group impacted by investment opportunities to drive sales growth in a rapidly evolving market, as well as COVID-19 effects.
SG&A expenses will be broadly in-line with 2020 levels, excluding FX, as the company leverages investments in
advertising, promotion and marketing to elevate its brand renovation, drive innovation and build scale in the business.
Capital expenditures in the range of $550 million to $650 million, with Construction Capital comprising
approximately 75% of the spend. A significant portion of the Construction Capital is related to the London, Ontario
Capital poultry facility, the acquisition and build-out of the plant protein facility in Indianapolis, Indiana and other projects to
add capacity and improve efficiency in our prepared meats business.
21 * Incorporates the impact of an unexpected surge in grain and hog price inflation, which should moderately compress MAPLE LEAF FOODS – Q1 2021 BUSINESS AND FINANCIAL REVIEW | MAY 5, 2021
margins in the second quarter before fully recovering in the back half of the year as related pricing action takes effect.Reconfirming our Long-Term Outlook
2022 Adjusted EBITDA margin target of 14-16%, driven by:
Meat
Protein • Growth in sustainable meats • Mix-shift benefits from our brand
and food renovation work
Group • Cost and operational efficiencies
Plant 2029 ambitious goals for high-growth business:
Protein • Reach $3B in sales, in a $25B market • Grow into low double-digit SG&A rate
Group • Deliver approx. 30% gross margin • Adj. EBITDA margin above Meat Protein
Stakeholder Creating impactful points of difference in the market & society:
• Leverage carbon neutral position, while making • Advancing social impact through the Maple
Value progress towards our Science-Based Targets Leaf Centre for Action on Food Security
Creation • World-leading animal welfare standards • Strengthening sustainable meats leadership
22 MAPLE LEAF FOODS – Q1 2021 BUSINESS AND FINANCIAL REVIEW | MAY 5, 2021Unexpected surge in grain & hog prices leading to meat inflation
Higher grain and lean hog prices have driven While we are executing price
pork costs 50% above 2020 levels adjustments in Q2 to compensate…
$120 11.50
$110 10.50
$100 9.50
…, we expect there to be a lag given
US $/bushel
US $/CWT
$90 8.50
how quickly commodity prices rose…
$80 7.50
$70 6.50
$60 5.50 …which will result in temporary, moderate
Q1/21 Q2/21 Q3/21 Q4/21 margin compression in Q2, before fully
$50 4.50
recovering in the back half of the year
Jul-21
Feb-21
Oct-21
Jan-21
Sep-21
Aug-21
Apr-21
May-21
Mar-21
Jun-21
Dec-21
Nov-21
Pork Cutout Lean Hogs Corn
Pork Futures Hog Futures Corn Futures
23 Source: USDA. MAPLE LEAF FOODS – Q1 2021 BUSINESS AND FINANCIAL REVIEW | MAY 5, 2021Appendix 24
Reconciliation of Non-IFRS Metrics – Adjusted EBITDA Margin

                                                                                        Three months ended March 31, 2021                                  Three months ended March 31, 2020
                                                                                      Meat                 Plant                                         Meat             Plant
     ($ millions)(1)                                                                Protein              Protein               Non-                    Protein          Protein           Non-
     (Unaudited)                                                                     Group                Group          allocated(2)   Total           Group            Group      allocated(2)            Total
     Earnings (loss) before income taxes                                                $76.2               (28.7)              18.4    $65.9            $68.2           (24.1)           (47.2)           ($0.3)
     Interest expense and other financing costs                                             —                    —               5.0      5.0                —                —               7.9              7.9
     Other expense (income)                                                                1.1                  0.1              3.3      4.5               1.2               —               2.6              3.8
     Restructuring and other related costs                                                 1.7                   —                —       1.7             (0.2)               —                —             (0.2)
     Earnings (loss) from operations                                                    $79.0               (28.7)              26.7    $77.1            $69.2           (24.1)           (36.7)             $8.5
     Decrease (increase) in FV of biological assets                                          —                   —             (38.5)   (38.5)               —                —             14.7             14.7
     Unrealized loss (gain) on derivative contracts                                          —                   —              11.8     11.8                —                —             22.0             22.0
     Adjusted Operating Earnings                                                        $79.0               (28.7)                —     $50.4            $69.2           (24.1)                —            $45.1
     Depreciation and amortization                                                       45.5                   3.8               —      49.2             43.0               3.5               —             46.6
     Items included in other income (expense)
                                                                                         (1.2)               (0.1)                —      (1.3)            (1.2)               —                —             (1.2)
     representative of ongoing operations(3)
     Adjusted EBITDA                                                                  $123.3                (25.0)                —     $98.3          $111.1            (20.5)                —            $90.5
     Adjusted EBITDA margin                                                           12.2%              (58.6)%                N/A     9.3%            11.3%          (44.3)%              N/A             8.9%

           1 Totals may not add due to rounding.
           2 Non-Allocated   includes eliminations of inter-segment sales and associated costs of goods sold, and non-
           allocated costs which are comprised of expenses not separately identifiable to reportable segments and
           are not part of the measures used by the Company when assessing a segment’s operating results.
           3 Primarily includes gain/loss on sale of long-term assets and miscellaneous expenses.
25                                                                                                                                               MAPLE LEAF FOODS – Q1 2021 BUSINESS AND FINANCIAL REVIEW | MAY 5, 2021
Reconciliation of Non-IFRS Metrics – Adjusted Earnings per Share
Three months ended March 31,
($ per share)
(Unaudited) 2021 2020
Basic earnings per share $0.39 (0.03)
Restructuring and other related costs(1) 0.01 —
Items included in other expense (income) not
0.02 0.02
considered representative of ongoing operations(2)
Change in the fair value of biological assets (0.23) 0.09
Unrealized loss (gain) on derivative contracts 0.07 0.13
Adjusted Earnings per Share(3) $0.26 $0.21
1 Includesper share impact of restructuring and other related costs, net of tax.
2 Primarilyincludes legal fees and provisions and transaction related costs, net of tax.
3 Totals may not add due to rounding.
26 MAPLE LEAF FOODS – Q1 2021 BUSINESS AND FINANCIAL REVIEW | MAY 5, 2021Capital Allocation Priorities
Growth capacity and efficiency initiatives
1 Reinvest in the Business with a focus on returns metrics & timing
Capitalize on inorganic opportunities
2 Accretive Acquisitions with financial and strategic appeal
3 Dividend Appreciation Deliver consistent predictable growth
Opportunistic buybacks when return
4 Share Repurchases metrics exceed other alternatives
While maintaining a strong balance sheet with ample liquidity
27 MAPLE LEAF FOODS – Q1 2021 BUSINESS AND FINANCIAL REVIEW | MAY 5, 2021You can also read