In-situ monitoring of the growth of nanostructured aluminum thin film
←
→
Page content transcription
If your browser does not render page correctly, please read the page content below

In-situ monitoring of the
                                 growth of nanostructured
                                 aluminum thin film

                                 Michal Novotny
                                 Jiri Bulir
                                 Jan Lancok
                                 Petr Pokorny
                                 Michal Bodnar

Downloaded From: https://www.spiedigitallibrary.org/journals/Journal-of-Nanophotonics on 14 Aug 2021
Terms of Use: https://www.spiedigitallibrary.org/terms-of-use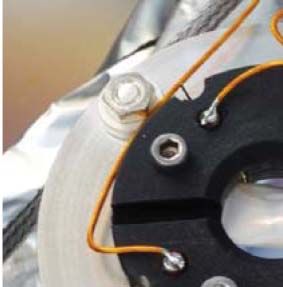
In-situ monitoring of the growth of nanostructured
                                                     aluminum thin film

                                 Michal Novotny, Jiri Bulir, Jan Lancok, Petr Pokorny, and Michal Bodnar
                                     Institute of Physics of the ASCR, v.v.i., Na Slovance 2, 182 21, Prague, Czech Republic
                                                                        novotnym@fzu.cz

                                 Abstract. Metal thin film functional properties depend strongly on its nanostructure, which can
                                 be manipulated by varying nucleation and growth conditions. Hence, in order to control the
                                 nanostructure of aluminum thin films fabricated by RF magnetron sputtering, we made use of
                                 in-situ monitoring of electrical and optical properties of the growing layer as well as plasma
                                 characterization by mass and optical emission spectroscopy. The electrical conductivity and
                                 I–V characteristics were measured. The optical constants were obtained from optical monitoring
                                 based on spectral ellipsometry. The relevant models (based on one or two Lorentz oscillators and
                                 B-spline functions) were suggested to evaluate the data obtained from the monitoring techniques.
                                 The results of the in-situ monitoring were correlated with scanning electron microscope analyses.
                                 We demonstrated the monitoring was able to distinguish the growth mode in real-time. We could
                                 estimate the percolation threshold of the growing layer and control layer nanostructure. The
                                 nanostructure was effectively manipulated by RF power variation. Optical functions exhibiting
                                 plasmonic behavior in the UV range and a strong nonlinear character of I–V curves were
                                 obtained for an ultrathin Al film deposited at a lower growth rate. C 2011 Society of Photo-Optical
                                 Instrumentation Engineers (SPIE). [DOI: 10.1117/1.3543816]

                                 Keywords: aluminum ultrathin film; magnetron sputtering; in-situ monitoring; electrical con-
                                 ductivity; spectral ellipsometry; optical emission spectroscopy; mass spectroscopy.
                                 Paper 10069SSPR received Oct. 1, 2010; revised manuscript received Nov. 23, 2010; accepted
                                 for publication Nov. 24, 2010; published online Feb. 3, 2011; corrected Mar. 3, 2011.

                                 1 Introduction
                                 Nanostructured (particulate) aluminum (Al) thin films have been recently shown as potential
                                 substrates for metal-enhanced fluorescence (MEF) in the ultraviolet-blue spectral region,1–3
                                 where fluorophores in the excited state undergo near-field interactions with the metal particles
                                 to create surface plasmons (SPS). Thin Al films make it possible to observe SP-coupled emission
                                 at UV wavelengths, while silver or gold thin films can be used at visible wavelengths only. The
                                 fluorescence enhancement factor depends on the thickness of the Al films as the size of the
                                 nanostructures formed varies with Al thickness.2 Thin Al films have also played an important
                                 role in modern microelectronics, i.e., integrated circuits (IC). This has been the most widely used
                                 interconnection material in IC devices4 because of its low resistivity and its ability to form ohmic
                                 contact with Si-based semiconductors. Thin Al films for such devices are commonly fabricated
                                 by sputtering (in particular magnetron sputtering that allows aluminum to be deposited at high
                                 deposition rates of up to l μm/min). This application requires forming a continuous film in the
                                 initial stage of the growth process.
                                     The experimental consequences of nucleation and growth play an extremely important role in
                                 determining the structure and characteristics of thin films. The film growth process for aluminum
                                 can be divided into three different stages: nucleation, coalescence and channel. The metal grains
                                 in the films grow during the whole process, therefore the volume fraction of metal grain increases
                                 with the film thickness. The dependence of electrical5 and optical6,7 properties on the thickness

                                 1934-2608/2011/$25.00
                                                       C 2011 SPIE

                                 Journal of Nanophotonics                                     051503-1                   Vol. 5, 2011

Downloaded From: https://www.spiedigitallibrary.org/journals/Journal-of-Nanophotonics on 14 Aug 2021
Terms of Use: https://www.spiedigitallibrary.org/terms-of-use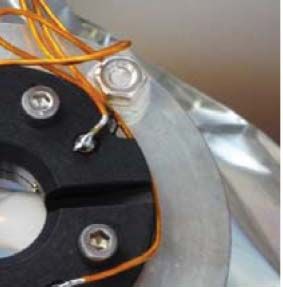
Novotny et al.: In-situ monitoring of the growth of a nanostructured aluminum thin film

                                 of ultrathin Al films is believed to come from microstructure transition during the film growth.
                                 dc conductivity of ultrathin Al films (film thickness of 100 nm) σ ∼106 −1 m−1 (ρ∼10−6 m)5
                                 was found to be much lower than that of bulk aluminum σ = 3.8×10⁷ −1 m−1 (ρ = 2.6×10⁻⁸
                                 m).8 This fact can be attributed to scattering of electrons by surfaces and grain boundaries in
                                 the film. However, simple dc conductivity measurements are not sufficient to understand the
                                 conduction mechanism in the ultrathin film, where quantum mechanical tunneling plays a role.9
                                 Other characterizations, i.e., I–V characteristics or temperature dependence, must be analyzed.
                                 Optical functions of ultrathin Al films were determined using spectrophotometric measurements5
                                 or spectral ellipsometry (SE).7 The SE was demonstrated as a valuable technique for real-time
                                 monitoring of the evolution of the optical functions of Al film throughout all stages of the growth
                                 process by thermal evaporation on c-Si substrate.7 The Al film growth in a magnetron sputtering
                                 system depends critically on the characteristics of the plasma in the vicinity of the substrate,
                                 which is closely related to deposition conditions.10 It is important to utilize plasma diagnostics,
                                 e.g., mass spectroscopy11–14 and optical emission spectroscopy13,15 to better understand plasma
                                 processes taking place near the substrate and magnetron target, and effectively control the
                                 deposition process.
                                     Hence, in order to understand and control the Al film growth process in real time, one
                                 has to employ several in-situ monitoring techniques, i.e., monitoring of electrical and optical
                                 properties, and plasma characterizations, too.
                                     We report, in this paper, a complex in-situ monitoring of electrical conductivity (I–V char-
                                 acteristics) and optical functions of the growing Al layer as well as plasma characterization by
                                 mass and optical emission spectroscopy. The results of the in-situ monitoring are correlated
                                 with scanning electron microscope (SEM) analyses.

                                 2 Experimental
                                 Ultrathin Al films were grown by RF magnetron sputtering in a stainless steel chamber. The
                                 chamber was pumped down by turbomolecular pump to a pressure of 2 × 10⁻⁴ Pa. A round
                                 shape magnetron aluminum target (Al purity of 99.99%) of 100 mm diameter was used for
                                 sputtering. The magnetron discharge was maintained in Ar atmosphere at constant pressure of
                                 2 Pa and at RF magnetron power (PRF ) of either 50 or 200 W. Single-side polished fused silica
                                 substrates of dimension 15×15 mm2 were used for film deposition at room temperature. The
                                 distance between the target and the substrate was 100 mm.
                                     The sample was electrically contacted using four wires onto two silver electrodes of rect-
                                 angular shape with dimension of 2.5×15 mm2 . The electrodes were sputtered along two sides
                                 of the substrate. The substrate holder with the sample is shown in Fig. 1(a). In-situ monitoring
                                 of electrical properties was performed using a multimeter Agilent 34411A and ac-dc current
                                 source Keithley 6221. The measurement setup is schematically shown in Fig. 1(b).
                                     In-situ monitoring of optical properties of the growing film was performed using a spectral
                                 ellipsometer (J.A.Wollam M2000) equipped with a software package CompleteEASE         R
                                                                                                                          for data
                                 acquisition and analysis. The ellipsometer was attached to the deposition chamber at an incident
                                 angle of 76.5 deg. Real-time optical measurements were taken in the wavelength region from
                                 250 to 1000 nm, at a sampling rate of 10 Hz. Optical functions—refractive index (n) and
                                 extinction coefficient (k)—were derived using an appropriate model to fit the measured spectral
                                 ellipsometric data. The model was based on parallel layers on a semi-infinite substrate. We
                                 assume smooth interfaces and homogeneous optical constants in the model in order to simplify
                                 the task and minimize the number of fitted parameters.
                                     Plasma mass spectroscopy was performed using a mass spectrometer EQP 500 HIDEN
                                 Analytical, Ltd. Plasma flew into the spectrometer through an orifice 200 μm in diameter
                                 placed at a distance of 100 mm from the magnetron target. Mass spectra were taken in the range
                                 from m/q = 1 to m/q = 100 amu with a resolution of 0.5 amu.
                                     The system for plasma characterization by optical emission spectroscopy was based on a
                                 monochromator Triax iHR550 equipped with a grating 1200 or 2400 g/mm and liquid nitrogen

                                 Journal of Nanophotonics                                     051503-2                             Vol. 5, 2011

Downloaded From: https://www.spiedigitallibrary.org/journals/Journal-of-Nanophotonics on 14 Aug 2021
Terms of Use: https://www.spiedigitallibrary.org/terms-of-use
Novotny et al.: In-situ monitoring of the growth of a nanostructured aluminum thin film
Substrate
Electrodes
V I I
multimeter
Agilent 34411A Keithley 6221
(a) (b)
Fig. 1 (a) A substrate with electrodes placed in the substrate holder for in-situ simultaneous
monitoring of electrical and optical properties.(b) Scheme of electrical properties measurements.
cooled CCD camera Symphony (2048 × 512 pixels). The OES signal was collected perpendic-
ular to the magnetron-substrate axis by a focusing lens and optical fiber. The spectra were taken
at the magnetron target and substrate holder. Spectra were analyzed in the wavelength region
from 350 to 750 nm with a resolution of 0.05 nm.
Morphology and microstructural properties were analyzed by means of SEM JEOL JSM-
7500F. The film thickness was measured with a profilometer.
3 Results and Discussion
We first realized detailed characterizations of magnetron plasma by mass spectroscopy and
optical emission spectroscopy. These analyses revealed plasma composition and properties in
the substrate vicinity as well as near the magnetron target. In the next step we performed
several calibration measurements to estimate the film growth rate. We obtained a growth rate of
0.45 nm s−1 and 0.12 nm s−1 for the films deposited at RF power of 200 and 50 W, respectively.
Then we proceeded with the deposition of Al thin film and in-situ characterization of optical
and electrical properties of the growing film.
3.1 Plasma Characterization
The mass spectrum of ions and ionized radicals generated in the magnetron discharge in mag-
netron plasma is displayed in Fig. 2. The spectrum is composed of single ionized atoms Al+
(m/q = 27 amu), Ar+ (m/q = 40 amu), Al2 + (m/q = 54), Ar2 + (m/q = 80 amu), doubly
ionized atoms Al2+ (m/q = 13.5 amu), Ar2 2+ (m/q = 20 amu), and ionized radical AlAr+
(m/q = 67 amu). We also detected low signals of 36 Ar+ and 38 Ar+ isotope ions and H+ , H2 + ,
H2 O+ , and N2 + ions from residual atmosphere. Let us note that neither O nor O2 + oxygen species
were recorded in the mass spectra of magnetron discharge plasma. This fact is of great impor-
tance regarding the prevention of undesirable oxidation processes of the Al thin film during the
growth.
Characteristic OES spectra of magnetron plasma taken in the wavelength region from 350
to 750 nm at the magnetron target and at the substrate are shown in Fig. 3. The intensities of
neutral Al* emission lines at 394.4 and 396.15 nm dominate the OES spectra taken at the target.
Al* emission lines of much lower intensity were also detected in the OES spectra taken at the
Journal of Nanophotonics 051503-3 Vol. 5, 2011
Downloaded From: https://www.spiedigitallibrary.org/journals/Journal-of-Nanophotonics on 14 Aug 2021
Terms of Use: https://www.spiedigitallibrary.org/terms-of-useNovotny et al.: In-situ monitoring of the growth of a nanostructured aluminum thin film
6
10
+
Ar
5 +
10 Al
2+
Ar at substrate holder
Intensity (c/s)
4
10
3
10
2+
Al + + Ar 2
+
Al2 AlAr
2
10
1
10
0 10 20 30 40 50 60 70 80 90
M (m/q)
Fig. 2 Mass spectra of ions and ionized radicals occurring in the magnetron discharge plasma
in the vicinity of the substrate.
substrate. The other lines appearing in the spectra in Fig. 3 can be assigned to neutral Ar. A few
weak Ar+ lines can also be recognized in the spectra. The upper levels of Ar (all well above
10 eV) can be populated in different ways, i.e., predominantly by direct electron impact from
the ground state, from metastable states and from cascades from higher states.13 The minimum
excitation energy of aluminum is much lower (around 3.15 eV). Hence a different group of
electrons might contribute to Al excitation.
3.2 In-Situ Monitoring of Optical Properties
Evolution of the ellipsometric angles ( and ), in the spectral region from 250 to 1000 nm,
measured during Al thin film growth (at PRF = 200 W), is shown in Fig. 4. The optical
functions (n and k) derived from these SE data are depicted in Fig. 5. The SE data revealed
a substantial change of the optical properties of the Al film at nucleation and coalescence
Al
Intensity (a.u.)
5
1x10
4 at magnetron target
8x10
4
4x10
0
400 500 600 700
3
6x10
Intensity (a.u.)
4x10
3
at substrate
3
2x10
0
400 500 600 700
Wavelength (nm)
Fig. 3 Optical emission spectra of plasma generated by the magnetron discharge. The spectra
were taken in the vicinity of the magnetron target and the substrate.
Journal of Nanophotonics 051503-4 Vol. 5, 2011
Downloaded From: https://www.spiedigitallibrary.org/journals/Journal-of-Nanophotonics on 14 Aug 2021
Terms of Use: https://www.spiedigitallibrary.org/terms-of-useNovotny et al.: In-situ monitoring of the growth of a nanostructured aluminum thin film
32
28
24 Al film mass
Ψ (°)
thickness (nm)
20
16
1.8
12 2.2
300 400 500 600 700 800 900 1000 3.5
75 5.0
6.6
60
7.3
45 8.5
30 9.0
Δ (°)
15
0
-15
300 400 500 600 700 800 900 1000
Wavelength (nm)
Fig. 4 Ellipsometric angles ( and ) of the Al thin film at different growth stages.
stages that correspond to film mass thickness from 2.2 to 5 nm. At these stages, the SE
data could be successfully fitted using a dispersion model based on two Lorentz oscillators,
which describes well the resonant character of the dispersion curve.16 The resonant charac-
ter indicates noncontinuous growth and nanoislands formation of Al at initial stages of the
growth process. We can clearly observe plasmonic behavior at these films in the UV-blue
spectral range, when we follow the development of the extinction coefficient (k) shown in
Fig. 5.
4.2
3.6
3.0
n
2.4
Al film mass
1.8 thickness (nm)
1.8
1.2 2.2
3.5
300 400 500 600 700 800 900 1000
5.0
5 6.6
7.3
4
8.5
3 9.0
k
2
1
0
300 400 500 600 700 800 900 1000
Wavelength (nm)
Fig. 5 Optical functions (n and k) of the Al thin film at different growth stages.
Journal of Nanophotonics 051503-5 Vol. 5, 2011
Downloaded From: https://www.spiedigitallibrary.org/journals/Journal-of-Nanophotonics on 14 Aug 2021
Terms of Use: https://www.spiedigitallibrary.org/terms-of-useNovotny et al.: In-situ monitoring of the growth of a nanostructured aluminum thin film
30 40
24 PRF= 200 W 20
Ψ (°)
PRF= 50 W
Δ (°)
18
0
300 400 500 600 700 800 900 1000
3
4
3 2
k
n
2 1
1
0
300 400 500 600 700 800 900 1000
Wavelength (nm)
Fig. 6 Ellipsometric angles ( and ) and optical functions (n and k) of Al ultrathin films of mass
thickness of d ∼ 4.5 nm and d ∼ 4.7 nm prepared at PRF = 200 W and PRF = 50 W, respectively.
The observed plasmon resonance peak in the extinction coefficient shifts from λ = 320 nm
to λ = 390 nm and simultaneously the value of k maximum increases from 1.2 to 2 as the
growth of the layer proceeds and mass thickness increases from d ∼ 1.8 nm to d ∼ 3.5 nm.
The SE measurements taken around and above the Al film percolation threshold (d ∼ 5 nm)
revealed further dramatic changes in the optical properties of the film, compared to the films
at the coalescence stage. The SE data in this stage could not be any longer fitted using the
model of two Lorentz oscillators. For a mathematical description of general behavior of the
dispersion curves in this case, we used B-spline functions, which successfully fitted the SE
data. The B-splines were demonstrated as a useful numerical tool for parameterization of the
dispersion curve of general SE data.17 A set of these basis functions used in CompleteEASE R
can describe complex structure in the absorption spectra, while simultaneously providing the
physically correct (i.e., Kramers–Kronig consistent) dispersion spectra.17 B-splines degree of
3 was used and the knot spacing was optimized with respect of the goodness of the fit.
The plasmon peak vanishes at d ∼ 5 nm and k becomes an ascending function of λ at d >
6.6 nm.
The influence of lower RF power (resulting in lower growth rate) on optical properties of
the deposited film can be observed in Fig. 6, where the measured SE data and optical functions
of the films of equivalent mass thickness d ∼ 4.5 nm and d ∼ 4.7 nm prepared at PRF = 200 W
and PRF = 50 W, respectively, are compared. The SE data of the film deposited at PRF = 50 W
could be fitted using a model of only one Lorentz oscillator, while two Lorentz oscillators
had to be applied for the film prepared at PRF = 200 W in order to correct the fit. We can
observe different behavior related to localised plasmon, when the plasmon peak is located at
λ = 260 nm (at PRF = 50 W) and λ = 400 nm (at PRF = 200 W). The plasmon peak position
at λ = 260 nm obtained for the sample prepared at PRF = 50 W (d ∼ 4.7 nm), whose optical
functions are shown in Fig. 6, is even lower than that observed in thinner films of d ∼ 2 nm
and d ∼ 3.5 nm prepared at PRF = 200 W, whose optical functions are shown in Fig. 5. This
observation suggests a discrepant nature of the nanostructure films prepared at PRF = 50 W and
PRF = 200 W.
Journal of Nanophotonics 051503-6 Vol. 5, 2011
Downloaded From: https://www.spiedigitallibrary.org/journals/Journal-of-Nanophotonics on 14 Aug 2021
Terms of Use: https://www.spiedigitallibrary.org/terms-of-useNovotny et al.: In-situ monitoring of the growth of a nanostructured aluminum thin film
Film mass thickness (nm)
0 1 2 3 4 5 6 7 8 9 10 11 12 13
1M 150k
800k
Al film resistance (Ω)
Sheet resistivity (Ω)
Deposition stop
100k
600k
400k
50k
200k
0 0
0 5 10 15 20 25
Deposition time (s)
Fig. 7 Evolution of electrical resistance of Al thin film during the growth. Final film mass thickness
d ∼ 9 nm and resistance ∼ 205 .
3.3 In-Situ Monitoring of Electrical Properties
The evolution of electrical resistance and sheet resistivity of the same sample, whose SE data
and optical functions are shown in Figs. 4 and 5, respectively, was simultaneously measured
during the growth. The electrical properties of the sample are shown in Fig. 7. We were not able
to monitor the film resistance when it exceeded 1 M (at the beginning of the deposition, in
this case within the first 11 s) because the plasma conductivity has significantly affected these
measurements. The resistance of 205 was obtained in the final film of mass thickness d ∼ 9 nm.
The obtained resistance is much higher than that of the bulk sample of equivalent mass thickness,
which would be 2 . This difference is due to electron scattering on surface grains, which plays
a dominant role in thin films.18
In order to explain resistivity behavior of the obtained Al ultrathin films, other effects and
conduction mechanism, i.e., quantum tunnelling and thermionic emission, must be considered.9
We observed nonlinear I–V curves in ultrathin films with d < 10 nm, which can be attributed
to these effects. The I–V curve nonlinearity was exceedingly pronounced for the film of
d ∼ 4.7 nm prepared at PRF = 50 W, as can be seen in Fig. 8, where the I–V curves mea-
sured for films prepared at PRF = 50 W and PRF = 200 W are displayed. The obtained optical
12
PRF= 200 W
8
PRF= 50 W
4
Voltage (V)
0
-4
-8
-12
-2.0µ -1.0µ 0.0 1.0µ 2.0µ
Current (A)
Fig. 8 I–V curve measured in Al ultrathin films of mass thickness of d ∼ 4.5 nm and d ∼ 4.7 nm
prepared at PRF = 200 W and PRF = 50 W, respectively.
Journal of Nanophotonics 051503-7 Vol. 5, 2011
Downloaded From: https://www.spiedigitallibrary.org/journals/Journal-of-Nanophotonics on 14 Aug 2021
Terms of Use: https://www.spiedigitallibrary.org/terms-of-useNovotny et al.: In-situ monitoring of the growth of a nanostructured aluminum thin film
Fig. 9 Morphology of Al ultrathin film prepared at: (a) PRF = 200 W (mass thickness of d ∼ 4.5 nm)
and (b) PRF = 50 W (mass thickness of d ∼ 4.7 nm).
(Fig. 6) and electrical (Fig. 8) properties accordingly suggest that the nanostructure of the film
deposited at PRF = 50 W and that deposited at PRF = 200 W must be different.
3.4 Morphology and Microstructural properties
The dependence of Al film morphology on the film mass thickness from
d ∼ 4.5 nm to d ∼ 200 nm for films prepared at PRF = 200 W revealed increasing grain
size from 10 to 100 nm. The surface of the film of d ∼ 4.5 nm, shown in Fig. 9 was found semi-
continuous, while that of the films of d > 9 nm prepared at the same deposition rate exhibited
Journal of Nanophotonics 051503-8 Vol. 5, 2011
Downloaded From: https://www.spiedigitallibrary.org/journals/Journal-of-Nanophotonics on 14 Aug 2021
Terms of Use: https://www.spiedigitallibrary.org/terms-of-useNovotny et al.: In-situ monitoring of the growth of a nanostructured aluminum thin film
continuous character. We found a very different morphology of Al ultrathin films of comparable
mass thicknesses deposited at PRF = 200 W (d ∼ 4.5 nm) and PRF = 50 W (d ∼ 4.7 nm), whose
SEM images are shown in Fig. 9. The film prepared at PRF = 50 W (growth rate of 0.12 nm
s−1 ) shown in Fig. 9(b) exhibited semicontinuous structure with particulates of irregular shape
with an average size of 50 nm. Substantial differences of nanostructure of the film deposited
at PRF = 200 W and PRF = 50 W, observed in Figs. 9(a) and 9(b), respectively, explain the
discrepancy in the optical properties (shown in Fig. 6) and electrical properties (nonlinear I–V
curve presented in Fig. 8) of the film deposited at high and low growth rate.
At a high growth rate (0.45 nm s−1 at PRF = 200 W) the film growth stays in the nucleation
stage, i.e., a high nucleation density, and a continuous film in an earlier stage was observed.
During the nucleation stage, the growth parallel to the substrate exceeds the growth normal to
the substrate, while the opposite is true during the coalescence stage. The tendency to form
nanoparticulated semicontinuous Al film is also enhanced by low deposition temperature, i.e.,
room temperature, when the nuclei do not possess enough energy to move along the surface and
need a longer time to coalesce with other nuclei into islands.
4 Conclusion
The growth processes of nanostructured aluminum thin films in a RF magnetron sputtering depo-
sition system were in-situ characterized by mass spectroscopy, optical emission spectroscopy,
spectral ellipsometry, and electrical measurements. Magnetron plasma, in the vicinity of the
substrate, contains aluminum ions Al+ , Al2+ , Al2 + , argon ions Ar+ , Ar2+ , Ar2 + and radicals
AlAr+ as well as excited aluminum atoms Al*. The in-situ monitoring of optical and electrical
properties allowed us to distinguish fine modifications of Al film nanostructure. We were able
to determine the growth mode in real-time and to estimate the percolation threshold of the
growing aluminum layer. We found different optical, electrical and microstructural properties
of the ultrathin aluminum films of equivalent mass thickness ∼4.5 nm prepared at deposition
rates of 0.45 nm s−1 and 0.12 nm s−1 , at RF power of 200 and 50 W, respectively. The position
of the localized plasmon peak in the film grown at RF power of 50 W was shifted more into
the UV spectral range, and a considerably nonlinear shape of I–V curves, compared to the film
prepared at RF power of 200 W, was obtained. The lower deposition rate resulted in semicon-
tinuous film morphology with well pronounced nanoparticulates of dimension around 50 nm.
Our experiments demonstrated that the nanostructure of aluminum ultrathin film can be simply
controlled by variation of the RF power.
Acknowledgments
The research was supported by the Czech Science Foundation, project GP202/09/P324 and the
Grant Agency of the Academy of Sciences of the Czech Republic, projects: AVOZ 10100522,
IAA100100718, and IAA100100729. The authors thank VAKUUM Praha for support of
this research. We are also indebted to Dr. Chvostova and Dr. Slechtova for film thickness
measurements.
References
1. I. Gryczynski, J. Malicka, Z. Gryczynski, K. Nowaczyk, and J. R. Lakowicz, “Ultraviolet
surface plasmon-coupled emission using thin aluminum films,” Anal. Chem. 76, 4076–4081
(2004).
2. K. Ray, M. H. Chowdhury, and J. R. Lakowicz, “Aluminum nanostructured films as sub-
strates for enhanced fluorescence in the ultraviolet-blue spectral region,” Anal. Chem. 79,
6480–6487 (2007).
Journal of Nanophotonics 051503-9 Vol. 5, 2011
Downloaded From: https://www.spiedigitallibrary.org/journals/Journal-of-Nanophotonics on 14 Aug 2021
Terms of Use: https://www.spiedigitallibrary.org/terms-of-useNovotny et al.: In-situ monitoring of the growth of a nanostructured aluminum thin film
3. M. H. Chowdhury, K. Ray, and J. R. Lakowicz, “Use of aluminum films as substrates for
enhanced fluorescence in the ultraviolet-blue spectral region,” Proc. SPIE 6869, 68690E
(2008).
4. J. J. G. P. Loo, “Nucleation and growth of PVD aluminum,“ Nat. Lab. Unclassified Report
Philips Electronics N.V., Vol. 807/98 (1998).
5. H. Du, J. Gong, C. Sun, S. W. Lee, and L. S. Wen,” Carrier density anddc conductivity of
ultrathin aluminum films,” J. Mater. Sci. 39, 2865–2867 (2004).
6. H. Du, J. Q. Xiao, Y. S. Zou, T. G. Wang, J. Gong, C. Sun, and L. S. Wen,” Optical
properties of ultrathin aluminum films deposited by magnetron sputtering in visible band,”
Opt. Mater. 28, 944–949 (2006).
7. H. V. Nguyen, I. An, and R. W. Collins, “Evolution of the optical functions of aluminum
films during nucleation and growth determined by real-time spectroscopic ellipsometry,”
Phys. Rev. Lett. 68, 994–997 (1992).
8. R. C. Weast, Handbook of Chemistry and Physics, 1974–1975, 55th ed., CRC Press,
Cleveland, OH (1974).
9. I. M. Rycroft, and B. L. Evans, “The in situ characterization of metal film resistance during
deposition,” Thin Solid Films 290–291, 283–288 (1996).
10. J. Bulir, M. Novotny, P. Pokorny, J. Lancok, J. Musil, and J. Nahlik, “High rate reactive
magnetron sputtering of alumina coatings,” E-MRS Spring Meeting Proc. E-MRS Spring
Meeting, Strasbourg, France 6–18 (2009).
11. P. Pokorny, M. Novotny, J. Bulir, J. Lancok, M. Misina, and J. Musil, “Study of processes
in a pulsed magnetron Ar/O2 plasma by mass spectrometry,” Proc. 35th EPS Conference
on Plasma Phys. ECA, Vol. 32, 5.142 (2008).
12. P. Pokorny, J. Bulir, J. Lancok, J. Musil, and M. Novotny, “Generation of positive and
negative oxygen ions in magnetron discharge during reactive sputtering of alumina,” Plasma
Process. Polym. 7, 910–914 (2010).
13. M. Novotny, J. Bulir, P. Pokorny, J. Bocan, P. Fitl, J. Lancok, and J. Musil, “Optical
emission and mass spectroscopy of plasma processes in reactive dc pulsed magnetron
sputtering of aluminum oxide,” J. Optoelectron. Adv. Mater. 12, 697–70 (2010).
14. H. Kersten, G. M. W. Kroesen, and R. Hippler, “On the energy influx to the substrate during
sputter deposition of thin aluminum films,” Thin Solid Films 332, 282–289 (1998).
15. T. Mehdi, P. B. Legrand, J. P. Dauchot, M. Wautelet, and M. Hecq, “Optical emission
diagnostics of an rf magnetron sputtering discharge,” Spectrochim Acta B 48, 1023–1033
(1993).
16. H. G. Tompkins and E. A. Irene, Handbook of ellipsometry, William Andrew, Inc., Norwich
NY (2005).
17. B. Johs and J. S. Hale, “Dielectric function representation by B-splines,” Phys. Status Solid
A 205, 715–719 (2008).
18. A. F. Mayadas and M. Shazkes, “Electrical-resistivity model for polycrystalline films: the
case of arbitrary reflection at external surfaces,” Phys. Rev. B 1, 1382–1389 (1970).
Biographies and photographs of the authors not available.
Journal of Nanophotonics 051503-10 Vol. 5, 2011
Downloaded From: https://www.spiedigitallibrary.org/journals/Journal-of-Nanophotonics on 14 Aug 2021
Terms of Use: https://www.spiedigitallibrary.org/terms-of-useYou can also read


