Low Productivity Growth and Sovereign Debt Sustainability
←
→
Page content transcription
If your browser does not render page correctly, please read the page content below

Peterson Institute for International Economics, Washington DC, 9 November 2017

Low Productivity Growth and
Sovereign Debt Sustainability
Elena Duggar, Chair of Moody’s Macroeconomic Board,                   November 2017
Associate Managing Director, Credit Strategy & Research
Agenda
1. Low productivity growth is dampening the economic
   outlook globally, with further downside risks
2. Low productivity growth is raising challenging
   questions about sovereign debt sustainability in a
   world of historically-high debt levels:
   • How will low productivity growth impact the interest rate-
     growth differential, budget deficits, and the materialization
     of contingent liabilities?
   • What is a sustainable level of debt in a QE or secular
     stagnation environment?
   • Is demographics the most important credit driver given the
     unprecedented fiscal challenges?

                                                    November 2017    2
Low productivity
1
growth is dampening
the economic outlook
globally, with further
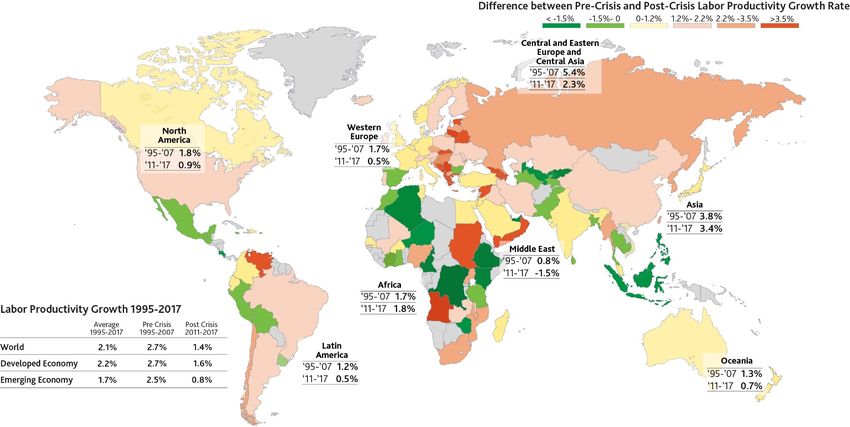
downside risksThe collapse of productivity growth is
global and persistent
Emerging Economy
Developed Economy
Source: Moody’s Investors Service, Global Macro Risks: Collapse of Global Productivity Growth Remains Sizeable Risk to Credit Conditions, The Conference Board Total Economy Database™ (Adjusted
version), May 2017
November 2017 4Given demographics, low productivity
growth is dampening global prospects
Despite cyclical upturn, global growth post-crisis remains significantly lower than in the pre-crisis period
Global Real GDP (Y-o-Y, % Change) 1995-2007 Average, 4.7% 2011-2015 Average, 3.4%
7.0%
6.0%
5.0%
4.0%
3.0%
2.0%
1.0%
0.0%
-1.0%
1995 1996 1997 1998 1999 2000 2001 2002 2003 2004 2005 2006 2007 2008 2009 2010 2011 2012 2013 2014 2015 2016 2017 2018 2019 2020 2021
Global Employment (Y-o-Y, % Change) Global Output per Worker (Y-o-Y, % Change)
3.5%
1995-2007 Average, 2.1% 5.0% 1995-2007 Average, 2.7%
2011-2015 Average, 1.7% 2011-2015 Average, 1.8%
3.0% 4.0%
2.5% 3.0%
2.0% 2.0%
1.5% 1.0%
1.0% 0.0%
0.5% -1.0%
0.0% -2.0%
1995
1996
1997
1998
1999
2000
2001
2002
2003
2004
2005
2006
2007
2008
2009
2010
2011
2012
2013
2014
2015
2016
2017
2018
2019
2020
2021
1995
1996
1997
1998
1999
2000
2001
2002
2003
2004
2005
2006
2007
2008
2009
2010
2011
2012
2013
2014
2015
2016
2017
2018
2019
2020
2021
Source: Moody’s Investors Service, Global Macro Risks: Collapse of Global Productivity Growth Remains Sizeable Risk to Credit Conditions, International Labour Organization.
Note: Exhibits are unweighted average across 122 countries.
November 2017 5Further sizeable downside risks to
potential growth forecasts
» We have a favorable near-term growth outlook and we expect productivity growth to
recover somewhat in 2017-18 driven by a rebound in aggregate demand and investment
» However, given demographic pressures and declining working-age population, lower
productivity growth would imply large downside risk to growth forecasts
Global GDP growth under scenarios of lower labor productivity growth
Baseline Scenario: Moody's
7.0% Scenario 1: Labor productivity grows at the avg. 2011-2015 (1.8%)
Scenario 2: Labor productivity grows at 2016 pace (1.4%)
6.0%
5.0%
4.0%
3.0%
2.0%
1.0%
0.0%
-1.0%
2005 2006 2007 2008 2009 2010 2011 2012 2013 2014 2015 2016 2017 2018 2019 2020 2021
Source: Moody’s Investors Service, Global Macro Risks: Collapse of Global Productivity Growth Remains Sizeable Risk to Credit Conditions, International Labour Organization.
Note: Exhibits are unweighted average across 122 countries.
November 2017 6Low productivity
2
growth is raising
challenging questions
about sovereign debt
sustainabilityHow will low productivity growth impact
sovereign debt sustainability?
» Three main drivers of sovereign debt build-up: primary deficits, the materialization of
contingent liabilities and the interest rate-growth differential, with large debt build-ups
typically coming from the first two factors
Debt-creating flows (in percent of GDP)
US Japan
Residual Other debt-creating flows Residual Other debt-creating flows
Contribution from real GDP growth Contribution from real interest rate Contribution from real GDP growth Contribution from real interest rate
Primary deficit Primary deficit
20 20
15 15
10 10
5 5
0 0
-5 -5
-10 -10
2002 2004 2006 2008 2010 2012 2014 2016 2002 2004 2006 2008 2010 2012 2014 2016
Source: Moody’s Investors Service, IMF
November 2017 8What will low productivity growth mean
for the risk of financial crises?
» The materialization of contingent liabilities has lead to an average of 4.1 pp annual
increases in debt to GDP levels across countries
» Financial sector crises represent the biggest risk to sovereign balance sheets. Lower
growth and lower rates are generally both negative for the banking system
Realizations of contingent liabilities have material fiscal impact on sovereign balance sheets
Developed Markets Emerging Markets
60 60
Financial
50 50 Natural Sector
Disaster(s)
Number of Episodes
Number of Episodes
40 Financial 40
Sector
30 PPPs 30
Natural SOEs
20 Disaster(s) 20 Subnational
Private Non- Government
10 Financial Sector 10 PPPs
SOEs Legal
Legal Other Private Non-
Subnational Government Financial Sector
0 Other 0
0 2 4 6 8 10 0 2 4 6 8 10 12
Avg. Fiscal Costs (% of GDP) Avg. Fiscal Costs (% of GDP)
Source: IMF, 2016, Bova et al., The Fiscal Costs of Contingent Liabilities: A New Dataset, IMF Working Paper WP/16/14, Moody’s Investors Service, Sovereign Contingent Liabilities: Public Enterprises
Represent a Material Source of Fiscal Risk to Some Sovereigns
November 2017 9What is a “sustainable” level of debt?
» Historically, sovereign defaults have occurred at a wide range of debt-to-GDP ratios
» In a world of historically-high debt levels, how relevant are traditional debt thresholds like
the IMF’s 90% and 60% debt to GDP thresholds for ADV and EM countries? Should debt
thresholds be adjusted up over time?
Sovereign defaults have occurred at high as well as low debt to GDP ratios (%)
200.0
180.0
160.0
140.0
120.0
100.0 84.2
80.0
60.0
40.0
20.0
0.0
Jamaica
Jamaica
Russia
Paraguay
Belize
Ukraine
Dominican Rep.
Belize
Ukraine
Mozambique
Moldova
Dominica
Cote d'Ivoire
Pakistan
Cote d'Ivoire
Uruguay
Cyprus
Nicaragua
Grenada
Seychelles
Greece
Greece
Argentina
Ecuador
Argentina
Ecuador
St.Kitts and Nevis
Aug- Sep- Jul- Aug- Mar- Nov- Jun- Jan- May- Jul- Jul- Dec- May- Dec- Jul- Dec- Feb- Jan- Nov- Mar- Sep- Dec- Feb- Jul- Jul- Oct- Apr-
98 98 99 99 00 01 02 03 03 03 03 04 05 06 08 08 10 11 11 12 12 12 13 13 14 15 16
Source: Moody’s Investors Service, Sovereign Defaults Series - The Aftermath of Sovereign Defaults - October 2013
November 2017 10What is a “sustainable” level of debt in a
QE or secular stagnation environment?
» What happens to fiscal space as central banks hold increasing amounts of government
bonds? For example, the Bank of Japan holds 40% of JGBs as of Q1 2017, which is
equivalent to 87% of GDP
» Should credit analysis put more weight on the combined fiscal space of the government
plus the central bank?
Sovereign bond holdings by Bank of Japan vs. others over time (% of GDP)
Japan Estimated Ownership of JGB (Mar.2017)
200.0
held by
160.0 central bank
held by 39.4%
financial
120.0 institutions
42.7%
held by
80.0 nonfinancial corps
0.9%
Non-NCB Holdings/GDP, %
40.0
NCB Holdings/GDP, % held by social
held by security
0.0 held by funds
held by private households
Q2/05
Q4/05
Q2/06
Q4/06
Q2/07
Q4/07
Q2/08
Q4/08
Q2/09
Q4/09
Q2/10
Q4/10
Q2/11
Q4/11
Q2/12
Q4/12
Q2/13
Q4/13
Q2/14
Q4/14
Q2/15
Q4/15
Q2/16
Q4/16
Q2/17
1.2% 4.6%
overseas investors
10.7% 0.2%
Source: Moody’s Investors Service, Monetary Policy - US, Euro Area, Japan: FAQ on central bank policy normalization likely to proceed without market disruption, Haver Analytics
November 2017 11Is demographics the most important
credit driver?
» Europe and North America will remain the greyest regions, especially with the retiring of
the “baby-boom” generations. The US old age dependency ratio will double by 2050
» Demographic shifts will further dampen productivity growth and will create pressures on
health care and pension spending
Old-age dependency ratio (ratio of population aged 65+ per 100 population 15-64, %)
Africa Asia Europe Latin America and the Caribbean North America United States
60.0 *Estimates assuming medium
fertility variant, 2015 - 2100
50.0
40.0 US: 36.4
30.0
20.0
10.0
0.0
1950 1955 1960 1965 1970 1975 1980 1985 1990 1995 2000 2005 2010 2015 2020 2025 2030 2035 2040 2045 2050
Source: UN. Note: Age dependency ratio, old, is the ratio of older dependents (people older than 64) to the working-age population (those ages 15-64). Data are shown as the proportion of
dependents per 100 working-age population.
November 2017 12Demographic headwinds will present a
formidable fiscal challenge for the US
Projected health care (top) and pension (bottom) Projected cumulative increase in growth-adjusted
expenditure to GDP (2011-2050,%) health and pension expenditure to 2010 GDP (2011-
2050, %)
18 No excess cost
Health Care Expenditure
With historical excess cost Lower bound Upper bound
300
13
to GDP
250
Increased Expenditure to GDP
8
200
3
-2 150
2010 2020 2030 2040 2050
100
18 Pensions growing with wages
Pensions growing with GDP per employee
Pension Expenditure to
13 50
GDP
8 0
2010 2020 2030 2040 2050
3 Note: Lower bound scenario includes health care projection assuming zero excess
cost growth and pension projection assuming pensions growing with nominal
wages; while Upper bound scenario includes health care projection assuming
-2 historical excess cost growth and pension projection assuming pensions growing
2010 2020 2030 2040 2050 with GDP per employee.
Source: Moody’s Investors Service, Assessing Future Health- and Age-Related Government Expenditures in France, Germany, the UK and the US
November 2017 13The “optimistic” view on debt sustainability
Low productivity growth will have no effect or a positive
effect on sovereign debt sustainability (Mehrotra 2017):
» r < g in many advanced economies
» Even where r > g, the productivity slowdown reduces the differential by
pushing down r relative to g (in small open economies, domestic r is
closely linked to world r due to capital mobility, whereas domestic g is
less linked to world g)
» Going forward, r < g is likely to persist in most advanced countries,
except for some euro area economies, and as long as r < g, debt is on
a sustainable trajectory regardless of the debt-to-GDP ratio
» Furthermore, a low world r should continue to help countries with
autonomous g
Additional argument: central banks’ holdings of government
debt would further reduce rollover risk
November 2017 14The “pessimistic” view on debt sustainability
Low productivity growth will have a negative effect on
sovereign debt sustainability:
» r < g is not enough to ensure debt sustainability: historically, the most
important threats to debt sustainability come from increases in the
primary deficit and the materialization of contingent liabilities, both of
which become more likely with lower productivity growth (Dynan 2017)
» Further, even where r < g, there is a risk of reversion to r > g
» r > g in many emerging and frontier markets
» The r-g differential may not decline as the productivity slowdown is
global and not just in advanced economies (pushing down domestic g)
» Additionally, the unprecedented demographic transition will exacerbate
the decline in productivity growth and the pressure on primary budget
deficits
November 2017 15Appx. Additional Figures
Real growth contribution from changes
in employment and in labor productivity
for the US and Japan
Contribution to real GDP growth in the US                                           Contribution to real GDP growth in Japan

          Output per worker (y/y, % change)                                                  Output per worker (y/y, % change)
          Employment (y/y, % change)                                                         Employment (y/y, % change)
          Real GDP (y/y, % change)                                       Forecast            Real GDP (y/y, % change)                 Forecast
 6.0%                                                                                6.0%

 4.0%                                                                                4.0%

 2.0%                                                                                2.0%

 0.0%                                                                                0.0%

 -2.0%                                                                               -2.0%

 -4.0%                                                                               -4.0%

 -6.0%                                                                               -6.0%

 Source: Moody’s Investors Service, International Labour Organization.

                                                                                                                            November 2017    17
Immigration has been a vital source of
US working-age population growth
Net migration rate in US (per 1,000 population) Population growth in prime working age (25-54) by
nativity and US citizenship status (y/y change, %)
7.0 Net migration rate (per 1,000 population) Native Naturalized U.S. citizen Not a U.S. citizen
12.0
6.0
10.0
5.0
8.0
4.0
6.0
3.0
4.0
2.0
2.0
1.0
0.0
0
1950 - 1955
1955 - 1960
1960 - 1965
1965 - 1970
1970 - 1975
1975 - 1980
1980 - 1985
1985 - 1990
1990 - 1995
1995 - 2000
2000 - 2005
2005 - 2010
2010 - 2015
2015 - 2020
2020 - 2025
2025 - 2030
2030 - 2035
2035 - 2040
2040 - 2045
2045 - 2050
-2.0
-4.0
2005 2006 2007 2008 2009 2010 2011 2012 2013 2014
Source: Moody’s Investors Service, UN (left), US Census (right)
November 2017 18Moody’s Related Research
» Monetary Policy - US, Euro Area, Japan: FAQ on central bank policy normalization likely to proceed without
market disruption, September 2017
» Global Macro Risks – Collapse of Global Productivity Growth Remains Sizeable Risk to Credit Conditions,
May 2017
» Sovereign Contingent Liabilities: Public Enterprises Represent a Material Source of Fiscal Risk to Some
Sovereigns, January 2017
» Population Aging Will Dampen Economic Growth over the Next Two Decades, August 2014
» Sovereign Defaults Series - The Aftermath of Sovereign Defaults, October 2013
» Assessing Future Health- and Age-Related Government Expenditures in France, Germany, the UK and the
US, December 2011
» Topic Page: Sovereign Default Research
» Topic Page: Global Macro-Economic & Financial Risk Analysis
» Topic Page: Pensions and Retirement Benefits: Today's Promises, Tomorrow's Credit Challenges
November 2017 19Elena Duggar Chair of Moody’s Macroeconomic Board Associate Managing Director Credit Strategy & Research +1.212.553.1911 elena.duggar@moodys.com
This publication does not announce a credit rating action. For any credit ratings referenced in this publication, please see the ratings tab on the issuer/entity page on www.moodys.com for the most updated credit rating
  action information and rating history.

© 2017 Moody’s Corporation, Moody’s Investors Service, Inc., Moody’s Analytics, Inc. and/or their licensors          To the extent permitted by law, MOODY’S and its directors, officers, employees, agents, representatives,
and affiliates (collectively, “MOODY’S”). All rights reserved.                                                       licensors and suppliers disclaim liability for any direct or compensatory losses or damages caused to any
                                                                                                                     person or entity, including but not limited to by any negligence (but excluding fraud, willful misconduct or any
CREDIT RATINGS ISSUED BY MOODY'S INVESTORS SERVICE, INC. AND ITS RATINGS AFFILIATES                                  other type of liability that, for the avoidance of doubt, by law cannot be excluded) on the part of, or any
(“MIS”) ARE MOODY’S CURRENT OPINIONS OF THE RELATIVE FUTURE CREDIT RISK OF ENTITIES,                                 contingency within or beyond the control of, MOODY’S or any of its directors, officers, employees, agents,
CREDIT COMMITMENTS, OR DEBT OR DEBT-LIKE SECURITIES, AND MOODY’S PUBLICATIONS MAY                                    representatives, licensors or suppliers, arising from or in connection with the information contained herein or
INCLUDE MOODY’S CURRENT OPINIONS OF THE RELATIVE FUTURE CREDIT RISK OF ENTITIES,                                     the use of or inability to use any such information.
CREDIT COMMITMENTS, OR DEBT OR DEBT-LIKE SECURITIES. MOODY’S DEFINES CREDIT RISK
AS THE RISK THAT AN ENTITY MAY NOT MEET ITS CONTRACTUAL, FINANCIAL OBLIGATIONS AS                                    NO WARRANTY, EXPRESS OR IMPLIED, AS TO THE ACCURACY, TIMELINESS, COMPLETENESS,
THEY COME DUE AND ANY ESTIMATED FINANCIAL LOSS IN THE EVENT OF DEFAULT. CREDIT                                       MERCHANTABILITY OR FITNESS FOR ANY PARTICULAR PURPOSE OF ANY SUCH RATING OR
RATINGS DO NOT ADDRESS ANY OTHER RISK, INCLUDING BUT NOT LIMITED TO: LIQUIDITY RISK,                                 OTHER OPINION OR INFORMATION IS GIVEN OR MADE BY MOODY’S IN ANY FORM OR MANNER
MARKET VALUE RISK, OR PRICE VOLATILITY. CREDIT RATINGS AND MOODY’S OPINIONS                                          WHATSOEVER.
INCLUDED IN MOODY’S PUBLICATIONS ARE NOT STATEMENTS OF CURRENT OR HISTORICAL
FACT. MOODY’S PUBLICATIONS MAY ALSO INCLUDE QUANTITATIVE MODEL-BASED ESTIMATES                                       Moody’s Investors Service, Inc., a wholly-owned credit rating agency subsidiary of Moody’s Corporation
OF CREDIT RISK AND RELATED OPINIONS OR COMMENTARY PUBLISHED BY MOODY’S                                               (“MCO”), hereby discloses that most issuers of debt securities (including corporate and municipal bonds,
ANALYTICS, INC. CREDIT RATINGS AND MOODY’S PUBLICATIONS DO NOT CONSTITUTE OR                                         debentures, notes and commercial paper) and preferred stock rated by Moody’s Investors Service, Inc. have,
PROVIDE INVESTMENT OR FINANCIAL ADVICE, AND CREDIT RATINGS AND MOODY’S                                               prior to assignment of any rating, agreed to pay to Moody’s Investors Service, Inc. for appraisal and rating
PUBLICATIONS ARE NOT AND DO NOT PROVIDE RECOMMENDATIONS TO PURCHASE, SELL, OR                                        services rendered by it fees ranging from $1,500 to approximately $2,500,000. MCO and MIS also maintain
HOLD PARTICULAR SECURITIES. NEITHER CREDIT RATINGS NOR MOODY’S PUBLICATIONS                                          policies and procedures to address the independence of MIS’s ratings and rating processes. Information
COMMENT ON THE SUITABILITY OF AN INVESTMENT FOR ANY PARTICULAR INVESTOR. MOODY’S                                     regarding certain affiliations that may exist between directors of MCO and rated entities, and between entities
ISSUES ITS CREDIT RATINGS AND PUBLISHES MOODY’S PUBLICATIONS WITH THE EXPECTATION                                    who hold ratings from MIS and have also publicly reported to the SEC an ownership interest in MCO of more
AND UNDERSTANDING THAT EACH INVESTOR WILL, WITH DUE CARE, MAKE ITS OWN STUDY AND                                     than 5%, is posted annually at www.moodys.com under the heading “Investor Relations — Corporate
EVALUATION OF EACH SECURITY THAT IS UNDER CONSIDERATION FOR PURCHASE, HOLDING,                                       Governance — Director and Shareholder Affiliation Policy.”
OR SALE.
                                                                                                                     Additional terms for Australia only: Any publication into Australia of this document is pursuant to the
MOODY’S CREDIT RATINGS AND MOODY’S PUBLICATIONS ARE NOT INTENDED FOR USE BY                                          Australian Financial Services License of MOODY’S affiliate, Moody’s Investors Service Pty Limited ABN 61
RETAIL INVESTORS AND IT WOULD BE RECKLESS AND INAPPROPRIATE FOR RETAIL INVESTORS                                     003 399 657AFSL 336969 and/or Moody’s Analytics Australia Pty Ltd ABN 94 105 136 972 AFSL 383569
TO USE MOODY’S CREDIT RATINGS OR MOODY’S PUBLICATIONS WHEN MAKING AN                                                 (as applicable). This document is intended to be provided only to “wholesale clients” within the meaning of
INVESTMENT DECISION. IF IN DOUBT YOU SHOULD CONTACT YOUR FINANCIAL OR OTHER                                          section 761G of the Corporations Act 2001. By continuing to access this document from within Australia, you
PROFESSIONAL ADVISER.                                                                                                represent to MOODY’S that you are, or are accessing the document as a representative of, a “wholesale
                                                                                                                     client” and that neither you nor the entity you represent will directly or indirectly disseminate this document or
ALL INFORMATION CONTAINED HEREIN IS PROTECTED BY LAW, INCLUDING BUT NOT LIMITED TO,                                  its contents to “retail clients” within the meaning of section 761G of the Corporations Act 2001. MOODY’S
COPYRIGHT LAW, AND NONE OF SUCH INFORMATION MAY BE COPIED OR OTHERWISE                                               credit rating is an opinion as to the creditworthiness of a debt obligation of the issuer, not on the equity
REPRODUCED, REPACKAGED, FURTHER TRANSMITTED, TRANSFERRED, DISSEMINATED,                                              securities of the issuer or any form of security that is available to retail investors. It would be reckless and
REDISTRIBUTED OR RESOLD, OR STORED FOR SUBSEQUENT USE FOR ANY SUCH PURPOSE, IN                                       inappropriate for retail investors to use MOODY’S credit ratings or publications when making an investment
WHOLE OR IN PART, IN ANY FORM OR MANNER OR BY ANY MEANS WHATSOEVER, BY ANY                                           decision. If in doubt you should contact your financial or other professional adviser.
PERSON WITHOUT MOODY’S PRIOR WRITTEN CONSENT.
                                                                                                                     Additional terms for Japan only: Moody's Japan K.K. (“MJKK”) is a wholly-owned credit rating agency
All information contained herein is obtained by MOODY’S from sources believed by it to be accurate and               subsidiary of Moody's Group Japan G.K., which is wholly-owned by Moody’s Overseas Holdings Inc., a
reliable. Because of the possibility of human or mechanical error as well as other factors, however, all             wholly-owned subsidiary of MCO. Moody’s SF Japan K.K. (“MSFJ”) is a wholly-owned credit rating agency
information contained herein is provided “AS IS” without warranty of any kind. MOODY'S adopts all                    subsidiary of MJKK. MSFJ is not a Nationally Recognized Statistical Rating Organization (“NRSRO”).
necessary measures so that the information it uses in assigning a credit rating is of sufficient quality and from    Therefore, credit ratings assigned by MSFJ are Non-NRSRO Credit Ratings. Non-NRSRO Credit Ratings are
sources MOODY'S considers to be reliable including, when appropriate, independent third-party sources.               assigned by an entity that is not a NRSRO and, consequently, the rated obligation will not qualify for certain
However, MOODY’S is not an auditor and cannot in every instance independently verify or validate                     types of treatment under U.S. laws. MJKK and MSFJ are credit rating agencies registered with the
information received in the rating process or in preparing the Moody’s publications.                                 Japan Financial Services Agency and their registration numbers are FSA Commissioner (Ratings) No. 2
                                                                                                                     and 3 respectively.
To the extent permitted by law, MOODY’S and its directors, officers, employees, agents, representatives,
licensors and suppliers disclaim liability to any person or entity for any indirect, special, consequential, or      MJKK or MSFJ (as applicable) hereby disclose that most issuers of debt securities (including corporate and
incidental losses or damages whatsoever arising from or in connection with the information contained herein          municipal bonds, debentures, notes and commercial paper) and preferred stock rated by MJKK or MSFJ (as
or the use of or inability to use any such information, even if MOODY’S or any of its directors, officers,           applicable) have, prior to assignment of any rating, agreed to pay to MJKK or MSFJ (as applicable) for
employees, agents, representatives, licensors or suppliers is advised in advance of the possibility of such          appraisal and rating services rendered by it fees ranging from JPY200,000 to approximately
losses or damages, including but not limited to: (a) any loss of present or prospective profits or (b) any loss or   JPY350,000,000.
damage arising where the relevant financial instrument is not the subject of a particular credit rating assigned
by MOODY’S.                                                                                                          MJKK and MSFJ also maintain policies and procedures to address Japanese regulatory requirements.

                                                                                                                                                                                         November 2017                            21
You can also read