BIS Bulletin No 10 - Bank for International ...
←
→
Page content transcription
If your browser does not render page correctly, please read the page content below
BIS Bulletin
                                                No 10

Covid-19 and corporate sector liquidity

Ryan Banerjee, Anamaria Illes, Enisse Kharroubi and José-Maria
Serena

28 April 2020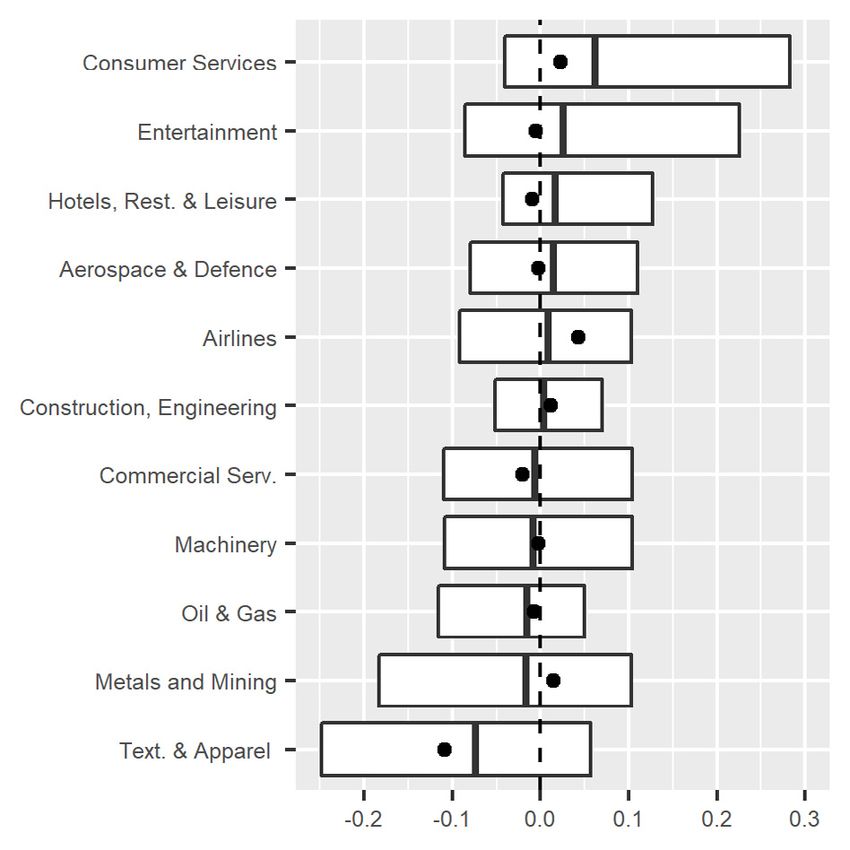
BIS Bulletins are written by staff members of the Bank for International Settlements, and from time to
time by other economists, and are published by the Bank. The papers are on subjects of topical interest
and are technical in character. The views expressed in them are those of their authors and not
necessarily the views of the BIS. The authors are grateful to Louisa Wagner for administrative support.

The editor of the BIS Bulletin series is Hyun Song Shin.

This publication is available on the BIS website (www.bis.org).

©   Bank for International Settlements 2020. All rights reserved. Brief excerpts may be reproduced or
    translated provided the source is stated.

ISSN: 2708-0420 (online)
ISBN: 978-92-9259-376-6 (online)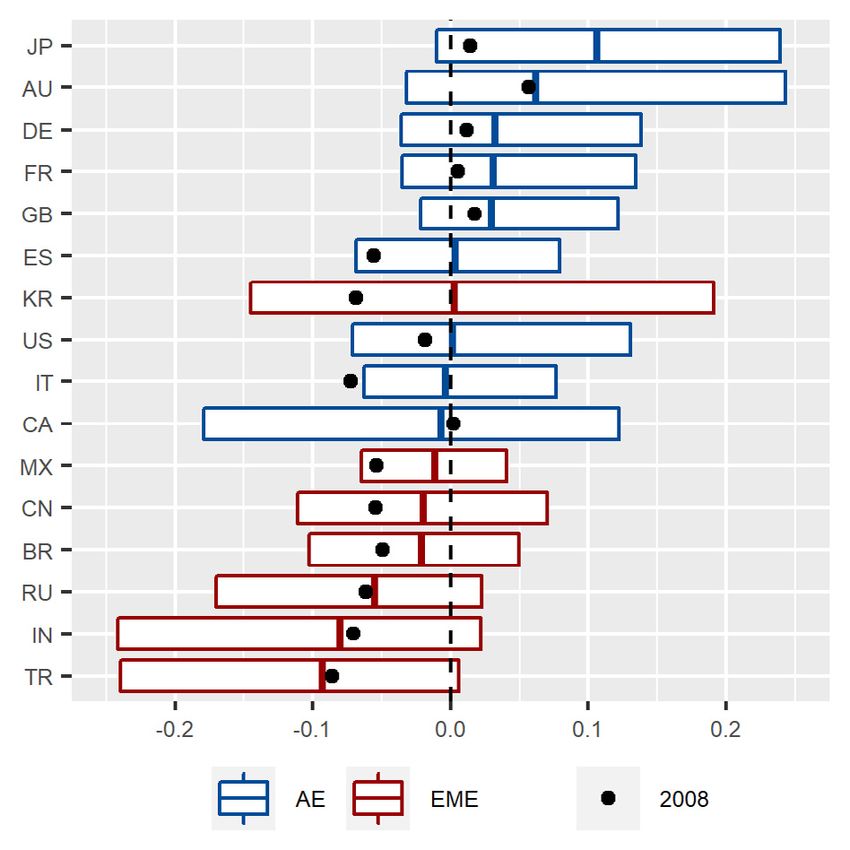
Ryan Banerjee            Anamaria Illes           Enisse Kharroubi          Jose Maria Serena
        Ryan.Banerjee@bis.org    Anamaria.Illes@bis.org    Enisse.Kharroubi@bis.org        Jose.Serena@bis.org

Covid-19 and corporate sector liquidity

Key takeaways
•     The Covid-19 shock is placing enormous strains on corporates cash buffers. Corporate financial
      statements from 2019 suggest that 50% of firms do not have sufficient cash to cover total debt
      servicing costs over the coming year.
•     Credit lines could provide firms with additional liquidity. On average undrawn credit stood
      around 120% of debt servicing costs at end 2019. However, access is uneven and banks may
      be reluctant to renew or extend them in the current environment.
•     Sticky operating expenses result in many firms running operating losses, placing an additional
      burden on cash buffers. Estimates indicate that following a 10% drop in revenues, operating
      expenses only fall by 6% on average.
•     Simulations suggest that if revenues fall by 25% in 2020, then closing the entire funding gap
      with debt would raise firm leverage by around 10 percentage points.

No other recession in modern times has hit the corporate sector on a global scale as badly as the Covid-19
shock. Firms are now facing unprecedentedly large declines in revenues as nation-wide lockdowns are
imposed to safeguard public health. The ability of firms to withstand these exceptional circumstances will
determine whether the Covid-19 recession leaves a lasting scar on economic activity through widespread
corporate bankruptcies.
     In the short-run, the Covid-19 shock challenges corporate liquidity by impairing corporate cash flows,
which will likely go deeply negative for many firms as they are unable to cut their costs in line with plunging
revenues. In addition, a number of factors compound this problem. First, facing restrictions on commercial
activity, firms may struggle to sell existing inventories, or even borrow against them. Second, trade credit
can freeze as firms seek to defer payments; depriving the corporate sector of a vital source of lubrication
which keeps it ticking. Third, existing credit lines could provide firms with additional resources to help
them meet short-term liquidity needs. However, credit lines often have a short-maturity and under the
current stressed conditions banks may be reluctant to renew them.
     Taken together, these factors are placing enormous strains on corporate cash buffers. Based on a
sample of 40,000 listed and large unlisted non-financial firms across 26 advanced and emerging
economies, with aggregate revenues totalling around 60% of GDP in the median economy (see Online
Annex Table A1), this Bulletin estimates that if 2020 revenues fall by 25%, then in the absence of any roll-
over, debt service and operating expenses will exceed cash buffers and revenues in more than half of the
firms sampled. Given this challenge, there is a strong case for policy interventions to avoid the negative
consequences for the real economy and financial markets (Carstens (2020)).

BIS Bulletin                                                                                                  1
Corporate sector liquidity

Under the current lockdown, conventional accounting measures of corporate liquidity are likely to give a
misleading impression. This may apply to the current ratio which measures the liquidity buffer as the gap
between a firm’s liquid assets (inventories, accounts receivable, cash and short-term investments) and its
current liabilities (accrued liabilities,1 accounts payable and debt maturing within the coming year).
     At the current juncture cash is clearly the king of liquid assets. With social distancing measures
restricting commercial activity, the liquidity of inventories appears limited. Moreover, repayment of trade
credit (accounts receivable) can become frozen in stressed periods as firms seek to defer payments.
    Similarly, debt maturing within one year plus interest payments may be a better measure of the
minimum short-term liabilities that corporates need to meet during this stressed period. Not least because
defaulting on debts often triggers additional consequences such as collateral seizure and ratings
downgrades that challenge corporate survival further. Payments for other current liabilities, e.g. payables,
may be seen as less pressing.2 The flip side of frozen trade credit and delays in paying accrued expenses
such as rents also reduces the drain on corporate cash buffers from these items, at least temporarily.

Debts coming due in 2020 exceed cash buffers in many firms
Cash minus debt service, scaled by total assets1                                                                                     Graph 1

By country                                                              By sector

1
 Box plot showing median, 25th and 75th percentile of cash (cash, equivalents and short-term investments) minus debt service (short-term
debt + current portion of long-term debt + interest expenses) as a ratio of total assets for firms with either debt falling due in 2020 or with
positive interest expenses. Box plots based on 2019 data. Black dots show median ratios for 2008.

Sources: S&P Capital IQ; BIS calculations.

    Therefore, in current circumstances the net liquid asset position of a firm may be better captured by
the difference between its cash3 and its debt servicing costs falling due in one year4 (Graph 1). This gap

1
      Accrued expenses are expenses for goods and services that have already been delivered but not paid yet.
2
      Usually, bank debt is junior to only government taxes and staff wages and salaries, but senior relative to all other liabilities.
3
      Cash is defined as cash and equivalents plus short-term investments.
4
      Debt servicing costs falling due in one year defined as principal and interest payments for all debt liabilities falling due in one
      year.

2                                                                                                                                  BIS Bulletin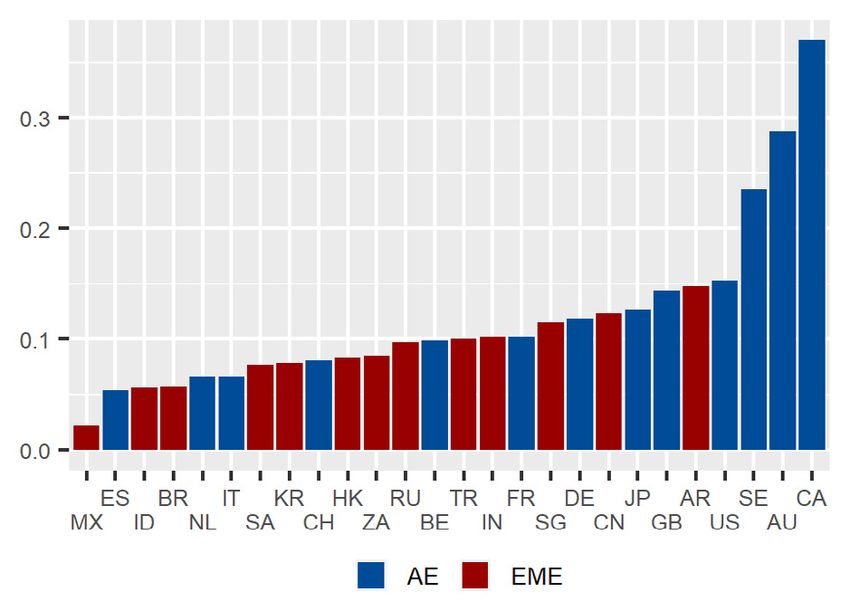
indicates that at the end of 2019 and in all economies considered, at least 25% of firms did not hold
enough cash to cover all debt obligations falling due in 2020. That said, corporate liquidity positions
generally appear stronger than they were in 2008 before the Great Financial Crisis (black dots); a
consequence of the rise in corporate cash holdings in many economies since the mid-2000s (Dao and
Maggi (2018)).
     There is however, significant heterogeneity across countries and firms. Countries with higher inflation,
where the opportunity cost of holding cash is high, such as Argentina, India, Russia and Turkey have the
lowest ratios, while those with histories of very low inflation such as Japan and Switzerland have some of
the highest (Graph 1, left-hand panel). Among advanced economies, the quarter of Canadian and United
States corporates with the lowest liquidity ratios, stand out as particularly low. This may reflect the greater
prevalence of credit lines (discussed below). Turning to industries which have experienced relatively steep
declines in equity prices in recent weeks, the ability of the textile and commodity sectors to service their
debts from cash appears particularly limited (Graph 1, right-hand panel). For example, for 25% of firms in
the oil and gas sector cash holdings would barely cover one month’s debt servicing costs.

Additional liquidity from credit lines

Some have argued that firms should prefer credit lines to cash holdings for liquidity (Holmstrom and Tirole
(1998)). Indeed, liquidity available from existing credit lines is large. In 2019, the median firm in many
economies sampled had access to undrawn credit that was in excess of total debt service falling due in
one year (Graph 2, left hand panel). Credit lines could therefore make-up for the illiquidity of inventories
and receivables that cannot, given current circumstances, easily be cashed in.

Undrawn credit lines are large relative to debt service in 20201,2                                                             Graph 2

Undrawn credit lines to debt service: by country                     Undrawn credit lines to debt service: by sector

1
  Box plots showing median, 25th and 75th percentile of the ratio of undrawn credit as a share of debt service (short-term debt + current
portion of long-term debt + interest expenses); undrawn credit excludes commercial paper programs. 2 Data reported for at least one
quarter in 2019. Based on a more limited set of firms which report undrawn credit. See Table A1 for more details on coverage.

Sources: S&P Capital IQ; BIS calculations.

    Indeed, economies with low cash to short-term debt ratios such as the United States, Canada and
Russia all have higher amounts of undrawn credit available to the median firm. A similar pattern holds
across industries, where the median firm in the oil and gas and energy equipment sectors have credit lines

BIS Bulletin                                                                                                                            3
worth over 200% of debt falling due in one year (Graph 2, right-hand panel). Yet, a number of issues may
complicate the recourse to credit lines.
     First, access to credit line commitments is very uneven. Undrawn credit in the median firms is around
120% of debt falling due in one year, but for a quarter of firms it is less than 40%. Within the syndicated
loan market, ten countries (all advanced economies) account for 95% of the firms with outstanding credit
lines; and US firms account for 60% of the total.
     Second, credit lines often have short residual maturities. For example, outstanding syndicated credit
lines have a residual maturity of 2.6 years, relative to 4.7 for term loans. On average, one firm out of five
with an outstanding credit line needs to renew it in 2020 (Online Annex Graph A1). Japanese corporations
stand out with a significantly larger share of short-term credit lines (about 60% of total credit lines) than
firms of other countries.5 By contrast, French firms have a sounder maturity profile. Credit lines maturing
in 2020 account for about 10% of the total and those maturing by 2021 represent about 30% of the total.
     Third, banks may be reluctant to renew credit line commitments. While major credit line providers are
currently well capitalised, their lending capacity may come under strain if firms massively draw down
existing credit lines. For instance, credit line commitments –drawn and undrawn- currently account for
23% of the total assets of the top 10 lead arranger banks, ranging from 7% all the way up to 35%.
Furthermore, banks when hit by a negative shock, typically tend to cut credit lines more aggressively than
corporate term loans. (Serena and Tsoukas (2020)).

Collapsing revenues create liquidity strains

The source of the corporate liquidity squeeze is the evaporation of corporate revenues in the face of
lockdowns and other public health actions that restrict commercial activity. In such a “stop the clock”
scenario, revenues and costs go down together, albeit not one-for-one, as firms cannot, in the short-run,
cut their cost base in line with plunging revenues. Inflows of cash are therefore bound to shrink abruptly,
forcing firms to burn highly valuable cash resources to cover their losses.

Declining revenues will further compound the liquidity problem1                                                                  Graph 3

Response of operating expenses to changes in revenues2                Ratio of total revenue to operating expenses3

1
  Operating income defined as total revenues less operating expenses. 2 Quarterly changes in log revenues and log operating expenses.
Smoothed grey lines of the elasticity estimated with a generalised additive model for 62 industries. Dashed line is 45 degree line. 3 Ratio
above (below) one indicates positive (negative) operating profit. Normal times assumption: Total revenue and operating expenses at 2019
levels. “Revenues down 25%” assumption: Total revenues down 25% compared with 2019 levels; 0.6 elasticity of operating costs to revenues.

Sources: S&P Capital IQ; BIS calculations.

5
      This said, Japanese firms were able to rollover credit lines in March, and Japanese banks arranged around 90% of these credit
      lines.

4                                                                                                                              BIS Bulletin
Empirical estimates of the elasticity of expenses to revenues confirm that across all the sectors, firms
have historically been unable to cut operating costs at the same rate as revenues decline (Graph 3, left
hand panel). Grey lines above the 45 degree line in bottom left-hand quadrant rather suggest an average
cost-revenue elasticity across sectors of about 0.6.6 A 25% decline in revenues would then shift the average
firm from a 16% operating profit to an 18% operating loss (Graph 3, right-hand panel). Cost-to-revenue
elasticities in three hard hit sectors -oil and gas, airlines and hotels, restaurants and leisure - are particularly
low, reflecting significant fixed costs in these high fixed asset industries.
Corporate resilience
Both the ability of firms to roll over debts and the size of their cash buffers will have strong influence on
their ability to cover operating losses and debt service obligations. To illustrate the point, assume a cost-
revenue elasticity of 0.6 and consider a scenario where 2020 revenues decline by 25% relative to 2019.
This could happen in several sectors if lock downs last for 3 months or if activity remains suppressed over
the year.7
If firms can roll over all their maturing debt in 2020,8 then around 40% of firms in the median country
would still be unable to cover their 2020 operating expenses and interest payments with their cash buffers
and revenues (Graph 4, left-hand panel). At the other extreme, if firms cannot roll-over any maturing debt,
the share of firms in the median economy unable to cover their 2020 operating expenses, interest
payments and debt falling due from their cash buffers and revenues would jump to 60%.
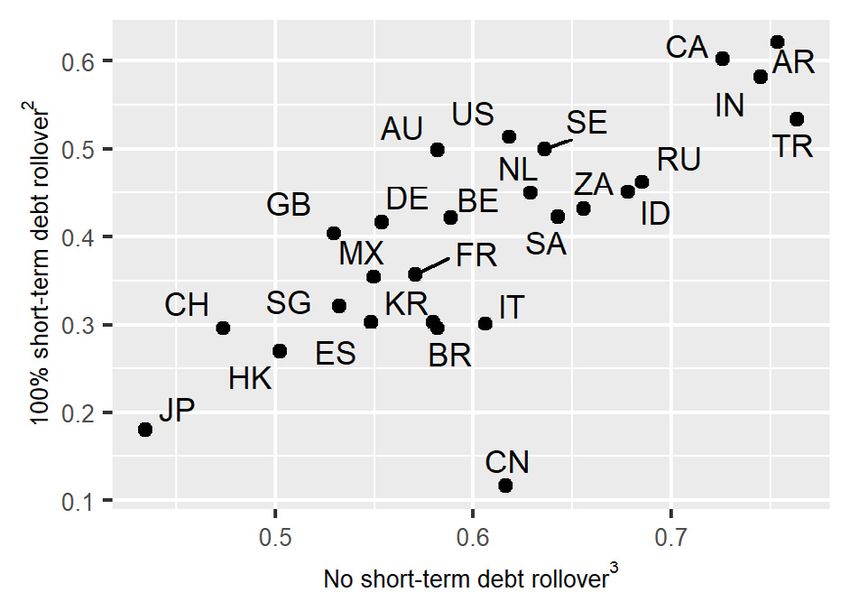
Most firms unable to sustain a prolonged fall in revenues Graph 4
Share of firms with positive funding gap1 Increase in the median leverage ratio if firms borrow to
fill funding gap4
1
Simulations based on firm revenues down 25% compared to 2019 and 0.6 elasticity of operating costs to revenue. 2 Percentage of firms in
simulation where (cash and short-term investments + total revenue *(1-0.25)) is less than (operating expenses*(1-0.25*0.6) + interest
expenses). 3 Percentage of firms in simulation where (cash and short-term investments + total revenue *(1-0.25)) is less than (operating
expenses*(1-0.25*0.6) +short-term debt + interest expenses). 4 Change in gross leverage in the median firm if raise debt to meet operating
losses. Gross leverage defined as total debt/total assets.
Sources: S&P Capital IQ; BIS calculations.
6
Moreover, the flattening slope shows that the elasticity tends to decline with larger revenue declines. Larger falls in revenues
therefore tend to reduce cash flows disproportionately and thereby impose greater liquidity strains on firms.
7
A 25% decline in revenues also appears consistent with the recent 8 to 9% downward revision of IMF GDP growth forecasts for
advance economies, as estimates indicate that a 1 percentage point downward revision in GDP growth forecasts is correlated
with in a 3% decline in firm revenues. Note that in these simulations we also assume that firms cannot discount accounts
receivable to receive credit (i.e. no factoring).
8
During the great recession, the median listed firm could roll over 100% its short-term debt. But for 25% of the firms, the rollover
fell to 70% or less.
BIS Bulletin 5
The simulation shows that cash buffers also make a significant difference. In Japan, where many firms
have large cash buffers, less than 20% of firms would be unable to cover operating losses and interest
payments in the 100% debt rollover scenario. This rises to around 60% of firms in Argentina, Canada and
India, all economies where many firms have relatively small cash buffers.
    Of course, corporate leverage would increase if firms fill their funding gaps with borrowed funds
(Graph 4, right-hand panel). The simulation suggests the corporate leverage would increase by around 10
percentage points in the median economy. In Canada and Australia, both economies with significant
commodity sectors, leverage could increase by around 30 percentage points in the median firm.

Policy options

Given the short-term challenges facing corporates, there is a strong case for policy intervention (Carstens
(2020)). Indeed, many governments have already taken bold action to avoid the negative consequences
for the real economy and financial markets. Arguably, it could have several legs.
     Most obvious, bridging loans would help ensure that the sudden stop to corporate cash-flows does
not lead firms to a near term default on operating expenses, wages and salaries, or short-term obligations.
However, such credit will increase corporate leverage, potentially creating solvency challenges further
down the road.
    Another leg are subsidies for firms in the hardest hit sectors, conditional on maintaining employment,
thus, stabilising income for wage earners and avoiding unnecessary lay-offs and firm bankruptcies.
Depending on how long this shutdown persists, these fiscal measures are likely to become increasingly
important relative to liquidity bridging operations. Yet such subsidies, if poorly designed, risk impairing
market dynamism.
     Relatedly, given the size of existing credit lines, authorities may need to develop policies to monitor
drawdowns and availability. Indeed, the March data on US bank balance sheets already suggests there
have been significant credit line drawdowns. One risk is that banks do not roll over expiring facilities. In
this regard, governments can ease the rollover of credit lines by providing guarantees or credit
enhancements. This would reduce bank capital needs when corporates use them.
     Last, mechanisms to prevent the seizing of trade credit would be important. For example, schemes
that help firms sell their receivables or receive credit against them, at least partly, may be needed. One
possibility would be for central banks to offer a facility where certain short-term claims collateralised with
specific types of assets can be rediscounted. Another would be for governments or a single government
related entity to take advantage of centralisation to net out trade credit assets and liabilities. To be sure,
such schemes would face limitations, not least in terms of moral hazard (manipulation of trade credit
accounts) and adverse selection (assets on most risky borrowers would be submitted first). But limiting
such a facility to firms which did pay taxes over previous years and have hence been profitable and to
assets and liabilities contracted prior to the virus outbreak could mitigate these limitations.

References

Carstens, A (2020): “Bold steps to pump coronavirus rescue funds down the last mile”, Op-ed published in
the Financial Times on 29 March 2020 https://www.bis.org/speeches/sp200330.htm.
Dao, MC, C Maggi (2018): “The Rise in Corporate Saving and Cash Holding in Advanced Economies:
Aggregate and Firm Level Trends.” Working Paper No. 18/262.
Holmstrom, B and J Tirole (1998): “Private and Public Supply of Liquidity,” Journal of Political Economy,
106, 1-40.
Serena, JM and S Tsoukas (2020): “International bank lending and corporate debt structure” BIS Working
Papers, No 857.

6                                                                                                    BIS Bulletin
Previous issues in this series
No 9 Buffering Covid-19 losses – the role of Mathias Drehmann, Marc Farag,
24 April 2020 prudential policy Nikola Tarashev and Kostas
Tsatsaronis
No 8 Identifying regions at risk with Google Sebastian Doerr and Leonardo
21 April 2020 Trends: the impact of Covid-19 on US labour Gambacorta
markets
No 7 Macroeconomic effects of Covid-19: an early Frederic Boissay and Phurichai
17 April 2020 review Rungcharoenkitkul
No 6 The recent distress in corporate bond Sirio Aramonte and Fernando
14 April 2020 markets: cues from ETFs Avalos
No 5 Emerging market economy exchange rates Boris Hofmann, Ilhyock Shim and
7 April 2020 and local currency bond markets amid the Hyun Song Shin
Covid-19 pandemic
No 4 The macroeconomic spillover effects of the Emanuel Kohlscheen, Benoit Mojon
6 April 2020 pandemic on the global economy and Daniel Rees
No 3 Covid-19, cash, and the future of payments Raphael Auer, Giulio Cornelli and
3 April 2020 Jon Frost
No 2 Leverage and margin spirals in fixed income Andreas Schrimpf, Hyun Song Shin
2 April 2020 markets during the Covid-19 crisis and Vladyslav Sushko
No 1 Dollar funding costs during the Covid-19 Stefan Avdjiev, Egemen Eren and
1 April 2020 crisis through the lens of the FX swap market Patrick McGuire
All issues are available on our website www.bis.org.
BIS Bulletin 7You can also read