2019 Full Year Results - 28 February 2020 - Rolls-Royce
←
→
Page content transcription
If your browser does not render page correctly, please read the page content below
2019
Full Year Results

      28 February 2020

1 2019 Full Year Results
  © Rolls-Royce
Highlights
                           Warren East
                           Chief Executive

2 2019 Full Year Results
   © Rolls-Royce
Underlying core                  Underlying core
 Results                           revenue                          operating profit
 summary
 After challenging first half,
 we had a good end to the
                                   £15.3bn                 +6%*     £810m              +25%*
 year & delivered a strong
 2019 free cash flow
                                   Core free cash flow              Underlying core PBT

                                   £911m            2018: £648m     £587m              +17%*

                                   ‘Dividend’ per share             Core underlying EPS

                                   11.7 p            2018: 11.7 p   15.9p         2018: 17.3p
3 2019 Full Year Results
   © Rolls-Royce                 * Organic change
Delivery                 In 2019 we have
  Key achievements         delivered on:

                             Strong trading performance
                             Significant progress on
                             Trent 1000 fixes
                             Restructuring
                             Portfolio simplification
                             Progressed our low carbon
                             strategy

                               Entering 2020 with conviction and good underlying momentum
4 2019 Full Year Results
   © Rolls-Royce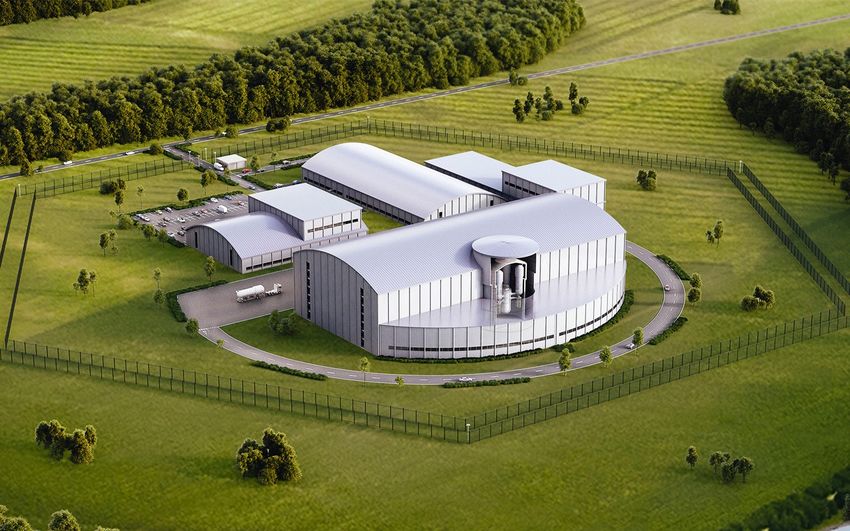
Civil Aerospace
                           • Large engine installed base grew 6% in 2019 and now exceeds 5,000
 Market                    • In 2019 passenger air traffic returned to the long run average of 4-5% growth per annum
 environments              • Airframer widebody build rate reductions announced
                                ‒ WB engine deliveries: c.450 in 2020 & 400-450 p.a. over next few years

                           Power Systems                                   Defence
                           • New markets and applications;                 • Significant pipeline of new programme
                             increasing services penetration                 opportunities:
                           • Geographical expansion into new                    ‒ US: B-52 re-engining; Future
                             regions                                              Vertical Lift
                           • Growing revenues - ahead of peers                  ‒ UK: Team Tempest - power and
                                                                                  propulsion system

                             Journey towards zero net carbon and sustainability across our markets
5 2019 Full Year Results
   © Rolls-Royce
Products                                            Technology

  Decarbonisation
  of our core
  markets
  Pursuing the
  Rolls-Royce                                       Reducing                                              Lowering
                                     fuel consumption, emissions and noise                         environmental impacts
  sustainability strategy
                               • 1% average annual aero engine efficiency            • Grew group electrical capabilities; acquisition of
  2019 saw significant steps     improvement                                           Siemens’ eAircraft & majority stake in Qinous
  towards our ambition to      • Continue to evolve the gas turbine with progress    • Grant funding from UK government for SMR
  be a leader in low carbon      on UltraFan design                                    preliminary design
  technologies                 • Power Systems first to market with hybrid train     • Working with the fuels industry to increase the
                                 powerpack                                             availability of sustainable alternative fuels

                                                                             Operations
                                                                                     • Set up of microgrid facility in Friedrichshafen,
                                                                                       Germany
                                                                                          ‒ Coupled with solar will deliver 30% of the
                                                                  Zero                      site’s energy demand
6 2019 Full Year Results                               greenhouse gas emissions      • New green power purchase agreement (PPA) for
   © Rolls-Royce                                       from our facilities by 2030     all our UK purchased electricity
Business update

7 2019 Full Year Results
   © Rolls-Royce
Civil Aerospace            Power Systems                       Defence

 2019
 Full Year Results
 Overview

                                Revenue +10%                Revenue +4%                   Revenue +1%
                                Profit +£195m                Profit +15%                   Profit -7%

                           • 64% market share in       • Strong financial           • All time record order
                             WB gross orders in 2019     performance and 1.0x         intake of £5.3bn, 1.6x
                                                         book:bill despite            book:bill
                           • Record delivery of
                                                         challenging end markets
                             510 WB engines                                         • Strong cash performance
                                                       • Strong growth in new
                           • Second Pearl engine         geographic markets         • Service revenue up 4%
                             application launched
                                                                                    • Increasing R&D to drive
                                                       • Progress on hybrid
                                                                                      new product pipeline
                                                         strategy with orders for
                                                         MTU rail systems
8 2019 Full Year Results
   © Rolls-Royce
• Trent 1000 MRO capacity tripled since
                                                                           2017, further expansion in 2020
  Trent 1000                                                             • Trent 1000 spare engine pool doubled
                                                                           in 2017-2019; a further ~50% increase
                                                                           will be delivered in 2020
  In service cash cost
  expectations                                                           • £578m cash costs in 2019, the peak year
  unchanged since                                                          for such costs
  November update

                           Enabling a rapid reduction in aircraft on the ground (AOG)
                                 H1 2018   H2 2018   H1 2019   H2 2019   H1 2020   H2 2020
                            0
                                                                                                 Single-digit by end
                           -10
                                                                                                 of Q2 2020
                           -20
                                                                                       Currently mid-30s
                           -30
                                                                            Increase in H2 driven by proactive
                           -40                                              action on Pack B IPT
9 2019 Full Year Results
   © Rolls-Royce
                           -50
IP Compressor         IP Turbine            HP Turbine
   Trent 1000
   Significant progress                               FY 2018      Today   FY 2018     Today    FY 2018      Today
   resolving issues                      TRENT 1000
                                         Package B

   8 of the 9 fixes designed
   and 7 certified                                      Certification H2
   Progressing well on
   designing fix for                     TRENT 1000   FY 2018      Today   FY 2018     Today    FY 2018      Today
   Trent 1000 TEN HPT                    Package C

                                         TRENT 1000   FY 2018      Today   FY 2018     Today
                                         TEN                                                          Design work
                            Fitted to
                            in-service                                                           progressing well and
                            fleet                                                               on track for H1 2021 EIS

                                                           Certified        Embodied from EIS
10 2019 Full Year Results                               Now being fitted
    © Rolls-Royce
Trent XWB • The world’s most efficient large aero
engine in service
Excellent
entry-into-service • Most important new engine
programme: over 50% of expected
annual deliveries
Trent XWB-84 fleet
leading engines are now • Fleet leaders in service for over
entering 5th year in 3,500 cycles and over 22,000 hours
service and reaching our without shop visits
expectations for
durability at the outset of
• Our most reliable engine
the programme ‒ 99.9% dispatch reliability
‒ 0.003 unplanned engine
removals for every
2019
1,000 flight hours >650 engines in-service
13% of installed fleet
‒ Excellent in-flight disruption
statistics (turn-backs, surges,
shutdowns)
Mid-term
~1,800 in-service
11 2019 Full Year Results
© Rolls-Royce
~30% of installed fleetTrent 1000 Trent 700 Trent 7000
Other large
engine
programme
performance
13% of 2019 installed base 32% of 2019 installed base 2% of 2019 installed base
Installed fleet • Strong progress to solve • Proven market favourite • Shared architecture with
durability; 8 of 9 fixes on the A330, with >60% Trent 1000 TEN, but
13% designed; progress on TEN share and >1,600 in improved durability
20% Trent XWB
RB-211 HPT revised blade; service
• Redesigned TEN IP
13% continuing on embodying
• Lowest noise and lifetime compressor blade
20% Trent 1000 fixes into the fleet
Other
fuel burn on the A330ceo embodied
Trent • Grounded aircraft (AOG)
engines represent ~1% of total • 54m hours flown, time-on- • No IP Turbine issue:
32% wing doubled since entry redesigned blade
2% Trent 700 Rolls-Royce widebody fleet
into service embodied from EIS
Trent 7000
• AOGs fallen to mid-30s,
• Today 25th anniversary: • Significantly lower HPT
continue to target single-
very first Trent 700 engine risk: lower thrust climb
digit by end of Q2
completed delivery flight rating than Trent 1000
12 2019 Full Year Results to Cathay Pacific
© Rolls-RoyceWell placed to capture new demand: ~55% market share of widebody order book
• Rolls-Royce widebody fleet is less than 8 years old on average
• Non-Rolls-Royce widebody fleet is ~13 years on average
Widebody
Medium term outlook
Rolls-Royce
Widebody 12%
Our young fleet and
strong market position
Installed Base Non- Non- Rolls-Royce
Rolls-Royce Rolls-Royce 43%
leaves us less exposed to 88% 20-30 57% 0-10
YEARS OLD YEARS OLD
retirements and well
placed to capture
replacement
opportunities
Number of widebody aircraft in service by year of delivery
Typical widebody Orders to increase in early 2020s
retirement as replacement cycle begins Rolls-Royce
window
(~25 year
average age)
Non-Rolls-Royce
13 2019 Full Year Results 1990 1995 2000 2005 2010 2015 2020
© Rolls-Royce Year of DeliveryTransformation
14 2019 Full Year Results
© Rolls-RoyceTransformation driven by:
• Simplifying our organisational structure • Streamlining processes
Corporate
• Investing in digitalisation & automation • Enabling our people
structure
Created simpler structure
Reduced indirect workforce by 10%
with clear accountability and achieved run-rate savings of £269m
in each division and
leaner, agile HQ
Product Operations Services
Development
• Product change process: • Plant productivity • Additional MRO capacity
reduced complexity improvement
• Growth in on wing & near
• End-to-end digital design: • Lead-time reduction wing capability
15% reduction in ‒ 10 day build time on ‒ 17% increase in activity
engineering hours Trent 1000 from prior year
15 2019 Full Year Results
© Rolls-RoyceExisting products Future technologies
R&D Spend £1.0bn £1.1bn
Balancing our Delivering and enhancing
74% 70% Continuing to invest 25%
Capital current production portfolio
Next generation
at least £1bn per year 55%
Allocation gas turbines
Low carbon
26% 26%
Ramping up investment (electrical), 20%
hybrid, fuel cells 0% 4%
in next generation FY 17 FY 19 Mid term
technologies and
balancing across our
portfolio
• UltraFan will be 10% more efficient than • ~£200m spend p.a. on low carbon technology by
Trent XWB mid-term, balanced across the divisions
• Continued spend in Defence towards major • Leveraging our entire portfolio to drive electrical.
upcoming opportunities (B-52, Future Vertical Bringing products to market in Power Systems first
Lift, Tempest) • Small Modular Reactor (SMR): leading a
16 2019 Full Year Results • Transforming Power Systems with a focus on gas consortium in UK’s largest national engineering
© Rolls-Royce and hybrid – MicroGrids, hybrid trains, yachts collaborationFinancial Review
Stephen Daintith
Chief Financial Officer
17 2019 Full Year Results
© Rolls-RoyceAgenda for
today
01 Full year results
02 Progress on key drivers
03 Business unit review
04 Guidance
18 2019 Full Year Results
© Rolls-Royce01
Full year results
19 2019 Full Year Results
© Rolls-RoyceAt a glance
After a challenging first
half we delivered a
strong end to the year
• Underlying operating profit growth 25%
• Strong core FCF of £911m – good Civil Aerospace aftermarket growth,
Trent 1000 insurance receipts secured
• Civil Aerospace – further strong improvement in operating profit
• Gross debt reduction £1.1bn; net cash position improved to £1.4bn
20 2019 Full Year Results
© Rolls-RoyceAs provided in
2018 Preliminary Results
Organic
Revenue Revenue (£m) 2019 Change 2019 Guidance 2018*
underlying results
Civil Aerospace 8,107 +10% 10% growth 7,378
Delivering strong growth Power Systems 3,545 +4% mid-single digit growth 3,434
across the Group Defence 3,250 +1% stable 3,124
ITP Aero 936 +21% 10% growth 779
Other/Eliminations (577) - - - (429)
Core Business 15,261 +6% - - 14,286
Non core 189 - - - 781
Group 15,450 +7% - - 15,067
* 2018 core restated to remove Civil Nuclear North America Services business from Power Systems to Non core
In line or better than guidance for every business
21 2019 Full Year Results
2 © Rolls-RoyceAs provided in
2018 Preliminary Results
Operating 2019 vs 2018
Operating profit Profit (£m) 2019 Margin Guidance 2019 Guidance Margin 2018*
underlying results
Civil Aerospace 44 0.5% closer to break-even (2.2)% (162)
Core operating profit Power Systems 357 10.1% ~100 bps higher margin 9.2% 315
increased 25% YoY Defence 415 12.8% ~100 bps lower margin 13.7% 427
Strong performance ITP Aero 111 11.9% stable margin 8.6% 67
into the year-end Other (117) - - - - (16)
Core Business 810 5.3% 600-800 4.4% 631
Non core (2) - - - - (15)
Group 808 5.2% - - 4.1% 616
* 2018 core restated to remove Civil Nuclear North America Services business from Power Systems to Non core
Margin guidance met or exceeded in every business
22 2019 Full Year Results
2 © Rolls-Royce• Strong end to 2019 following challenging first half;
– Q4 inventory reduction
– Disciplined spend control
Strong Core FCF – Improved Q4 trading in Power Systems
£911m – Trent 1000 - secured insurance receipts of £173m
Further step towards our • Improved quality: Materially lower contribution from net receivables/payables
ambition to deliver £1 cash
per share in the mid-term • CROIC stable at 12% despite ongoing high level of R&D investment
£811m improvement in
FCF since 2016 low-point
Material free cash flow improvement
£0.9bn
£0.6bn
£0.1bn £0.3bn
£0.2bn
23 2019 Full Year Results
© Rolls-Royce
2015 2016 2017 2018 2019Group FCF of £873m, +£305m
Drivers of £305m
year-on-year
improvement Operational cash flow improvement
Improved sustainable +£507m Increased operating profit
cash flow Growth in Civil deferred revenue (LTSA)
Lower PPE capex as large projects end
R&D cash spend stable; lower capitalisation
Lower working capital contribution
£(50)m Materially lower receivables / payables change
Peak year for Trent 1000 costs
£(152)m Higher provision usage partly offset by insurance receipt
24 2019 Full Year Results Lower cash tax and other items
© Rolls-RoyceSummary £m 2019 2018 Change
funds flow Underlying Operating Profit 808 616 192
Growth in Civil deferred revenue (LTSA) 754 679 75
Core FCF
D&A in excess of lease payments 749 756 (7)
~£911 m +£507m PPE capex (747) (905) 158
Receivable and payables
contribution £623m lower Capitalised R&D and certification costs (496) (533) 37
than 2018 Other intangible capex (95) (147) 52
Change in inventory (43) (616) 573
£(50)m Change in net receivables/payables 574 1,197 (623)
Provisions utilisation (primarily Trent 1000) (506) (242) (264)
£(152)m Insurance receipts (Trent 1000) 173 - 173
Net interest, pensions, tax and other (298) (237) (61)
Group Free Cash Flow 873 568 305
Of which: Core Free Cash Flow 911 648 263
25 2019 Full Year Results
© Rolls-RoyceKey actions:
Working capital
improvements
Focus on durable
working capital
£390m
improvements reduction in inventory in H2
• Delivery growth in Civil Aerospace and Power Systems in Q4
• Tight focus on supply chain management; will continue through 2020
• Buffer inventory of Series 1600 in Power Systems will reduce in 2020
• Continuing improvement in S&OP process; increased frequency, focused
£574m
increase in net receivables/payables
• ~£200m in Defence driven by order intake and subsequent deposits
• More disciplined collection of overdue debts reducing from 20% to 15%
driving ~£130m contribution
26 2019 Full Year Results
© Rolls-Royce• Year end net cash £1.4bn +£0.5bn YoY
‒ Led by Group FCF of £873m
Significantly ‒ Commercial Marine & Power Development proceeds of £453m
improved cash
• £1.1bn reduction in gross debt:
position
‒ Repayment of £500m bond at maturity (H1 2019)
£1.1bn reduction ‒ Early repayment of £523m of EIB loans (H2 2019)
in gross debt
• £6.9bn of liquidity including £4.4bn cash balance and £2.5bn undrawn RCF
Maintain ambition to
return to a single A rating
Net cash/(debt) position excl. leases
IFRS 16 Pre IFRS 16
£m 2019 2018 2017 1,400
Cash 4,449 4,980 2,956 1,200
Debt (3,088) (4,140) (3,124) 1,000
800
Net cash/(debt)
excl. Leases
1,361 840 (168) 600
400
Leases (2,354) (229) (137)
200
Net cash/(debt) 2015 2016 2017
(993) 611 (305) 0
incl. Leases 2018* 2019
27 2019 Full Year Results
-200
© Rolls-Royce02
Progress on key levers
28 2019 Full Year Results
© Rolls-Royce2019 saw further progress delivered on
key drivers of cash flow improvement
Progress on
our three OE widebody Widebody aftermarket C&A, R&D,
fundamental average loss cash margin Capex
levers
£0.2m £0.3bn 280bps
improvement improvement lower as % sales
per engine
Trent XWB-84 leads Strong growth in U/L Restructuring
average loss reduction aftermarket cash margin building momentum
Progress achieved towards CMD targets*
~£0.4m/engine ~£500m ~400bps
Improvement since 2017 Increase since 2017 Lower since 2017
29 2019 Full Year Results
© Rolls-Royce * 2018 CMD baseline is FY 2017Widebody engine deliveries Widebody avg. OE losses*
Reduced OE 510
483
average loss per 469
engine (£1.2m)
(£1.4m)
(£1.6m)
£0.2m 2017 2018 2019 2017 2018 2019
improvement * Installed widebody engines
per engine
Significant mix shift to new programmes
14% unit loss reduction
despite shift to new 2018 OE deliveries 2019 OE deliveries
programmes Trent 7000 Trent 700
Trent 900
Trent XWB-97 2
13% Trent 700 2
Trent XWB-84 10% % % 7%
22% reduction in OE losses 9% Trent 900 25% Trent 1000
Trent 7000 21%
469 27% Trent 1000
510
FY2018 Trent XWB-97 11% FY2019
Trent XWB-84 39% 34%
Trent XWB-84
30 2019 Full Year Results
© Rolls-RoyceWidebody aftermarket cash margin
(pre-Trent 1000 costs)
Civil Aerospace
aftermarket U/L cash margin £1.6bn £1.9bn Drivers of improved
income:
cash margin • 7% EFH growth
• Strong T&M growth
In-service fleet 4,757 5,029 • Price escalation
£0.3bn engines engines • Growth in pay at shop
visit events
improvement
Invoiced EFH 14.3m EFHs 15.3m EFHs
Income
Major refurbs 286 SVs 306 SVs Costs
Strong improvement in
aftermarket cash margin Check & repair 569 C&R* 660 C&R*
Other AM costs
2018
2019
*Check & repair visits include Trent 1000 in-service related visits
Note chart illustrative. Not to scale
31 2019 Full Year Results
© Rolls-Royce
Delivering ahead of CMD ambitionCore underlying revenue split £7.9bn services - driven by:
Driving value Civil £4.9bn
LTSA • ~90% of Trent engines covered by LTSAs
from services OE £3.8bn 13% • Installed fleet ~5,000 large engines, ~9,000
across the Group £7.4bn
small engines
3% £15.3bn
Services now represents Total Power Systems £1.2bn
more than 50% of our revenue • Growing services penetration up from 33%
revenue of revenues to ~40% by mid-term
Other services • ~146,000 installed base
Recurring, visible, higher
margin business £4.1bn 8% Defence £1.8bn
• ~16,000 engines in service
• Services order book grown ~50% since 2015
Generating higher returns from services
• Extending time-on-wing in Civil and Defence Aerospace
• Optimising repair technologies to reduce maintenance costs
32 2019 Full Year Results • Increasing use of digital capabilities
© Rolls-RoyceSummary C&A
• C&A costs down 4%, £938m % of 6.9%
from £977m
sales 6.1% ~5%
£1bn
Bending the • PPE capex reduction £158m as £0.9bn
fixed cost curve major capital projects near
completion
• R&D investment at highest levels
£1,108m (2018: £1,106m) but falls as
280bps % of sales 2018 2019 CMD
lower; target
now 18.4% of sales
PPE capex R&D and certification
Progress showing in our ~6%
% of % of 8.0% 7.4%
cost control efforts sales 6.3% sales
4.9% ~4%
£1.1bn £1.1bn
£0.9bn £0.7bn
33 2019 Full Year Results
2018 2019 CMD 2018 2019 CMD
© Rolls-Royce target target• In-service cash cost expectations
unchanged since November update
Trent 1000 • ~£2.4bn total in-service cash costs
in-service cash (2017-2023)
costs • 2019 is the peak year for cost at £578m
2019 is the peak year • £173m insurance receipts secured
for cost at £578m
in December
Cash costs
Insurance
receipts
£578m
£450m- £450m-
£431m £550m £550m
£173m Significant Significant
£119m decline decline
34 2019 Full Year Results 2017 2018 2019 2020F 2021F 2022 2023
© Rolls-Royce03
Business unit review
35 2019 Full Year Results
© Rolls-RoyceOrganic
£m 2019 2018 Change change
Civil Aerospace OE revenue 3,246 3,119 +4% +4%
Services – LTSA 3,138 2,752 +14% +14%
Operating profit
£44m Services - T&M/other 1,723 1,507 +14% +14%
Underlying revenue 8,107 7,378 +10% +10%
Gross profit 622 493 +26% +25%
Underlying revenue
by end market Gross margin % 7.7% 6.7% +100bps +90bps
4%
Operating result 44 (162) +206 +195
11%
Operating margin % 0.5% (2.2)% +270bps +260bps
14%
71%
• Underlying revenue: Large engine major shop visits up 7%, OE Widebody sales
volumes up 41 to 510 engines
Large engines 15%
Business 4%
V2500 11% • Gross profit: Higher servicing activity and increased spare part sales, lower impact
Regional 19% from negative contract catch-ups. FX headwinds on USD customer deposits
• Operating result: Higher gross profit, increased JV profit reflecting increased
36 2019 Full Year Results
© Rolls-Royce servicing activity, reduced C&A costs offset by R&D spendOrganic
£m 2019 2018 Change change
Power Systems OE 2,386 2,310 +3% +4%
Services – LTSA 134 128 +5% +6%
Robust growth and
margin improvement in Services – T&M/Other 1,025 995 +3% +4%
challenging markets
Underlying revenue 3,545 3,434 +3% +4%
Gross profit 909 866 +5% +6%
Underlying revenue
by end market Gross margin % 25.6% 25.2% +40bps +50bps
28%
Operating profit 357 315 +13% +15%
3%
Operating margin % 10.1% 9.2% +90bps +90bps
9%
25%
35% • Underlying revenue: OE growth led by strong progress in PowerGen, services up
+4% led by good LTSA growth of +6%
Marine 1%
Industrial 17%
PowerGen 24% • Gross profit: driven by sales growth and improved gross margin due to product mix
Defence / other 30%
Civil Nuclear 4% • Operating profit: higher gross profit, £11m lower R&D charge offset by additional IT
spend as we expanded our digital solutions capability
37 2019 Full Year Results
© Rolls-RoyceOrganic
£m 2019 2018 Change change
Defence OE 1,461 1,452 +1% -2%
Services – LTSA 566 530 +7% +3%
Stable sales, excellent
year for order intake and Services – T&M/other 1,223 1,142 +7% +5%
cash flow
Underlying revenue 3,250 3,124 +4% +1%
Gross profit 669 690 -3% -6%
Underlying revenue
by end market Gross margin % 20.6% 22.1% -150bps -160bps
Operating profit 415 427 -3% -7%
36%
12% Operating margin % 12.8% 13.7% -90bps -110bps
10%
23%
19% • Underlying revenue: Overall up 1% led by 4% growth in services revenue. OE
modest decline driven by temporary reduction in OE transport volumes
Transport 3%
Combat 8%
Submarines 1% • Gross profit: reduction reflects product mix - lower Trent 700 MRTT volumes, lower
Naval Marine 20% LTSA margin due to non-repeat of one-off customer settlements
Other 9%
• Operating profit: lower gross profit, modest increase in R&D £4m partially offset by
38 2019 Full Year Results
© Rolls-Royce a reduction in C&A costs £22mOrganic
£m 2019 2018 Change change
ITP Aero OE 782 666 +17% +19%
Services 154 113 +36% +37%
Good growth on Trent
and non Rolls-Royce Underlying revenue 936 779 +20% +21%
programmes
Gross profit 206 156 +32% +33%
Gross margin % 22.0% 20.0% +200bps +200bps
Underlying revenue
by end market Operating profit 111 67 +66% +67%
Operating margin % 11.9% 8.6% +330bps +330bps
10%
13% 77%
• Underlying revenue: higher civil OE volumes and non-repeat of 2018 Trent 1000
aftermarket impact, benefit of ~£50m from simplification of contractual terms with
Civil 40%
Defence 14% Civil Aerospace
Services / MRO 18%
• Gross profit: 33% improvement driven by higher OE volumes and improved pricing,
~£25m profit benefit from simplification of contractual terms – net neutral to Group
39 2019 Full Year Results
© Rolls-Royce • Operating profit: higher gross profit partially offset by modestly higher C&A and R&D04
Guidance
40 2019 Full Year Results
© Rolls-Royce£m 2019 2020 Outlook
2020 outlook Underlying revenue
Civil Aerospace 8,107 Stable to low single-digit growth
Power Systems* 3,306 Low single-digit growth
Operating profit growth Defence 3,250 Stable to low single-digit growth
around 15%
ITP Aero 936 Stable
Core FCF at least £1bn Corporate / eliminations (577) Stable
Core 15,022 Stable to low single-digit growth
Underlying operating profit
Guidance excludes any Civil 44 50-100bps margin improvement^
material impact from
COVID-19 in 2020 Power Systems* 375 0-100bps margin improvement
Defence 415 Stable
ITP Aero 111 50-100bps margin improvement
Corporate / eliminations (117) £(60)-(80)m
Core 828 Around 15% growth
^Civil Aerospace profit improvement despite headwind from £100-150m lower capitalisation of R&D in 2020
41 2019 Full Year Results
© Rolls-Royce *For guidance purposes Power Systems 2019 is shown excluding Bergen, which is included in non-core to reflect treatment from 2020~£1bn Operating profit
Growth around 15%
2020 funds flow
guidance
~£750m LTSA deferred revenues broadly stable year-on-year
+/- ~£150m
Operating profit growth
across all our of business
~£(600)m Capital spend* above D&A broadly stable year-on-year
+/- ~£50m
Continued progress
against our key cash
drivers in 2020 ~£600m Working capital contribution led by inventory unwind
+/- ~£150m
Guidance excludes any
material impact from ~£(500)m Movement in provisions – largely Trent 1000
COVID-19 in 2020 +/- ~£50m
~£(250)m Other (tax, interest, pension)
+/- ~£50m
at least £1bn FCF
42 2019 Full Year Results
© Rolls-Royce
*Capital spend includes PPE capex, intangibles additions, and IFRS 16 lease costs (capital + interest portion)Business outlook
Warren East
Chief Executive
43 2019 Full Year Results
© Rolls-Royce2020 outlook “The momentum we gained in 2019 underpins our
confidence for the year ahead…
Core operating profit growth is expected to be around
15% with at least £1bn of FCF in 2020,
as we drive towards our ambition to exceed
£1 of free cash flow per share in the mid-term
(at least £1.9bn FCF)”
Guidance excludes any
material impact from
COVID-19 in 2020
44 2019 Full Year Results
© Rolls-RoyceManaging Procedures in place to ensure We are actively monitoring the
COVID-19 the health, safety & wellbeing situation & taking appropriate
A macro-risk for 2020 of our people actions. We will update the
market as appropriate
COVID-19 is likely to have
an impact on air traffic
growth in the near term,
however long term
growth trends remain
intact
• Civil Aerospace:
‒ c.10% of total WB OE backlog to Greater China airline customers
‒ c.20% of total annual Civil EFH from Greater China routes
• Power Systems: c.10% of revenue derived from Greater China
• Direct supply-chain risk minimal: small number of key tier one suppliers in the
Greater China region, all of whom have resumed operations
45 2019 Full Year Results
© Rolls-Royce2020 priorities
Customers Operations
• Meet customer commitments • Drive operational excellence and
• Bring Trent 1000 AOGs down reduced inventory
to single digits • Achieve £400m run-rate savings
on restructuring
Finance People & culture
• Deliver significant operating profit • Deliver leaner and more agile
growth organisation
• Free cash flow of at least £1bn • Improve employee engagement
46 2019 Full Year Results
and productivity
© Rolls-RoyceLong-term priorities
Realise our ambition to be the
world’s leading
industrial technology company
• Embed behavioural change and a desire for continuous improvement
• Drive operational and financial improvement; exceed £1 per share FCF in the mid term
• Transition to low carbon power: a growth opportunity we can seize through
increasingly efficient engines & using innovation to become a disruptor in new areas
‒ Deliver zero emissions from operations and facilities by 2030
‒ Play a leading role in enabling the vital sectors we’re part of to get to net zero
47 2019 Full Year Results
© Rolls-Royce
carbon by 2050You can also read