Investor Presentation - August 2020 - Viper Energy Partners

Page created by Dean Mccarthy
 
CONTINUE READING
Investor Presentation - August 2020 - Viper Energy Partners
Investor Presentation
August 2020
Investor Presentation - August 2020 - Viper Energy Partners
Forward Looking Statements
This presentation contains “forward-looking statements” within the meaning of the securities laws. All statements, other than statements of historical fact, included in this presentation that
address activities, events or developments that Viper Energy Partners LP (“Viper,” the “Partnership,” “VNOM”, “we” or “our”) expects, believes or anticipates will or may occur in the future are
forward-looking statements. The words “believe,” “expect,” “may,” “estimates,” “will,” “anticipate,” “plan,” “intend,” “foresee,” “should,” “would,” “could,” or other similar expressions are
intended to identify forward-looking statements, which are generally not historical in nature. However, the absence of these words does not mean that the statements are not forward-
looking.
Without limiting the generality of the foregoing, these statements discuss future expectations, contain projections of results of operations or of financial condition or state other forward-looking
information and include statements with respect to, among other things, Viper’s ability to make distributions on the common units and expectations of plans, strategies and objectives and
anticipated financial and operating results of Viper. These statements are based on certain assumptions made by Viper based on management’s expectations and perception of historical
trends, current conditions, anticipated future developments and other factors believed to be appropriate. Such statements are subject to a number of assumptions, risks and uncertainties,
many of which are beyond the control of Viper, which may cause actual results to differ materially from those implied or expressed by the forward-looking statements. These include the
factors discussed or referenced in the “Risk Factors” section of Viper’s Annual Report on Form 10-K, Quarterly Reports on Form 10-Q and Current Reports on Form 8-K and in Viper’s other filings
with the Securities and Exchange Commission (the “SEC”), risks relating to financial performance and results, current adverse industry and macroeconomic conditions and resulting capital
restraints, Viper’s future cash distribution policy, depressed commodity prices and demand for oil and natural gas and impact on proved reserves, borrowing base redeterminations and
possible impairments of oil and gas interests, availability of drilling equipment and personnel, availability of sufficient capital to execute our business plan and acquisition strategy, impact of
compliance with legislation and regulations, including any regulatory action that may impose production limits on Viper’s properties, the impact and duration of the ongoing COVID-19
pandemic, including logistical challenges and the supply chain disruptions, successful results from our operators’ identified drilling locations, our operators’ ability to efficiently develop and
exploit the current reserves on our properties, any delays, curtailments or interruptions of production on our mineral and royalty acreage, our ability to acquire additional mineral and royalty
interests, our pending, completed or future acquisitions of mineral and royalty interests and other important factors that could cause actual results to differ materially from those projected.
Any forward-looking statement speaks only as of the date on which such statement is made and Viper undertakes no obligation to correct or update any forward-looking statement, whether
as a result of new information, future events or otherwise, except as required by applicable law.
Non-GAAP Financial Measures
Adjusted EBITDA is a supplemental non-GAAP financial measure that is used by management and external users of our financial statements, such as industry analysts, investors, lenders and
rating agencies. Viper defines generally accepted accounting principles, or GAAP. Management believes Adjusted EBITDA is useful because it allows it to more effectively evaluate Viper’s
operating performance and compare the results of its operations from period to period without regard to its financing methods or capital structure. Adjusted EBITDA should not be considered
as an alternative to, or more meaningful than, net income as determined in accordance with GAAP or as an indicator of Viper’s operating performance or liquidity. Certain items excluded
from Adjusted EBITDA are significant components in understanding and assessing a company’s financial performance, such as a company’s cost of capital and tax structure, as well as the
historic costs of depreciable assets, none of which are components of Adjusted EBITDA. Viper defines cash available for distribution generally as an amount equal to its Adjusted EBITDA for the
applicable quarter less cash needed for debt service and other contractual obligations and fixed charges and reserves for future operating or capital needs that the board of directors of
Viper’s general partner may deem appropriate. Viper’s computations of Adjusted EBITDA and cash available for distribution may not be comparable to other similarly titled measures of other
companies or to such measure in its credit facility or any of its other contracts. For a reconciliation of Adjusted EBITDA to net income (loss), please refer to Viper’s filings with the SEC.
Oil and Gas Reserves
The SEC generally permits oil and gas companies, in filings made with the SEC, to disclose proved reserves, which are reserve estimates that geological and engineering data demonstrate
with reasonable certainty to be recoverable in future years from known reservoirs under existing economic and operating conditions, and certain probable and possible reserves that meet
the SEC’s definitions for such terms. Viper discloses only estimated proved reserves in its filings with the SEC. Viper’s estimated proved reserves as of December 31, 2019 contained in this
presentation were prepared by Ryder Scott Company, L.P., an independent engineering firm, and comply with definitions promulgated by the SEC. Additional information on Viper’s
estimated proved reserves is contained in Viper’s filings with the SEC.
In this communication, Viper may use the terms “resources,” “resource potential” or “potential resources,” which the SEC guidelines prohibit Viper from including in filings with the SEC.
“Resources,” “resource potential” or “potential resources” refer to Viper’s internal estimates of hydrocarbon quantities that may be potentially discovered through exploratory drilling or
recovered with additional drilling or recovery techniques. Such terms do not constitute reserves within the meaning of the Society of Petroleum Engineer’s Petroleum Resource Management
System or SEC rules and does not include any proved reserves. Actual quantities that may be ultimately recovered by the operators of Viper’s properties will differ substantially. Factors
affecting ultimate recovery include the scope of the operators’ ongoing drilling programs, which will be directly affected by the availability of capital, drilling and production costs, availability
of drilling services and equipment, drilling results, lease expirations, transportation constraints, regulatory approvals and other factors; and actual drilling results, including geological and
mechanical factors affecting recovery rates. Estimates of potential resources may change significantly as development of our properties by our operators provide additional data. In addition,
our production forecasts and expectations for future periods are dependent upon many assumptions, including estimates of production, decline rates from existing wells and the undertaking
and outcome of future drilling activity, which may be affected by significant commodity price declines or drilling cost increases.

                                                                                                                                                                                                   2
Investor Presentation - August 2020 - Viper Energy Partners
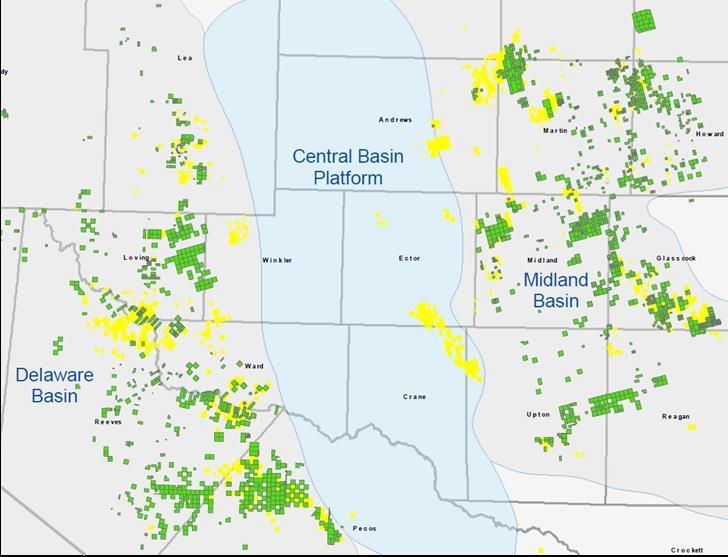
Viper: Investment Highlights
                              2Q ‘20 cash available for distribution of $0.12/unit; Board approved distribution of $0.03 with remaining available
                               cash to be retained for balance sheet strength
Q2 2020 Review                2Q ‘20 average oil production of 14,453 Bo/d, up 9% year over year
                              134 total gross (2.4 net 100% royalty interest) horizontal wells with average lateral of 8,648’ turned to production
                               during 2Q ‘20

                              Q3 2020 / Q4 2020 average production guidance of 14,750 – 16,000 Bo/d (24,500 – 26,500 Boe/d), the midpoint of
                               which is up 6% from 2Q ‘20 average daily oil production
                              FY 2020 production guidance of 15,250 – 16,000 Bo/d (25,250 – 26,250 Boe/d)
 Durable Free
  Cash Flow                   Relationship with Diamondback and diversified exposure to other well-capitalized operators within the Permian Basin
    Profile                    and Eagle Ford Shale support Viper’s production profile
                              High cash margins, no capital requirements and limited operational costs drive continuous free cash flow generation
                              Strong free cash flow generation and variable equity distribution model enables cash flow flexibility

                             24,714 net royalty acres positioned in the core of the Permian Basin and Eagle Ford Shale with 14 rigs currently
                              operating on Viper’s acreage
Unmatched Size
  and Scale                  Proved reserves as of December 31, 2019 of 88.9 MMBoe (78% PDP, 54.4 MMBo), up 41% year over year
                             Strong liquidity position of $436 million with low G&A burden and limited interest expense as primary cash expenses

                              485 gross (8.1 net 100% royalty interest) horizontal wells in the process of active development
 Undeveloped                  440 line-of-sight wells with visibility to potential of future development in coming quarters, but which are not
   Inventory                   currently in the process of active development, in which Viper expects to own an average 2.0% NRI (8.8 net
Supports Long-                 100% royalty interest wells)
 Term Growth                  Largely undeveloped, concentrated acreage throughout the core of the Permian under competent
                               operators, primarily Diamondback, provides long-term organic growth potential

  Viper’s Mineral and Royalty Interests Provide Significant Exposure to Perpetual Ownership of High Margin,
  Largely Undeveloped Assets with Zero Capital Requirements to Support its Sustainable Free Cash Flow (1)

       Source: Partnership data and filings. Data as of 6/30/2020 unless otherwise noted.
       (1) Approximately 87% of Viper’s royalty assets are perpetual; the remaining royalty assets are overriding royalty interests that are subject to lease expirations and not perpetual.

                                                                                                                                                                                               3
Investor Presentation - August 2020 - Viper Energy Partners
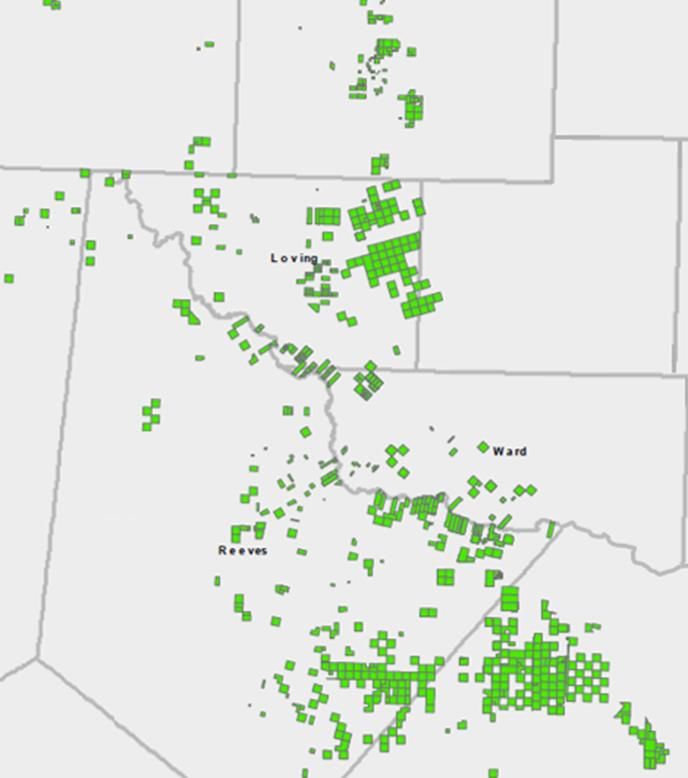
Viper Energy Partners Overview
     Differentiated Investment Opportunity                                                                                   Viper Mineral and Royalty Assets
      Unique Relationship with Primary Operator                                                                 VNOM royalty acreage

    Diamondback relationship and ownership reduces
         uncertainty around pace of development
                                                                                                                FANG acreage

       Free Cash Flow Positive Through the Cycle
    High margins, no capital requirements and limited
 operating costs drive continuous free cash flow generation

      Perpetual Ownership with Priority Claims(1)
      Mineral interests have claim to first-dollar-out
  At expiration of lease, all rights revert to mineral owner

              Significant Undeveloped Resource
            Permian asset
Free Cash Flow Sensitivity

 Due to its high return and high cash margin structure, Viper’s free cash flow is resilient to changes in
  commodity prices; further upside to commodity prices in 2021 as hedges roll off
 At $40 oil and production held flat relative to its 2H 2020 guidance levels, Viper is expected to
  generate >$180 million in free cash flow on an annualized basis in the first half of 2021, or a greater
  than 11% free cash flow yield

    Illustrative 2H 2020E and 1H 2021E Annualized Free Cash Flow Based on 2H 2020 Production Guidance(1)

                                                                                   2H 2020 Annualized FCF      1H 2021 Annualized FCF
             Assumptions
                                                                                       Annualized FCF Yield @ Guidance Midpoint                                                                       $250
      14.75 – 16.00 Mbo/d
              Oil Production

                                                                                                                                                                                                             Annualized Free Cash Flow ($MM)
      24.50 – 26.50 Mboe/d                                                                                                                                                                            $200
             Total Production

              $6.5 Million
                 Cash G&A                                                                                                                                                                             $150
                                                                                                                                                                                 14.0%
               $32 Million                                                                                                                           12.9%
            Interest Expense(2)                                                                                          11.5%
                                                                                               9.8%                                                                                                   $100
          7% of Revenue                                            8.2%
                                                                                                                                                                                 11.4%
      Prod. & Ad Valorem Taxes                                                                                                                       10.5%
                                                                                                                          9.7%
                                                                                               8.9%
     25% of WTI / $1.00/Mcf                                        7.7%                                                                                                                               $50
       Realized NGL / Gas Prices

                    ~95%                                                                                                                                                                              $0
       % of WTI Realized ($/Bbl)
                                                                 $30.00                      $35.00                      $40.00                     $45.00                      $50.00
        Source: Partnership data and filings. Financial data as of 6/30/2020. Yield based on unit closing price as of 7/31/2020.
        (1)  Free cash flow defined as operating cash flow before changes in working capital. Includes hedge gain/(loss).
        (2)  Roughly approximates total interest expense based on 5.375% fixed interest payments on $480 million Sr. Notes due 2027, 3.0% interest on $153mm drawn on the revolving credit facility and a
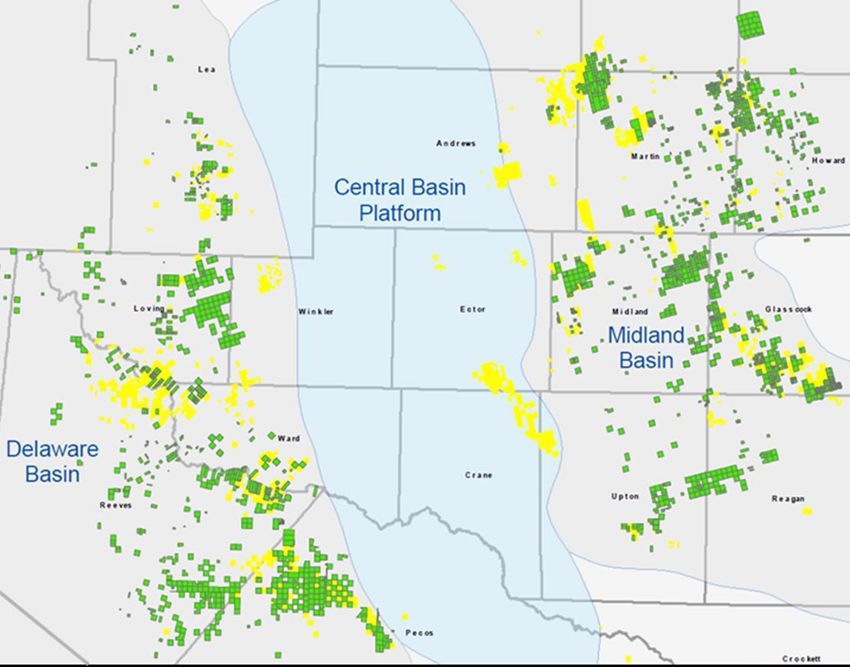
             0.4% non-use fee on the undrawn capacity of the revolving credit facility.                                                                                                                      5
Portfolio Overview
 134 gross (2.4 net) horizontal wells turned to production during Q2 2020
 Near-term inventory of 8.1 net wells currently in the process of active development and an
  additional 8.8 net line-of-sight wells not currently being developed
 14 gross rigs currently operating on Viper’s acreage, 4 of which are operated by Diamondback
 No acquisitions were completed during Q2 2020, leaving Viper’s footprint of mineral and royalty
  interests at a total of 24,714 net royalty acres
                                                        Diamondback Operated                                                      Third Party Operated
                                                       Midland                   Delaware                      Midland                    Delaware                  Eagle Ford                         Total

      Net Royalty Acres                                 7,384                      5,231                        5,194                       6,224                        681                        24,714

2Q ‘20 Gross Hz Wells Turned to
Production (Net 100% NRI Wells)
                                                      10 (0.9)                    4 (0.3)                     47 (0.6)                    37 (0.4)                   36 (0.2)                     134 (2.4)

 Gross Producing Hz Locations
     (Net 100% NRI Wells)
                                                    733 (65.8)                 346 (18.6)                  1,077 (28.6)                 985 (15.6)                1,339 (7.6)                 4,480 (136.2)

       Gross Active Rigs
      (Net 100% NRI Rigs)
                                                       4 (0.1)                    0 (0.0)                       7 (0.1)                    3 (0.1)                    0 (0.0)                      14 (0.3)

   Gross Work-in-Progress(1)
     (Net 100% NRI Wells)
                                                      40 (4.2)                   26 (1.0)                    252 (1.4)                    97 (1.2)                   70 (0.3)                     485 (8.1)

  Gross (Net) Line-of-Sight(2)                        53 (3.6)                   21 (0.7)                    179 (2.2)                   146 (2.1)                   41 (0.2)                     440 (8.8)

         Source: Partnership data and estimates and DrillingInfo. Acreage as of 6/30/2020; activity data as of 7/14/2020. Existing permits or active development of Viper’s royalty acreage does not ensure
         that those wells will be turned to production given the current depressed oil prices.
         (1) Work in progress wells represent those that have been spud and are expected to be turned to production within approximately the next six to eight months.
         (2) Line-of-sight wells are those that are not currently in the process of active development, but for which Viper has reason to bel ieve that they will be turned to production within approximately
               the next 15 to 18 months. The expected timing of these wells is based primarily on permitting by third party operators or Diamondback’s current expected completion schedule.
                                                                                                                                                                                                                 6
Near-Term Inventory Summary and Forward Visibility

 Diamondback has recently brought three completion crews back to work after taking an almost
  three-month break from all completion activity in the second quarter of 2020
 Diamondback expects to focus its completion activity on areas where Viper has significant royalty
  interests, primarily in the Midland Basin
 Visibility into third party operators’ anticipated activity levels has remained limited due to current
  depressed commodity price environment, but has increased in recent months

  100% NRI Work-in-Progress(1)                                                  100% NRI Line-of-Sight(2)                                               100% NRI Near-Term Inventory

            OTHER
             15%                                                                    OTHER                                                                         OTHER
                                                                                     23%                                                                           24%
   PXD 2%
  COP 3%
 EOG 3%
                                                                          COP 2%                                             FANG
 XTO 5%               8.1                                                   PE 3%                   8.8                       49%
                                                                                                                                                          COP 2%
                                                                                                                                                          XTO 4%
                                                                                                                                                                                 16.8                      FANG
                                                                             XTO 4%                                                                                                                         56%
  SM 8%                                     FANG                                                                                                            SM 4%
                                             64%
                                                                                CXO 8%                                                                     CXO 4%

                                                                                                                                                                   PXD 6%
                                                                                            PXD 11%

            Diamondback and Other Well-Capitalized Operators Support Viper’s Production Profile

          Source: Partnership data and estimates. Existing permits or active development of Viper’s royalty acreage does not ensure that those wells will be turned to production given the current depressed
          oil prices.
          (1) Work in progress wells represent those that have been spud and are expected to be turned to production within approximately the next six to eight months.
          (2) Line-of-sight wells are those that are not currently in the process of active development, but for which Viper has reason to bel ieve that they will be turned to production within approximately
                 the next 15 to 18 months. The expected timing of these wells is based primarily on permitting by third party operators or Diamondback’s current expected completion schedule.
                                                                                                                                                                                                                  7
Diamondback DUC Backlog Overview
                            Diamondback’s DUC Backlog on Viper’s Royalty Acreage as of 6/30/2020
                                  VNOM royalty acreage
                                  FANG acreage                      Andrews/Martin: 10-15 gross DUCs
                                                                          Average NRI: 4.5%
                                                                        Average Lateral: 9,200’

                                                                                                                                 Howard: 20-25 gross DUCs
                                                                                                                                    Average NRI: 2.0%
                                                                                                                                 Average Lateral: 10,200’

                                                                               Midland: 20-25 gross DUCs
                                                                                  Average NRI: 16.5%
                                                                               Average Lateral: 11,100’

N. Delaware 0-5 gross DUCs
    Average NRI: 0.5%
 Average Lateral: 10,400’

                                                                                                                                 Glasscock: 0-5 gross DUCs
                                                                                                                                    Average NRI: 12.5%
                                                                                                                                  Average Lateral: 7,500’
         ReWard: 15-20 gross DUCs
            Average NRI: 3.0%
          Average Lateral: 10,100’

                                                                                                      Pecos: 25-30 gross DUCs
                                                                                                        Average NRI: 4.0%
                                                                                                      Average Lateral: 10,200’

             Viper Has Meaningful Exposure to Approximately 65% of Diamondback’s Total Gross DUCs

        Source: Partnership data and estimates. DUC backlog as of 6/30/2020.

                                                                                                                                                       8
Significant Undeveloped, Concentrated Resource

 Highly Concentrated Acreage in Midland Basin                                                                   Illustrative Remaining Midland Basin Resource
                                                                                                                                            12,578 VNOM
                                                                                                                                           Net Royalty Acres
                                                                                                                                                                    Assumed 1.5
                                                                                                                           Assumed 25%
                                                                                                                                                                    mile lateral
                                                                                                                           lease royalty
                                                                                                                                                                     (240 NRA)

                                                                                                                                    13.1 Net Drilling Spacing
                                                                                                                                        Units (100% NRI)

                                                                                                                                                  28 wells
                                                                                                                                                  per 1.5
                                                                                                                                                  mile DSU

                                                                                                                          ~365 illustrative net
                                                                                                                                                               Estimated 900
                                                                                                                           100% NRI VNOM
                                                                                                                                                               MBoe EUR/well
                                                                                                                              locations

                                                                                                                                             ~329 MMBoe
                                                                                                                                            Total Resource

            % Developed                                                                                                                                         ~270 remaining
                                                                                                                            ~95 producing
                                                                                                                                                                 net locations
            % Undeveloped                                                                                                    net locations
                                                                                                                                                             (>70% undeveloped;
                                                                                                                          (
Significant Undeveloped, Concentrated Resource

Highly Concentrated Acreage in Delaware Basin                                                                Illustrative Remaining Delaware Basin Resource
                                                                                                                                             11,456 VNOM
                                                                                                                                            Net Royalty Acres
                                                                                                                                                                      Assumed 1.5
                                                                                                                            Assumed 25%
                                                                                                                                                                      mile lateral
                                                                                                                            lease royalty
                                                                                                                                                                       (240 NRA)

                                                                                                                                     11.9 Net Drilling Spacing
                                                                                                                                         Units (100% NRI)

                                                                                                                                                   20 wells
                                                                                                                                                   per 1.5
                                                                                                                                                   mile DSU

                                                                                                                           ~240 illustrative net
                                                                                                                                                                Estimated 1,000
                                                                                                                            100% NRI VNOM
                                                                                                                                                                MBoe EUR/well
                                                                                                                               locations

                                                                                                                                              ~240 MMBoe
                                                                                                                                             Total Resource

       % Developed
                                                                                                                                                                 ~205 remaining
                                                                                                                             ~35 producing
                                                                                                                                                                  net locations
       % Undeveloped                                                                                                          net locations
                                                                                                                                                              (>85% undeveloped;
                                                                                                                           (
Spectrum of Oil and Gas Interest Ownership

                                                                          ~87% of Viper’s Royalty Assets
                                                                           Own rights in perpetuity; all development rights revert to mineral owner at
                                                                      1     expiration of lease
                           Perpetual Mineral                               Revenue is received from E&P companies as lessor royalties from producing wells
                               Interest(1)                                  located on leased lands

                                                                                 ~13% of Viper’s Royalty Assets (55% of which operated by FANG)
                           Overriding Royalty
                                                                            2     Royalty interests carved out of lessee’s leasehold interest
                            Interest (ORRI)
                                                                                  Burdens working interest and expires with underlying lease

                        Volumetric Production                                             Structured investment that relates to a specific amount of
                             Payment
                                                                                   3       production for a pre-determined amount of time

                                                                                                 Royalties paid based on the profitability of a defined area
                             Net Profit Interest
                                                                                           4     Royalty collector exposed to operating and capital costs,
                                                                                                  typically excluding environmental liabilities

                                                                                                        Acreage is leased from a mineral owner
                             Working Interest
                                                                                                 5      Responsible for drilling wells (if they are the operator)
                                                                                                         and associated capital and operating costs

 Minerals Provide the Greatest Form of Protection Available in the Oil Industry Due Perpetual Ownership and
                                 Priority Claims with Right to First-Dollar-Out

     Source: Partnership data and filings. Acreage as of 6/30/2020.
     (1)  Includes non-participating royalty interests.

                                                                                                                                                                11
Illustrative Delaware Basin Oil & Gas Lease Life Cycle

                                                                                                                                                         Sign New
                                                                                                                                                           Lease

2015: Minerals Leased                         2018: Extension                                                                   2021: CDC Expires
• 25% royalty                                 • No development by                                                               • Operator does not
• Lease bonus                                   operator within                                                                   drill any additional
• 3-year primary term                           primary term                                                                      wells
• 180-day CDC(1)                              • Another lease bonus                                                             • Lease terminates for
• Lease requires 4 wells                        to mineral owner                   1/1/2020                     7/1/2020          any land/depths not
  to hold 640 acres per                       • Maintain other                                                                    Held-by-Production
  zone                                          requirements of lease

                                                                                 Operator drills              Operator drills                             Extend
                                                                                 2 WCA(2) wells                1 2BS(4) well                              Lease

                                                                                               Pugh Clause
                Security of Mineral Ownership
 Mineral ownership remains safest asset in the oil
   industry because it is a perpetual, real property
                                                                        1 Mile

                                                                                                     1 Mile
   interest
 Lease terms like “Continuous Development
   Clause” and “Pugh Clause” allow for                                                1 Mile                       1 Mile

   development rights to revert to mineral owner if no                               320 acres of               320 acres of
                                                                                     WCA HPB(3)                  WCA HPB
   development by lessee                                                                                            &
                                                                                                                160 acres of
 Right to receive compensation in various forms                                                                  2BS HPB
   and right to first-dollar-out with priority claims

          (1)    CDC: Continuous Development Clause.
          (2)    WCA: Wolfcamp A.
          (3)    HBP: Held by Production.
          (4)    2BS: Second Bone Spring.                                                                                                                  12
How Viper Defines a “Net Royalty Acre”

 Methodology for deriving “Net Royalty                                                     Viper’s Formula for Net Royalty Acreage
  Acreage” differs widely across the industry

 Many companies calculate assuming there
  are eight royalty acres for every one net                                                    Net                 Lease                  Net
                                                                                                                  Royalty
  mineral acre (NMA)                                                                          Mineral                                   Royalty
                                                                                              Acres               and other
                                                                                                                   burdens               Acres
 Viper derives its total net royalty acreage
  from net mineral ownership taking into                                                 Viper believes its methodology more accurately defines its
  consideration the royalty interest AND all                                              acreage for which it will receive revenue
  other burdens

          Acreage Definition Comparison                                                   NRA Example Assuming Standard ¼ Royalty

                                                                                                                                640
                                                                                                                               NMA           160 NRA
   Viper Net Royalty Acres            24,714
                                                                                                                              Mineral        Royalty
                                                                                      640-acre                                Acres           Acres
                                                                                       section
   Viper Net Royalty Acres
     (Normalized to 1/8)                                                    197,712
                                                                                       100%
                                                                                      Mineral                                  640            1,280
                             0       50,000 100,000 150,000 200,000                   Interest                                 NMA            NRA

                                                                                                                              Mineral        Royalty
                                                                                                                              Acres           Acres

      Source: Partnership data and filings. Acreage data as of 6/30/2020.

                                                                                                                                                       13
Financial Overview

                           Financial Strategy                                                                                          Viper Capitalization
Maintain Financial Flexibility
                                                                                                         ($ in millions)                                                           6/30/2020
♦   Borrowing base of $580 million with only $154 million
    drawn as of 6/30/2020                                                                                Cash                                                                          $10
♦   Maintain strong liquidity and optionality with cash flow                                             Revolving Credit Facility                                                     154
    to strengthen balance sheet
                                                                                                         Borrowing Base                                                                580
                                                                                                         Availability Under Revolver                                                   426
Use of Cash Available for Distribution up to Board of
Directors’ Discretion Each Quarter                                                                       Senior Notes                                                                  486
♦   Historically (through 2019) had paid substantially all                                               Liquidity                                                                    $436
    cash available to unitholders through quarterly
                                                                                                         Net Debt / LTM EBITDA                                                         2.5x
    distributions
♦   75% of available cash from 1Q ‘20 and 2Q ‘20 retained                                                                               Guidance Update
    to strengthen balance sheet
                                                                                                          Q3/Q4 2020 Net Oil Production – Mbo/d                                    14.75 – 16.00
Downside Protection Provided through Hedges
                                                                                                          Q3/Q4 2020 Net Total Production – Mboe/d                                 24.50 – 26.50
♦   Majority of 2020 oil production hedged through collars
                                                                                                          Full Year 2020 Net Oil Production - Mbo/d                                15.25 – 16.00
♦   Downside protected in 2020 to $30 oil for large portion
    of expected production                                                                                Full Year 2020 Net Total Production – Mboe/d                             25.25 – 26.25
                                                                                                          Unit Costs ($/boe)
No Direct Operating or Capital Expenses
                                                                                                          Cash G&A                                                                 $0.60 - $0.80
♦   Focus on mineral and royalty interests preserves low-
    cost structure                                                                                        Non-Cash Equity Based
                                                                                                                                                                                   $0.10 - $0.25
                                                                                                          Compensation
♦   Expected production and ad valorem taxes of 7.0% of
    royalty income                                                                                        Depletion                                                                $9.50 - $11.50
♦   Operators bear capital burden, allowing Viper to                                                      Production and Ad Valorem Taxes (% of
                                                                                                                                                                                      7% - 8%
    generate continuous free cash flow                                                                    Revenue)(1)
                                                                                                          Interest Expense(2)                                                      $3.25 - $3.75

         Source: Partnership data and filings.
         (1) Includes production taxes of 4.6% for crude oil and 7.5% for natural gas and NGLs and ad valorem taxes.
         (2) Assumes 1H 2020 actual interest expense plus interest expense for the remainder of 2020 assuming $480mm in principal of Sr. Notes and $155mm drawn on the revolver.
                                                                                                                                                                                                14
Hedge Update

                          Crude Oil (Bbls/day, $/Bbl)   Q3 2020   Q4 2020   FY 2021
                                                         1,000     1,000       -
                                       Swaps - WTI
                                                        $27.45    $27.45       -
                               Costless Collars - WTI   14,000    14,000    10,000
                                               Floor    $28.86    $28.86    $30.00
                                           Ceiling      $32.33    $32.33    $43.05
                 Deferred Premium Call Options - WTI       -       8,000       -
                                         Premium           -      -$1.89       -
                                               Strike      -      $45.00       -
                                                         4,000     4,000       -
                 Basis Swaps - WTI (Midland-Cushing)
                                                        -$2.60    -$2.60       -

                 Natural Gas (Mmbtu/day, $/Mmbtu)       Q3 2020   Q4 2020   FY 2021
                           Natural Gas Basis Swaps -    25,000    25,000       -
                                  Waha Hub              -$2.07    -$2.07       -

   Source: Partnership data as of 6/30/2020.

                                                                                      15
Final Thoughts

   Viper Energy Partners offers sustainable free cash flow, substantial
 remaining inventory and upside to future strength in commodity prices

          Mineral ownership provides surest form of security in the oil industry

              Relationship with Diamondback provides visibility to production and
                                      cash flow growth

                           Royalty assets offer organic growth without any capital costs or
                                                  operating expenses

                                            Strong free cash flow generation with financial flexibility

                                         Advantaged tax structure that enables non-taxable distributions

    (1)   Last eight quarterly quarterly distributions reasonably determined to not constitute dividends for U.S. federal income tax purposes; rather constitute non-taxable reductions to tax basis.

                                                                                                                                                                                                        16
Viper Energy Partners LP          Kaes Van’t Hof, President
500 West Texas Ave., Suite 1200   (432) 221-7430
Midland, TX 79701                 minerals@viperenergy.com
www.viperenergy.com
                                  Adam Lawlis, Vice President, Investor Relations
                                  (432) 221-7430
                                  ir@viperenergy.com

                                                                                    17
You can also read