The choice of indicators for monitoring financial regulation of sustainable development of agricultural regions: the example of Ukraine
←
→
Page content transcription
If your browser does not render page correctly, please read the page content below
SHS Web of Conferences 106, 01029 (2021)                                 https://doi.org/10.1051/shsconf/202110601029
MTDE 2021

       The choice of indicators for monitoring financial
       regulation of sustainable development of
       agricultural regions: the example of Ukraine
       Leonid Tulush, Oksana Radchenko*, and Olena Hryshchenko
       National Science Center «Institute of Agrarian Economics», Kyiv, Ukraine

                     Abstract. The influence of a group of indicators on the integral assessment
                     of the state of agrarian regions for improving the financial mechanisms for
                     regulating sustainable rural development has been investigated. The goal is
                     to identify the relationship between the level of economic growth (growth in
                     agricultural GDP, GVA per employee, income per community resident) and
                     the amount of resources that are financed from the budgets. The empirical
                     study was carried out on the basis of panel data formed for a sample of
                     individual indicators of the rating of regional development of Ukraine for
                     2017-2019. The nature of the distribution of the studied variables was
                     determined by calculating the correlation coefficients. Based on the results,
                     a relationship was established between the indices: budget financing and
                     gross production - 63%; budget financing and integral production index -
                     58%; income of rural budgets and profit of agricultural production - 38%. It
                     is recommended to reduce direct agricultural subsidies, increase the
                     allocation of funds for social development, and finance the most effective
                     programs in order to ensure sustainable development of rural regions. To
                     monitor the process of the effectiveness of financial regulation, it is
                     proposed to use production, economic and social indicators in conjunction
                     with the integral, which will become a more reliable basis for the distribution
                     of budgetary allocations for agricultural and social development in Ukraine.

       1 Introduction
           Ukraine is traditionally an agrarian country, where agriculture accounted for ¼ of the
       GDP. In recent decades, this contribution has decreased to 10%, but it is still a significant
       value against the level of developed countries, where it is not higher than 3%. The industry-
       specific gross product of Ukraine created annually is about UAH 350 billion or US $ 13
       billion [1].
           Having a significant impact on the economy, the agricultural industry is an integral part
       of rural areas. Taking into account the challenges of the time and taking into account the
       experience of the European Union, it became necessary to create a comprehensive strategy
       for the sustainable development of the agricultural and rural sectors in the regional context.
       In practice, these sectors are little interconnected, especially in terms of financing and there

       *
           Corresponding author: oxanarad@ukr.net

© The Authors, published by EDP Sciences. This is an open access article distributed under the terms of the Creative Commons
Attribution License 4.0 (http://creativecommons.org/licenses/by/4.0/).
SHS Web of Conferences 106, 01029 (2021) https://doi.org/10.1051/shsconf/202110601029
MTDE 2021
is a need for government regulation. Establishing such interdependence requires defining the
essence and introducing an effective financial regulation mechanism, otherwise there is a real
threat of excessive polarization and growth of disproportions within the regions and the
country.
The issue of regional agricultural development and the measurement of its indicators and
indicators is relevant for the whole world, since the Food and Agriculture Organization of
the United Nations has chosen a common strategy for Sustainable Development [2].
At the national level, Mesel-Veselyak & Grishchenko [3] determined that the integral
indicator for regional development reveals three groups of indicators: assessment of the level
of agricultural production (yield, productivity); assessment of the economic state of the
agricultural sector (profitability, cost recovery); assessment of the social development of rural
areas (demography, household cash income, unemployment rate; average monthly wages in
the agricultural sector; consumption per person). Sokil et al. [4] provides a methodology for
assessing and determining the integral indicator of sustainable development of agriculture on
the basis of accounting and analytical indicators of three components of sustainable
development (economic, environmental, social). Kozlovskyi et al. [5] believe that the lack of
a generally accepted definition of the concept of "sustainable development of the agricultural
sector" is caused by the lack of information to measure it. They offer a solution to the problem
by drawing up an indicative plan for the development of the agrarian sector of the region in
correlation with the concept of regional development. Chopin et al. [6] investigated that an
assessment of agriculture on a regional scale is needed to better guide regional planning. A
method based on a set of multiscale indicators has been developed to assess the contribution
of agriculture to the sustainable development of regions.
International studies such as Morkunas et al. [7] are aimed at identifying and assessing
the negative consequences of the introduction of a mechanism for financial support for direct
payments under the Common Agricultural Policy for the sustainability of rural areas. It was
found that high land prices, declining crop diversification, land degradation and farmers'
financial indebtedness can be attributed to direct payments, and these effects have a
significant negative impact on agricultural sustainability. Crescenz et al. [8] analyze the
financial allocations for regional policy, rural development policy and agrarian policy of the
European Union in order to assess their territorial coordination and synergy for territorial
cohesion. Regression analysis is used to identify the link between funding and territorial
disadvantage, showing that both coordination and compatibility with territorial cohesion have
not always improved in response to major policy reforms, but are critically dependent on
appropriate local allocation mechanisms.
Considering the achievements of the researchers, problematic issues remain: despite the
decisions of the Government of Ukraine adopted in recent years to stimulate the development
of rural areas, today the effectiveness of most public policy measures in this area remains
low.
2 Research methodology
To assess the nature and features of the impact of financial regulation on the sustainable
development of the agricultural sector and rural areas, general and special methodological
approaches are used: determining the degree of development of a rural region involves the
use of special indicators, the main of which is the sectoral agrarian gross product (GDP), its
dynamics during research period (per employee); identification of the nature of the
dependence of agricultural GDP, production, financial results and social factors and other
macro indicators; identifying the nature of the dependence of changes in agricultural GDP
and the distribution of financial resources that the state controls (lending, the Regional
Development Fund, support for agricultural production from local budgets).
2SHS Web of Conferences 106, 01029 (2021) https://doi.org/10.1051/shsconf/202110601029
MTDE 2021
The indicators of payments from the Regional Development Fund (SFRD) were selected
as the basis for assessing the regional financing rating as a comprehensive assessment;
lending to agricultural enterprises with government subsidies for loan repayment; payments
from local budgets to support agricultural production.
The calculations took into account the Methodology for monitoring and the effectiveness
of the implementation of the state regional policy [9] and Information on monitoring the
development of rural areas [10].
Regional rating assessments of agricultural development are calculated according to the
following algorithm (Mesel-Veselyak & Grishchenko, [3]): the ratio (indices) of each
indicator of the regions to the average for Ukraine with differentiation of indicators, the
increase of which has a positive value (stimulants), and negative (destimulators) value; the
integral rating is calculated as the arithmetic mean of the sum of the rating indices of a
particular region for all groups of indicators according to the formula:
Io= (In + Ie + Ic)/3 (1)
where Io is the general index for three groups of indicators; In - production index; Ie -
economic condition index; Iс - social.
The general rating assessment [9] is carried out by comparing the deviation of the values
of indicators for each specific region from their best values for the regions for the
corresponding (reporting) period and the corresponding ranking of regions.
The rating assessment is carried out on the basis of calculating the relative deviations of
the indicators of each region of the maximum and minimum values of such indicators of other
regions according to the formula:
n xmax i xij n xij xmin i
Rj
i 1 xmax i xmin i i 1 xmax i xmin i
(2)
where Rj is the sum of the ratings of a particular region for each of the indicators
characterizing a particular area of activity; xij is the value of the i-th indicator of the j-th
region; xmax i - maximum value of the i-th indicator; xmin i - the minimum value of the i-th
indicator.
The definition of the arithmetic mean of the sum of the ratings of a particular region for
all indicators of the annual assessment, characterizing a particular area of activity, is carried
out according to the formula:
Rj
Rcpj
n (3)
where Rcpj is the arithmetic mean of the sum of the ratings of a particular region for all
indicators of a particular direction; n is the number of indicators for which the calculation
was made in certain areas.
Based on the results of the calculations, the integral rating is determined as the arithmetic
mean of the sum of rating assessments of a particular region in all areas according to the
formula:
m
R cpi
Ij i 1
m (4)
where Ij is the arithmetic mean of the sum of the ratings of a particular region in all directions;
m - the number of directions in which the calculation was made.
3SHS Web of Conferences 106, 01029 (2021) https://doi.org/10.1051/shsconf/202110601029
MTDE 2021
3 Results of the research
3.1. Analysis of the production group of indicators of agrarian and rural
development
In general, the hypothesis of the study is formulated as follows: there is a high statistical
relationship between the indicator of financial regulation of the economy and indicators of
sustainable agricultural and rural development of production.
To test the hypothesis, we will conduct an econometric analysis of the influence of factors
on the resulting indicators, construct an econometric equation of linear multiple regression.
We use three criteria that characterize the main trends in the state of agrarian and rural
development: 1) production index by indicators: gross output per hectare, output per person
and gross added value of the industry per hectare; 2) the index of economic condition: profit
per hectare, per 1 person, per 1 hryvnia of expenses; 3) social index: employment,
unemployment, wages per employee, income per person. As a result, we get a general index
for three groups of indicators and a rating by the region behind it (Table 1).
The period of three years used by us (2017-2019) is a sufficient lag to determine medium-
term trends, and the geometric mean serves as the basic average for studying time series.
Used data from the official website of the State Statistics of Ukraine [11].
Table 1. Rating of regions of Ukraine according to the integral assessment of agricultural production.
№ Regions Index Rating
Produc Еffic Social General
In Iе Iс Io
1 Vinnitsa 1,35 0,35 1,08 0,93 6
2 Volyn 0,73 0,24 1,04 0,67 18
3 Dnipro 1,27 0,39 0,95 0,87 11
4 Donetsk 0,81 0,25 1,13 0,73 17
5 Zhytomyr 1,06 0,27 1,05 0,80 14
6 Transcarpat 0,73 0,22 1,00 0,65 21
7 Zaporizhz 1,03 0,47 0,98 0,83 13
8 Iv-Frankivsk 0,79 0,10 1,08 0,65 20
9 Kiev 1,35 0,47 0,94 0,92 7
10 Kirovograd 1,55 0,46 1,06 1,02 1
11 Luhansk 0,71 0,30 1,23 0,75 16
12 Lviv 0,74 0,18 1,00 0,64 23
13 Nikolaev 1,24 0,44 1,00 0,89 9
14 Odessa 0,78 0,39 0,83 0,66 19
15 Poltava 1,45 0,37 1,10 0,97 3
16 Rivne 0,76 0,21 0,98 0,65 22
17 Sumy 1,43 0,45 1,01 0,96 4
18 Ternopil 0,89 0,33 1,11 0,78 15
19 Kharkiv 1,31 0,35 0,87 0,84 12
20 Kherson 1,20 0,43 1,02 0,88 10
21 Khmelnitsk 1,29 0,51 0,98 0,93 5
22 Cherkasy 1,29 0,43 1,05 0,92 8
23 Chernivtsi 0,81 -0,05 0,86 0,54 24
24 Chernihiv 1,40 0,43 1,10 0,98 2
Statistical analysis found that multiple R, which characterizes the tightness of the
relationship between the analyzed factors, was 0.6576, that is, the characteristic of the
relationship is moderate, but significant. At the same time, the R2 indicator is low - 0.4325,
as well as the adapted R-square2 - 0.4067, with a standard error (deviation of all sample
4SHS Web of Conferences 106, 01029 (2021) https://doi.org/10.1051/shsconf/202110601029
MTDE 2021
means) 0.5268. The regression analysis of the integral assessment of agricultural production
is given in table. 2.
Table 2. Regression analysis of the integral assessment of agricultural production.
Coef.. Standard error t-statistics P-Value Lower 95% Upper 95%
Y 3,051 1,1474 2,659 0,015 0,6578 5,4450
4
In 0,032 0,4809 0,0669 0,9472 -0,971 1,0355
2
Iе -3,914 1,0218 -3,830 0,0010 -6,045 -1,782
Iс -0,462 1,0581 -0,437 0,6667 -2,669 1,744
3.1.1 Analysis of the financial group of indicators of agrarian and rural development
Another group of resulting indicators relates to financing of agricultural, rural and regional
development. These are the following indicators: 1) the index of payments from the Regional
Development Fund (SFRD) per 1 hectare of the IFR territory; 2) index of lending to
agricultural enterprises with state subsidies for repayment of loans, per 1 ha of land area of
enterprises Ikr; 3) index of payments from local budgets to support agricultural production
Imb. As a result, we obtain a general index of financing Iph for three groups of indicators
(Table 3) for a comparable period.
Table 3. Rating of regions of Ukraine according to the integral assessment of financial support.
Regions Index Rating
SFRD Soft loans Local budget General
Ifr Ikr Imb Iph
Vinnitsa 1,01 0,51 2,64 1,39 9
Volyn 1,23 1,71 4,97 2,64 2
Dnipro 1,51 1,05 0,53 1,03 14
Donetsk 3,24 0,11 1,49 1,61 7
Zhytomyr 0,98 0,75 1,10 0,95 15
Transcarpat 2,35 1,38 2,04 1,92 4
Zaporizhz 0,94 0,92 0,66 0,84 17
Iv-Frankivsk 2,34 1,22 1,77 1,77 6
Kiev 0,92 1,13 1,23 1,10 12
Kirovograd 0,58 0,86 1,27 0,90 16
Luhansk 1,88 0,17 0,04 0,70 21
Lviv 1,73 0,37 4,30 2,13 3
Nikolaev 0,68 0,67 0,38 0,58 24
Odessa 1,07 0,30 0,74 0,70 22
Poltava 0,73 1,74 0,79 1,09 13
Rivne 1,39 0,75 1,92 1,35 10
Sumy 0,91 0,51 0,34 0,58 23
Ternopil 1,81 2,90 0,86 1,86 5
Kharkiv 1,23 0,98 0,00 0,74 20
Kherson 0,85 0,40 0,99 0,75 19
Khmelnitsk 1,43 1,85 0,70 1,33 11
Cherkasy 0,86 3,36 0,23 1,48 8
Chernivtsi 2,55 4,98 2,33 3,29 1
Chernihiv 0,64 0,39 1,43 0,82 18
5SHS Web of Conferences 106, 01029 (2021) https://doi.org/10.1051/shsconf/202110601029
MTDE 2021
For this sample of factors, the analysis found that the multiple R, which characterizes the
tightness of the relationship between the analyzed factors, was 0.7716, the characteristic of
the relationship is significant. The R2 index is 0.5953, the standard error is 0.4665.
The analysis of the correlation coefficients between the integral indicator of financing
and production factors of the first correlation-regression model showed that the correlation
dependence for Iph is observed for all production factors as a de-stimulating one: Iw (-
0.5361), Ie (-0.7689), Ic (- 0 , 1017) (Table 4).
Table 4. Correlation matrix of the relationship between the integral indicator of financing and the
factors of the production correlation-regression model.
Іф Ів Іе Іс
Іф 1,0000 -0,5361 -0,7689 -0,1017
Ів -0,5361 1,0000 0,7094 -0,0059
Іе -0,7689 0,7094 1,0000 0,0507
Іс -0,1017 -0,0059 0,0507 1,0000
To confirm the direction and closeness of the relationship, we construct a correlation field
between the indicators of the financing index (Iph) and the production index (Ic) (Fig. 1).
Fig. 1. Correlation dependences between the financing index (Іph) and the production index (Іv).
The correlation dependences between the financing index (Iph) and the integral
production index (Ic) are shown in Fig. 2.
6SHS Web of Conferences 106, 01029 (2021) https://doi.org/10.1051/shsconf/202110601029
MTDE 2021
Fig. 2. Correlation dependences between the financing index (Іph) and the integral production index
(Із).
3.1.2 Analysis of a group of indicators of the development of territorial communities
In addition to the factors of centralized budget financing and support for agricultural
production, it is important to take into account the financial capacity of local budgets.
According to the regional state administrations [12], thanks to the decentralization reform
and the introduction of new tools to support the development of territories in most of the
united territorial communities (UTGs), there is an increase in the main indicators
characterizing the economic and financial efficiency of their development. The assessment
is carried out on the basis of available official statistics and information from central and
local executive authorities [13; 14], for 62 indicators characterizing the situation in 12 areas
in different areas of socio-economic development of regions, the place of each region in a
separate area and a generalizing rating place in all areas of assessment were determined.
Conducting horizontal alignment according to tax capacity and calculating the amount of
subsidies is carried out according to the following parameters: population size; personal
income tax receipts for the last reporting budget period; the tax capacity index of the
corresponding budget. The basic subsidies are received by poor local budgets (with the level
of income tax on personal income per person below 0.9 of the average for Ukraine (80% of
the amount required to the level of 0.9) to increase their level of financial security.
Reverse subsidies are used in the budgets of OTGs, where this figure is higher than the
1.1 average in Ukraine (50% of the excess of the 1.1 tax capacity index is transferred to the
state budget). Equalization is not carried out if in the local budget the level of income tax on
personal income per inhabitant ranges from 0.9 to 1.1. This approach stimulates local
governments to expand the base and attract additional financial revenues, contributes to an
increase in the income of the general fund of the OTG budgets. The rating of Ukrainian OTG
by financial criteria for 2019 is given in table. 5.
7SHS Web of Conferences 106, 01029 (2021) https://doi.org/10.1051/shsconf/202110601029
MTDE 2021
Table 5. Rating of the united territorial communities of Ukraine by financial criteria.
Regions number communities income per person Rating
Vinnitsa 37 3206 13
Volyn 50 2588 11
Dnipro 62 4402 19
Donetsk 10 5103 15
Zhytomyr 53 3135 8
Transcarpat 6 3367 10
Zaporizhz 44 3097 12
Iv-Frankivsk 30 1648 3
Kiev 16 4600 20
Kirovograd 20 4569 14
Luhansk 9 2770 6
Lviv 40 2525 5
Nikolaev 29 3543 21
Odessa 28 3562 22
Poltava 45 4988 23
Rivne 32 2316 2
Sumy 33 3617 9
Ternopil 49 2239 1
Kharkiv 17 4497 24
Kherson 28 2742 17
Khmelnitsk 45 2750 18
Cherkasy 54 1365 4
Chernivtsi 33 1714 7
Chernihiv 39 3302 16
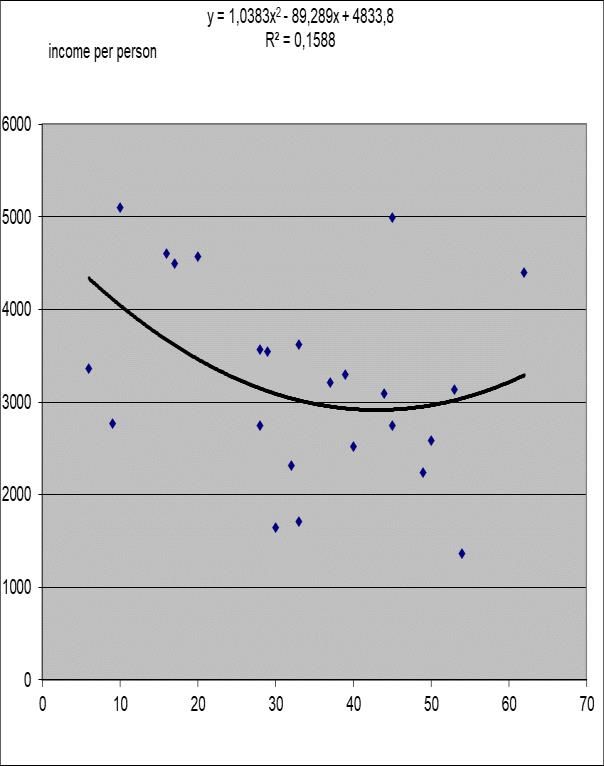
The indicator "Financial self-sufficiency" includes indicators characterizing: the
dynamics of growth of local budget revenues, the volume of capital expenditures per capita
and repayment of the tax debt. In fig. 3 shows the correlation analysis of the dependence of
the incomes of the OTG per 1 person. on the number of communities in the region.
Fig. 3. Dependence of incomes of OTG per 1 person on the number of communities in the region.
8SHS Web of Conferences 106, 01029 (2021) https://doi.org/10.1051/shsconf/202110601029
MTDE 2021
It was found that the relationship is insignificant, only 16%. Thus, the number of
communities is not conducive to an automatic increase in income; complex institutional
measures are needed. Additional financial resources received by local budgets in recent years
have made it possible to increase the volume of capital expenditures per capita in all regions,
and on average in Ukraine per capita this indicator amounted to UAH 2.0 thousand in 2018-
2019.
The analysis of the correlation dependence of the incomes of the OTG per 1 inhabitant
on the integral index of agricultural production Ів is shown in Fig. 4.
Fig. 4. Dependence of incomes of OTG per 1 person. from agricultural production Іv
The analyzed dependence is at the level of 38%. This indicates an average relationship
between these indicators. It could be higher, since many peasant farms are engaged in
commodity production, but due to their exclusion from the tax field, local budgets receive
less revenue from taxes.
4 Discussion of results
Calculations confirm the impact of state financial regulation on sustainable agricultural and
rural development of territories. Our econometric analysis on the selection of indicators that
have the most significant effect on the efficiency of the allocation of funds proves the
hypothesis of the existence of a statistical relationship between state financial support and
indicators of sustainable development of regions.
However, despite the multiple data sets designated for monitoring in the Methodological
Recommendations [13], not all of them are equally useful for determining the criterion for
allocating budget funds for the development of regions. Therefore, there is a need to abolish
some indicators, while others, on the contrary, to expand.
Given the limited financial resources that the Government of Ukraine can direct to the
development of territories, it is necessary to prioritize the allocation of resources and focus
them on effective measures that can provide high results in the shortest possible time and
carry out a long-term and comprehensive impact on the development of regions.
The Strategy, developed in the pre-crisis period, contains a list of many performance
indicators, based on the analysis of the main trends in the socio-economic development of
regions over the past 20 years and problems. Objective 3 "Effective public administration in
9SHS Web of Conferences 106, 01029 (2021) https://doi.org/10.1051/shsconf/202110601029
MTDE 2021
the field of regional development" has been defined, which has 5 points of the structure and
by 2020 some results have already been obtained [12] (tab. 6).
Table 6. Components of public administration Regional development strategies (Goal 3).
Structure of Goal 3 Status of implementation
1.Decentralization of power, Measures are being taken to further introduce decentralization
reform of local government processes, as of 19.03.2020 1,049 communities were formed
2.Improving the system of The new model of financial support contributed to an
strategic planning for regional increase in the revenue base of local budgets, revenues
development increased 4 times to UAH 275 billion in 2019 against 2018
3.Improving the quality of The introduction of tax preferences by the government, a
public administration of land market, additional budgetary support motivated the
regional development unification of communities
4. Strengthening cross-sectoral Modern methods and means of cooperation are used, 1285
coordination of government communities signed 566 cooperation agreements in 2019
policy
5.Institutional support of Formation of regional development agencies as a factor in
regional development ensuring sustainable development and creating conditions for
enhancing investment
As a result of the national and global crises, a need arose to reduce the list of priorities
for regional development in order to concentrate financial resources on the main tasks that
have a systemic and long-term impact on the development of regions and the national
economy as a whole.
To substantiate this conclusion, we have constructed a diagram of the optimal distribution
of funds to support agricultural production from local budgets according to the integral index
of production (Ih) (Fig. 5). At the same time, the blue lines are the actual distribution, the red
lines are the leveled distribution of funds to support agricultural production from local
budgets according to the integral production index.
Fig. 5. Optimal distribution of funds to support agricultural production from local budgets according to
the integral index of production (Іz).
The data indicate that some regions receive more funds from the state budget than their
contribution to the structure of the agricultural GDP, which, in theory, was the guarantor of
fair distribution. Such imbalances are eliminated precisely by a well-thought-out and
10SHS Web of Conferences 106, 01029 (2021) https://doi.org/10.1051/shsconf/202110601029
MTDE 2021
effective policy of financial regulation, which contributes to the sustainable development of
rural regions.
We also investigated the possibility of equalizing the OTG rating in terms of local budget
revenues according to the criterion of integral ratings of production If and financing If (Fig.
6). At the same time, the blue lines are the actual rating, the red lines are the aligned rating
of incomes of local budgets of OTG according to the integral ratings of production If and
financing If.
Fig. 6. Alignment of the rating of incomes of local budgets of OTG according to the integral ratings of
production Iz and financing If.
In part, these conclusions were used to formulate the Strategy for Rural Development for
the period up to 2030, developed by scientists of the NSC "Institute of Agrarian Economics"
[15].
5 Conclusions
The confirmation of the influence of financial regulation on sustainable development was
obtained, which confirmed the hypothesis put forward about the existence of a certain natural
relationship between the dynamics of the development of the agricultural sector and state
support, taking into account production, economic and social factors.
The indices and ratings of the development of the agrarian regions of Ukraine were
determined according to the main indicators for 2017-2019. The analysis of the nature of the
dependence of agricultural GDP, lending, payments from the Territorial Development Fund
and other main macroeconomic indicators is carried out. The nature of the dependence of
changes in the output of agricultural products, financial performance indicators and social
factors is revealed, and the average degree of dependence between them is established. The
existence of a significant statistical relationship (a significant correlation coefficient and a
statically significant correlation-regression model) between the financing indicator and
indicators of agricultural and rural development has been proved. The study makes it possible
to substantiate the necessity and expediency of taking into account the influence of groups of
factors on the formation of a package of government programs to support regions.
11SHS Web of Conferences 106, 01029 (2021) https://doi.org/10.1051/shsconf/202110601029
MTDE 2021
The rating assessment of sustainable development of rural regions by groups of indicators
characterizing the patterns of distribution of financial resources is given, which will allow
regions with a low rating to focus on the most important measures to level the estimated
indicators.
In order to ensure sustainable development of rural regions, it is recommended to reduce
direct agricultural subsidies, increase the allocation of funds for social development, and
finance the most effective programs. To monitor the process of the effectiveness of financial
regulation, it is proposed to use production, economic and social indicators in conjunction
with the integral, which will become a more reliable basis for the distribution of budgetary
allocations for agricultural and social development in Ukraine.
Further continuation of the study of the topic of choosing indicators for monitoring and
assessing agricultural and rural development for Ukraine should be based on indicative
planning [4] (Strategic Directions, 2020). according to the formed principles of the strategy
for sustainable development of rural areas in the following areas: natural resource potential,
settlement aspects, sustainable development management, diversification of the rural
economy, employment, improving the well-being and social protection of the rural
population; development of entrepreneurship and service cooperation, innovation support,
improvement of housing conditions, transport infrastructure, general education services,
medical assistance, agritourism and recreational potential, environmental safety, financial
and investment support, credit support, information and consulting activities for the
development of the village and the social sphere.
References
1. Sait Ministerstva finansiv Ukrainy. The website of the Ministry of Finance of Ukraine.
https://index.minfin.com.ua/economy/gdp/2019/
2. Food and Agriculture Organization of the United Nations. Sustainable Development
Goals (2018). http://www.fao.org/sustainable-development-goals/overview/en
3. V.Ia. Mesel-Veseliak, E.Iu. Hryshchenko, Ekonomika APK, 11, 11 (2017)
4. O. Sokil, V. Zhuk, L. Vasa, Integral assessment of the sustainable development of
agriculture in Ukraine. Economic annals-XXI, 170 (2018)
5. S. Kozlovskyi, V. Baidala, O. Tkachuk, T. Kozyrska, Montenegrin Journal of Economics
14(4), 175 (2018)
6. P. Chopin, J.M. Blazy, L. Guindé, R. Tournebize, T. Doré, Land Use Policy, 62, 132
(2017)
7. M. Morkunas, P. Labukas, Agriculture 10(6), 228 (2020).
8. R. Crescenzi, De Filippis, F. Pierangeli, Regional Studies 49(4), 681 (2015)
9. On the coordination of materials of the Procedure and Methods for monitoring and
evaluating the effectiveness of the implementation of the state regional policy.
Resolution of the Cabinet of Ministers of Ukraine 21.10.2015 № 856.
https://zakon.rada.gov.ua/laws/show/856-2015-%D0%BF#Text
10. Information about the monitoring of the development of rural areas (mountain, OTG).
https://www.minregion.gov.ua/napryamki-diyalnosti/derzhavna-rehional-na-
polityka/monitorynh/informatsiya-pro-monitoring-rozvitku-silskih-teritoriy-girskih-
otg/
11. State Statistics Service of Ukraine. Agriculture of Ukraine in 2000-2017: statistical
collection. http://www.ukrstat.gov.ua/
12SHS Web of Conferences 106, 01029 (2021) https://doi.org/10.1051/shsconf/202110601029
MTDE 2021
12. Report on the results of monitoring and evaluating the effectiveness of the
implementation of the state regional policy in 2019. https://www.minregion.gov.ua/wp-
content/uploads/2020/05/analiz-soczialno-ekonomichnogo-rozvytku-regioniv-za-2019-
rik.pdf
13. About the consolidation of methodical recommendations and the formulation and
implementation of forecast and program documents of the social and economic
development of the united territorial community 30.03.2016 № 75.
https://zakon.rada.gov.ua/rada/show/v0075858-16#Text
14. Indicators Execution of OTG budgets. https://decentralization.gov.ua/news/11926
15. Yu.O. Lupenko, M.I. Malik, O.H. Bulavka ta in. Strategic directions for sustainable
development of rural areas for the period up to 2030, Kyiv: NNTs IAE (2020)
13You can also read