Solar production prediction based on non linear meteo source adaptation
←
→
Page content transcription
If your browser does not render page correctly, please read the page content below
Solar production prediction based on non linear
                 meteo source adaptation

                           Mariam Barque,Luc Dufour, Dominique Genoud, Arnaud Zufferey                     1

                                      Bruno Ladevie and Jean-Jacques Bezian 2

          1 Institute of Information Systems, University of Applied Sciences Western Switzerland (HES-SO), Sierre, Switzerland
                                                2 UMR CNRS 5302, Mines Albi, France
                              Email:(mariam.barque, luc.dufour, dominique.genoud, arnaud.zufferey)@hevs.ch,
                                                 (bruno.ladevie and bezian)@mines-albi.fr

    Abstract—This work presents a data-intensive solution to          We can cite the example of A. Mellit, a reference author
predict Photovoltaı̈que energy (PV) production. PV and other          in the subject who achieve a MAPE less than 6% for
renewable sources have widely spread in recent years. Although        day-ahead solar radiation in Algeria [2]. Regression trees
those sources provide an environmentally-friendly solution, their     are not widely used but show a MAPE of 33% for PV
integration is a real challenge in terms of power management as       production prediction [3]. Some weather providers have
it depends on meteorological conditions. The ability to predict
those variable sources considering meteorological uncertainty
                                                                      also developped solar production forecast solutions like
plays a key role in the management of the energy supply needs         Meteoblue who reaches an average annual MAPE of 28%
and reserves. This paper presents an easy-to-use methodology to       in Europe using a deterministic approach [6].
predict PV production using time series analyses and sampling
algorithms. The aim is to provide a forecasting model to set the
day-ahead grid electricity need. This information useful for power        Since it is essential for grid operators to analyze
dispatching plans and grid charge control. The main novelties of      and adapt forecast results according to their experience,
our approach is to provide an easy implemented and flexible           flexible and user-friendly approaches are preferred. A PV
solution that combines classification algorithms to predict the       plant can be modeled as a system that converts the suns
PV plant efficiency considering weather conditions and nonlinear      radiation with a given efficiency. This efficiency is highly
regression to predict weather forecasted errors in order to           related to the solar radiation slope and cells temperature.
improve prediction results. The results are based on the data         Therefore, at a fixed temperature and slope, the power
collected in the Techno-ples microgrid in Sierre (Switzerland)        produced grows close linear to the global radiation. As
described further in the paper. The best experimental results
have been obtained using hourly historical weather measures
                                                                      such, our approach focuses on analyzing and forecasting
(radiation and temperature) and PV production as training             this efficiency with statistical tools easy to understand and
inputs and weather forecasted parameters as prediction inputs.        to use. The method we propose can be used at di↵erent
Considering a 10 month dataset and despite the presence of 17         levels:
missing days, we achieve a Percentage Mean Absolute Deviation         At a mid-term level to anticipate and optimize
(PMAD) of 20% in August and 21% in September. Better results          energy production and make the appropriate choices
can be obtained with a larger dataset but as more historical data     of investments through energy markets. At a short-term
were not available, other months have not been tested.                level, grid operators should be able to schedule the
     Keywords—Solar production prediction; PV forecast; Data in-      day-ahead needs in order to manage the stability of the
telligence analysis; Microgrid; Advanced Metering Infrastructure;     grid and control the reserve capacity.
Energy information management; KNIME;

                                                                          According to experts in Computational intelligence, a
                  I.   INTRODUCTION                                   single algorithm may not be successful in resolving all prob-
    PV is the fastest-growing energy technology since                 lems. Most methods described above use neural networks
2002 with an average increase of 48% [1]. The majority                and a few of them use regression trees. Combining models
plants are grid-connected systems and a high penetration              is recommended as ensemble of heterogeneous models leads
of PV (like in the case of islands) raises issues for the             to a decrease of the ensemble variance as the errors of the
grid-operators. Subsequently, forecasting the power output            individual models have small correlations [4]. We propose,
of the PV plant is necessary to assure the grid stability.            in this paper, to combine decision trees and non linear
                                                                      regression. Contrary to most studies, we do not forecast
                                                                      solar radiation but simply correct the forecasted data given
    A large amount of research studies in the domain lay              by meteorological enterprises using time series analysis
emphasis on predicting solar radiation which is a key data            on historical predictions. Our methodology presents two
to improve the results. Neural networks are widely used               stages. As a first stage, the historical data are used to
to this purpose and manage to reach a MAPE around 7%                  predict the conversion efficiency of the solar panels and as
on monthly and day-ahead solar radiation forecast [1].                a second stage, solar radiation forecast is used to predict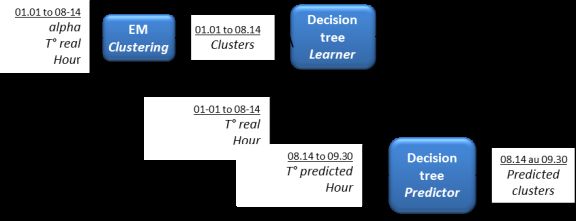
Solar production prediction based on non linear meteo source adaptation
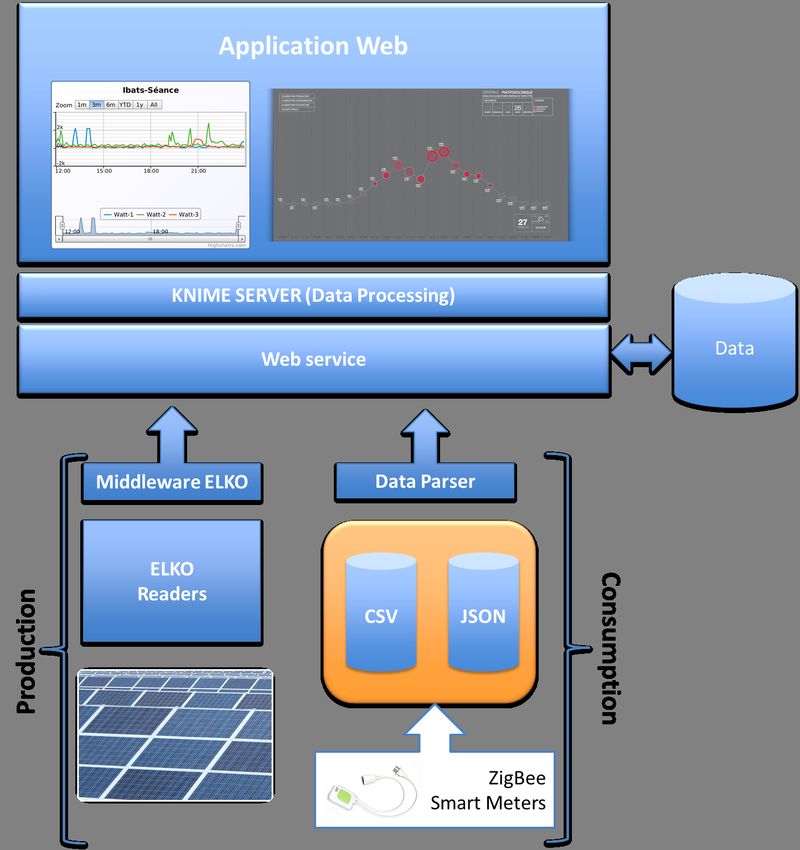
the total PV plant production. The paper is organized as parameters (load curves from the photovoltaic plant
follows: In Section I the information system test bed and provided by ELKO, and the grid consumption provided
the data set used are presented. Section II describes the by Sierre-energy) and high frequency parameters (devices
methodology. In Section IV, the results are described and measures from the Ecowizz Zigbee smart meters). The
analyzed. Finally we conclude and discuss future directions information system contains the elements necessary for
of research in Section V. the storage of data via NO-SQL as the data is formatted
in JSON.
II. EXPERIMENTAL SETTING
A. Techno-Pôles microgrid implementation
In energy distribution, new metering solutions have
been proposed, based on the idea that exploiting properly
data on power generation, distribution and consumption,
a substantial increase in efficiency is achievable [6]. The
Internet of Things aims at facilitating the communications
of such systems. In particular, smart metering is one of
the initial and more extended use cases for the Internet
of Things [7]. Several solution have been deployed with
ZigBee [8], [9] [10], and ZigBee-IP [11]. In addition,
Wireless Smart Utility Network (WI-SUN) is also
extended with new IoT-related technologies such as
IEEE 802.11g (subGhz) [12] and o↵ers plenty of new
opportunities to monitor the energy consumption at
Fig. 1. I-BAT information system architecture based No-SQL databases
dierent levels, i.e. overall consumption and also the
independent consumption from specific devices.
Techno-Pôles microgid is contextualized in the I-BAT B. Data set description
Swiss Project 4. This project is a convergence of expertises
in several areas of energy management. The objective
was to build a modular and intelligent information
system capable of regulating futures sub-networks of the
power supply grid. It results in the development of two
microgrids at the Techno-pôle in Sierre able to measure
and collect energy production and consumption each
second. The data are displayed in real-time through:
http://www.technopole-vert.ch. An Advanced Metering
Infrastructure (AMI) based on the Internet of Things Fig. 2. Dataset description
(IoT) has been implemented in the Techno-Pôle testbed.
This deployment provides energy-related parameters All data are aggregated hourly and available from
such as the overall building load curves and a wireless 01.01.2014 to 10.03.2014. In addition to historical PV
network of IoT-based smart meters to measure and control production measures, the dataset contains historical real
appliances. measures and forecast values of temperature and radiation.
The forecasted weather values are a one day-ahead predic-
The Techno-Pôle of Sierre, the sunniest city in Switzerland tion in 2014. It is important to note that all weather data
has a 203 kWp PV plant that represents 1200 m2 of the are available for Sion which is at 15 km of our production
roof surface. A weather station have been recently site in Sierre. Actually most of weather stations in Sierre
installed in 2015 and will provide more accurate weather only provide precipitations measures. 17 day missing values
data for the microgrids energy management. The site which are deleted are due to the system maintenance.
gathers 500 people working for 50 companies including PV power production values range from 0 to a maximum
private service providers as well as research institutes like of 171 kW with an average power of 32 kW per day
HES-SO which carried out the microgrid project. The (including night). Weather forecasted data shows a total
building has a restaurant, a fitness room and also multiple Percentage Mean Absolute Deviation (PMAD) of 26% on
classrooms and labs. All of the occupants have signed an radiation prediction and 7% on temperature prediction.
agreement o↵ering full access to their consumption for 80% (01.01.2014 to 10.03.2014) of the dataset is used for
research purposes. The microgrid can also operate as an training and 20% for prediction tests (08.16.2014 to 03-10-
energy storage management demonstrator as batteries 2014).
of 25 kWh with a remote control of charge/discharge
have been installed. PV electricity production becomes a
key information as an input of the optimization of such III. METHODOLOGY
systems.
In this section, the training model and the error model
In detail, metering infrastructures provide low frequency are presented(cf.Fig3).
Institute of Information System 2 UMR CNRS 5302Solar production prediction based on non linear meteo source adaptation
Fig. 3. Steps of the methodology implemented in KNIME
A. Data pre-processing
There are two stages in the training step: The first is to find
This step aims at collecting and pre-processing data. clusters on alpha regarding hour and temperature values
The data collected are described in the previous sec- with an Expectation-Maximization (EM) algorithm. As
tion. The max production collector goal is to calculate a such, the clusters identified depend on the hour and the
maximum PV production per day that will enable us to temperature. This analysis of alpha values is a key step
correct overestimated power prediction values. The ideal as it enables us to understand how this ratio depends
maximum value should correspond to the sunniest possible on hour and temperature trough Gaussian distributions.
conditions for this day. More weather parameters on a As described in the picture below, clusters and real
larger period are needed to estimate this ideal value. We temperature (T) values will then be the inputs of the
assume in our approach that it is the hourly maximum decision tree learner. The decision tree predictor will
production value of the week before the day to predict. return the cluster prediction using hour of day and
The day and night splitter uses daily sunrise and sunset temperature forecast values as inputs.
information in order to split the dataset. As night power
production is close to zero, only hours between sunset and
sunrise will be predicted for each day. Those hours range
from 6 AM to 9 PM in our dataset.
B. Training and prediction
Its important to note here that only the alpha ratio
is predicted. We remind here that alpha is the power
production divided by the solar radiation measures. This
calculation enables us to have a normalized dataset for
prediction. Another approach could be to calculate per Fig. 4. Description algorithms inputs and outputs
hour the maximum production for each day (obtained
from the best possible radiation on a clear day) and
consider the percentage of this maximum produced for C. Weather forecast error prediction
each day in the training test and then predict it given
weather condition for the test set. In our case, the aim is As mentioned in the abstract and introduction weather
to estimate the 24 values of alpha that will enable to easily parameters are not predicted in our study. To be rep-
calculate the day production knowing the 24 radiation resentative of most of grid operators, we use forecasted
values forecasted for this day. As noted in the previous values from national weather services. Nevertheless, the
section, only daytime hours are predicted, night alpha analysis of historical forecasted measures of radiation
values are assumed null. As a PV plant efficiency depends and real measures of radiation shows a predictable error.
on two key parameters that are radiation inclination Actually the sunnier the hour, the more underestimated
(assuming cells slope is constant) and cells temperature, the forecasted radiation is. A polynomial regression on
the training inputs will be the hour of day and the radiation forecast errors enables us to go from 16% to 5%
ambient temperature. The wind speed can also a↵ect cells of PMAD on radiation forecast errors for the test set (20%
efficiency as it influences the cells temperature but this of the dataset).
data will not be considered in our results as the parameter
is not collected by weather stations in Sierre. Snow height D. Power prediction
is also a key parameter to avoid huge errors in winter due
to the presence of snow on the PV cells surface. As our According to alpha definition, the predicted power for
prediction focuses on August and September, precipitation each year is given by the formula below: The decision tree
data will not be taken into account. output is the predicted cluster.The predicted alpha value is
Institute of Information System 3 UMR CNRS 5302Solar production prediction based on non linear meteo source adaptation
standard deviation of errors. For solar power prediction,
the MAE gives a better understanding of prediction errors
(7.8 kW in August and 7 kW in September). Actually
the hourly electricity cost on markets is fixed per kW
taken as the clusters mean value. The max power produc- and does not depend on the percentage of the energy
tion estimated in the data collecting and processing step to buy to the total production. For the percentage error
is used as a final stage to erase overestimated production criteria, the Percent Mean Absolute Deviation (PMAD) is
prediction. The results are given in the following section. preferred instead of the Mean Absolute Percentage Error
(MAPE) for solar power prediction. The PMAD is 20%
IV. RESULTS for August and 21% for September. Scenario A compared
to scenario B shows that in August, (resp September)
A. Clustering and decision tree results 6% (resp 3%) of the PMAD error is due to radiation
Alpha values are divided into 6 clusters based on the prediction errors. Therefore, the power prediction error due
training dataset. to alpha prediction is 14% (resp. 18%) for August (resp.
September). The third part of the table shows the impact
Cluster 0 1 2 3 4 5 of radiation forecast correction on the results. It enables
Instance 7% 13% 8% 43% 22% 7%
Mean 0.22 0.14 0.2 0.18 0.17 0.20
us to save respectively 4% (resp. 7%) of errors in August
stdev 0.30 0.04 0.12 0.05 0.02 0.10 (resp. Sept) which represents approximately 2 kW per day.
TABLE I. A LPHA CLUSTERING RESULTS
C. Results Analysis
The classification accuracy of the predicted cluster on
the test dataset is 88%. The less accurate classified cluster
is the 4th with an accuracy of 50% while other clusters have
an accuracy of more than 88%. Cluster 4 covers 11 AM to *
● PW real
150
* PW predict
1 PM which generally corresponds to the sunniest hours ●
* ● ●
of the day. These hours also have the highest radiation
forecast errors. ● *
●
*
B. Prediction performance description ●
*
100
Month MPPROD MAE RMSE PMAD MAPE STDEV
kW kW kW % % kW ●
kW
08 38 7.8 18.3 20 28 16.4 *
09 32 7.0 13.9 21 26 12.1 ●
*
TABLE II. F ULL M ETHODOLOGY RESULTS
*
50
**
●
● ***
●●
●
Month MPPROD MAE RMSE PMAD MAPE STDEV * * ●●
* ●●
●
kW kW kW % % kW ● *
08 38 5.4 9.8 14 23 8 * *
●
09 32 5.7 11.6 18 34 10 *
● * *
●
●
TABLE III. R ESULTS ASSUMING PERFECT RADIATION FORECAST ●●●●●●● ************
●●●●●●●●●●●● ***
●●●●●●
0
******* ***
19.08.2014 19.08.2014 12:00 18.09.2014 18.09.2014 12:00
Month MPPROD MAE RMSE PMAD MAPE STDEV
Hours
kW kW kW % % kW
08 38 9.5 19.4 24 22 17.0
09 32 9.0 16.4 28 34 13.7
Fig. 5. Exemple of days with the smallest MAE error for two different days
TABLE IV. R ESULTS WITHOUT RADIATION ERROR FORECAST PREDICTION (08.19.2014 and 09.18.2014)
The average PMAD for the two days are respectively
The results are given for 3 scenarios. Scenario A shows
5% and 26% and the MAE related is 1 and 2 kW. The
the results of the full methodology described in the pre-
high PMAD value for the second day is due to a lower
vious section. Scenario B shows the production assuming
production. This gives a typical example why MAE and
a perfect radiation forecast (forecasted radiation equals to
RMSE values give a better understanding of prediction
real radiation). The aim is to analyze errors that are only
errors. As shown in the graph, the prediction fits well
due to alpha prediction. Scenario C shows the production
with the real power production. The second day on the
prediction using the basic forecasted radiation. The aim is
graph shows that low values of production can also be well
to see the impact of radiation forecast correction on results.
predicted. The errors on alpha prediction are respectively
The first column MPROD is the average production 9% and 15%. The first day represents an ideal sunny day
per day (24 hours) given as a reference for a better under- when solar radiation is easier to predict. The percentage
standing of the Mean Absolute Error (MAE) and the Root of sun duration compared to the maximal sun duration
Mean Square Error (RMSE). The STDEV criteria is the possible for the locality is 80% and the cloud cover
Institute of Information System 4 UMR CNRS 5302Solar production prediction based on non linear meteo source adaptation
parameter indicates a clear day. For the second day, the from January 2014 to October 2014, the PV efficiency is
sun duration ratio is 10% and the cloud cover parameter estimated with an average PMAD of 16% for August and
indicates a cloudy day. However the prediction fits also the September. The forecasted radiation collected is corrected
real power well, as weather forecast is accurate for this day. with a polynomial regression so that the related power
prediction have an average PMAD of 20% instead of 26%.
Results errors are higher in the sunniest hours. At 11 AM,
12, 1 and 2 PM the MAE is more than two times higher
than the other hours predicted (18 kW vs 8 kW). In a
● Irr predict ● sunny and clear day, the production is easier to estimate.
400
Irr real
● PW real ● It becomes an issue on cloudy and windy days when the
PW predict ●
global radiation is subject to more variations. The results
●●
● can be improved if the maximum possible production per
day is given as an input. A larger dataset and more
300
weather parameters should help to estimate the maximum
● ●
production and improve the results. Moreover, a prediction
●
● ● per hour should also improve the results. It would enable
●
●
us to focus the prediction work on critical hours where
kW
●
200
●
●
●
● other algorithms like nonlinear regression or SVM should
●
●
●●
be helpful for a better accuracy of alpha prediction.
●
●
●
●
●
●
VI. ACKNOWLEDGEMENTS
100
●
●
●
● ●● This research was undertaken as part of the I-BAT and
● ●
●
●●
●
ELF4U (Electricity load forecasting for utilities) projects
●
●
●
●
●●
●
●●● and have been funded by Information system institute ,The
●
●●●●●●●
●
●●●●●●●●●●●● ●●●●●● Ark Energy and the eEnergy Center (Projects No. 712-07,
0
714-10).
05.09.2014 05.09.2014 12:00 20.09.2014 20.09.2014 12:00
Hours
R EFERENCES
[1] M. Cococcioni, E. DAndrea, B. Lazzerini, One day ahead forecasting
of energy production in solar photovoltaic installations: An empirical
Fig. 6. Exemple of days the highest MAE error for two different days study, Intelligent Decision Technologies 6 , 2012
(09.05.2014 and 09.20.2014) [2] A. Melli, M. Benghanem, S. A. Kalogirou. An adaptive wavelet-network
model for forecasting daily total solar-radiation. Applied Energy, vol.
83, no. 7, p. 705-722, 2006.
The MAE of these days are respectively 14 and 12 [3] F. Nomiyama, J. Asai, J Murata, A study on Global Solar Radiation
kW on an average production of 16 and 31 kW which Forecasting Using Weather Forecast Data, IEEE, 2011
leads to a PMAD of 90 resp. 40%. The graph shows [4] R. Hossain, M. B. M. Shawkat, Hybrid Prediction Method of Solar
Power using Different Computational Intelligence Algorithms, IEEE,
sudden variations of radiation which is typical for cloudy 2013
and windy days. Actually, most of the highest MAE errors
[5] Z. Fan, G. Kalogridis, C. Efthymiou, M, Sooriyabandara, M. Serizawa,
occur on cloudy days of low sunshine duration. The cloud J. McGeehan, The new frontier of communications research: smart grid
cover is 10% and 50% for the two days represented in and smart metering. In Proceedings of the 1st International Conference
the graph. These instable weather conditions are more on Energy-Efcient Computing and Networking. pp. 115118, ACM.
difficult to predict. As the graph shows, the evolution of [6] Meteoblue, Point Solar Radiation Forecast Controlled Quality, Basel,
the predicted power follows the one of forecasted data so 2013, https://content.meteoblue.com/en/products/meteoblue-api/solar
that high variance in radiation forecast are reflected in [7] S. W. Luan, J. H. Teng, S. Y. Chan, L. C. Hwang, Develop-ment of a
the production forecast. The first day, the error is due to smart power meter for AMI based on ZigBee communication. In Power
Electronics and Drive Systems, PEDS 2009. International Conference
both wrong radiation and alpha forecast with PMAD of on. pp. 661-665, IEEE, (2009).
40% and 60% respectively whereas radiation forecast is [8] M. Castro, A. J. Jara, A. F. Skarmeta, (2013), Smart Lighting Solutions
more responsible for the second day error as its PMAD for Smart Cities. In Advanced Information Networking and Applications
is 48% and alpha prediction PMAD is 1%. Moreover, Workshops (WAINA), 2013 27th International Conference on. pp.
results show that the average error per hour is higher in 13741379, IEEE.
sunny hours. According to the results, the highest MAE [9] T. Watteyne, L. Doherty, J. Simon, K. Pister, Technical Overview of
hours are 11 AM to 2 PM with an average of 18 kW SmartMesh IP. In Innovative Mobile and Internet Services in Ubiquitous
Computing (IMIS), 2013 Seventh International Conference on, pp. 547-
whereas the MAE has an average of 8 kW for the other 551, IEEE, 2013
predicted hours. Actually this error trend is also observed [10] Z. Shelby, Embedded web services. Wireless Communications, IEEE.
in radiation forecast data. Vol. 17, no. 6, pp. 52-57, 2010.
[11] V. C. Gungor, B. Lu, G. P. Hancke, Opportunities and chal-lenges of
V. CONCLUSIONS wireless sensor networks in smart grid. Industrial Electronics, IEEE
Transactions on. Vol. 57, no. 10, pp. 3557-3564, 2010
The prediction work in our approach focuses on the [12] A. Mellit, S. A. Kalogirou, Articial intelligence techniques for pho-
PV energy conversion ratio from sun radiation. Using an tovoltaic applications: A review. Progress in Energy and Combustion
EM clustering algorithm and decision trees on a dataset Science n1-1, p 52-76, 2008.
Institute of Information System 5 UMR CNRS 5302You can also read