PHEV Hymotion Prius Model Validation and Control Improvements
←
→
Page content transcription
If your browser does not render page correctly, please read the page content below
PHEV Hymotion Prius Model Validation and Control
                          Improvements

                                            Qiandong Cao
                 Argonne National Laboratory, 9700 S. Cass Avenue, Argonne, IL 60439
                                   630-252-7261, Fax 630-252-3443

                      Sylvain Pagerit, Richard “Barney” Carlson, Aymeric Rousseau
                                       Argonne National Laboratory

Abstract
Argonne National Laboratory, working with the FreedomCAR and Fuels Partnership, maintains vehicle
simulation software: the Powertrain System Analysis Toolkit (PSAT). Because of the importance of
component models and the complexity involved in setting up optimized control strategies, the models and
controls developed in PSAT require validation. The highly instrumented Toyota Prius, including engine
and half-shaft torque sensors, was tested in Argonne’s Advanced Powertrain Research Facilities (APRF)
both in its original configuration and with the Hymotion L5 plug-in hybrid electric vehicle (PHEV)
battery pack to provide the data needed for a thorough comparison of model results and test data. This
paper first describes the vehicle test results and explains the validation process on the basis of an analysis
of the differences between the test and simulation results. Then it demonstrates the validation of the
PHEV Hymotion Prius. Finally it assesses the impact of different control strategy options for the PHEV.

Keywords: plug-in, hybrid, modeling, validation, control strategy

1.      Introduction
Plug-in Hybrid Electric Vehicles (PHEV) is a promising alternative to conventional gas-powered
vehicles. As the energy storage system can be recharged using an outside plug, their battery can be
depleted allowing significant fuel displacement.

Because the set of conceivable hybrid electric vehicle (HEV) powertrains is so large, it is impractical to
perform an exhaustive search that uses fabrication and testing of prototypes to provide information on the
ideal powertrain for a given application. Instead, a simulation tool should be used to provide guidance of
similar quality, assuming that the models accurately predict the behavior of the powertrains under
investigation. The simulation tool used here to develop the vehicle model is the Powertrain System
Analysis Toolkit (PSAT), a state-of-the-art, flexible, reusable simulation package developed by Argonne
National Laboratory (Argonne). PSAT [1, 2] is designed to serve as a single tool that can be used to meet
automotive engineering requirements throughout the development process, from modeling to control. One
of the most important characteristics of PSAT is that it is a forward-looking model; it allows users to
model real-world conditions by using real commands. For this reason, PSAT is called a command-based
or driver-driven model. Written in Matlab/Simulink/Stateflow [3], the software allows the simulation of a
wide range of vehicle applications, including light- (two- and four-wheel-drive), medium-, and heavy-
duty vehicles. In 2004, PSAT, the primary vehicle simulation tool supporting FreedomCAR and the
Vehicle Technologies Program [4], received an R&D 100 Award, which highlights the 100 best products
and technologies from around the world newly available for commercial use.

The Advanced Powertrain Research Facility (APRF) at Argonne handles U.S. Department of Energy
(DOE) technology validation and benchmark testing of advanced vehicle technologies. Argonne tests new
HEVs and plug-in HEVs (PHEVs) to provide data that are used to update PSAT. The data are also used to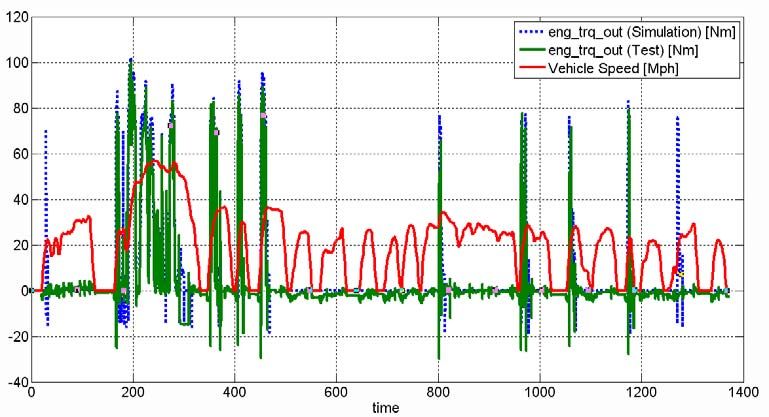
provide DOE and auto industry engineers with benchmark specifications that aid in forecasting future
technology developments.
To verify the accuracy of a PSAT model, the outputs predicted by the component and powertrain models
need to be compared to test data, a process referred to here as “validation.” This paper describes the steps
used to validate the Hymotion L5 PHEV model by using test data measured at Argonne’s APRF.
2. Vehicle Testing
2.1 Vehicle Description
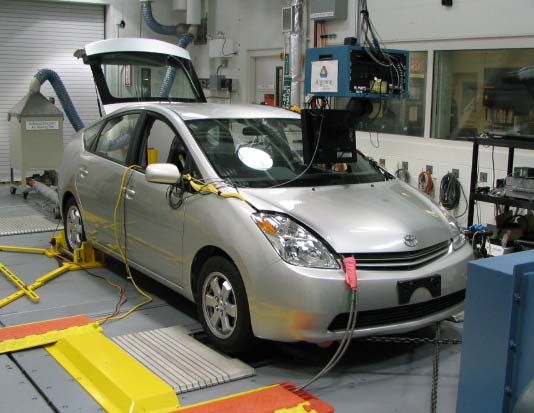
The Hymotion PHEV Prius, shown in Figure 1, contains a supplemental Li-ion battery pack to provide an
additional 5 kWh of electrical energy storage [5]. This system includes a control system to enable the
Prius to operate in a charge depleting (CD) mode. Controller area network (CAN) communication is used
to communicate with the production Prius powertrain controller and operate the vehicle in electric vehicle
(EV) mode at speeds of up to 40 miles per hour (mph) or until a power requirement threshold is exceeded.
As a result, the powertrain primarily uses electrical energy during urban driving, which minimizes engine
operation and thus reduces fuel consumption. This vehicle does not have a true all electric range (AER)
because of the engine operation requirements, but it is a good representation of a near-term PHEV.
Figure 1: Hymotion PHEV Prius on Chassis Dynamometer with Hymotion
5-kWh Battery System Installed in Parallel to the Production Battery
Before the installation of the Hymotion battery system, the Toyota Prius was tested extensively as a
production HEV at Argonne by using the dynamometer coefficients of the 2004 production Prius. For
direct comparison, the same coefficients were used for the Hymotion PHEV testing, but since the
Hymotion battery system weighs 73 kg, the test weight was increased to 1,546 kg. The dynamometer
coefficients used for the Hymotion PHEV Prius testing are shown in Table 1.
Table 1: PHEV Prius Dynamometer Coefficients
Coefficients A B C
Target 19.918 0.1393 0.0164
Dyno Set 3.604 -0.1538 0.0179
For the PHEV Prius testing, a 32-channel National Instruments PXI chassis was used to collect the signals
from the in-vehicle sensors and the dynamometer and test cell sensors. A Hioki “HiTESTER” was used to
measure the current and voltage of both onboard battery systems and to integrate amp-hours (Ah) and
kilowatt-hours (kWh). A CAN bus to universal serial bus (USB) communication device was used to read
and record parameters from the vehicle CAN bus that are used by the powertrain engine control unit
(ECU), as well as parameters from the Hymotion controller (such as state of charge [SOC] and various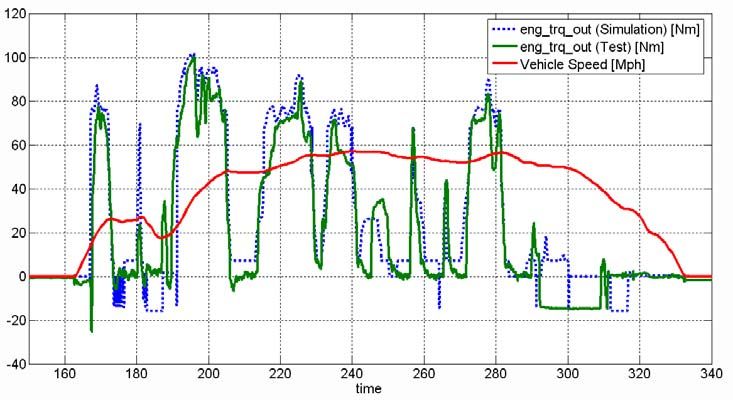
temperatures). An on-board diagnostic (OBD) scan tool was also used to read and record other
communication parameters from the vehicle CAN bus used by the Prius powertrain and battery ECU.

To properly evaluate the CD characteristics and the amount of petroleum displacement of a PHEV, the
vehicle was tested through the full discharge range of the pack by running repeated urban dynamometer
driving schedule (UDDS) cycles until the charge-sustaining (CS) operation was entered and the battery
SOC was charge-balanced over an entire drive cycle. The plug-in battery pack was recharged overnight to
prepare for more testing the following day.

2.2     Test Results on UDDS

Beginning from a cold start, the PHEV Prius was tested on consecutive UDDS cycles. The battery energy
was depleted through the second hill of the fourth consecutive UDDS. In total, 25 miles were driven in
CD mode. During those cycles, the powertrain is primarily operated using the battery energy, except
above 40 mph or when the EV mode power threshold was exceeded. After the repeated UDDS cycles
were completed, 4.3 kWh of AC energy was measured to fully recharge the battery pack. This charging
event took approximately 6 hours. Because 3.2 kWh of DC energy was used over the UDDS cycles, the
overall charging efficiency was approximately 75%. Table 2 shows the unadjusted results from the five
consecutive UDDS cycles.

Figure 2 shows the consecutive UDDS cycles. The red dots on the graph indicate when the engine is
operating and consuming fuel. Note the accumulated fuel consumed is much lower for the Hymotion CD
PHEV Prius (PHEV) than the stock CS Prius. After the vehicle fully depletes the usable battery energy, it
operates in the standard CS mode, just as a production Prius operates.

                         Table 2: Hymotion Prius, Consecutive UDDS Results
                              UDDS                      #1     #2   #3     #4  #5
            Miles Driven (mi)                          7.48 7.48 7.48 7.48 7.47
            Fuel Used (gal)                           0.051 0.037 0.040 0.101 0.113
            Electrical Energy Consumed (DC kWh)        0.93 0.96 0.94 0.23 -0.12
            Fuel Economy (mpg)                         148    200  187 74.3 66.4
            Electrical Consumption (DC Wh/mi)          123    128  125 30.6 15.9

                      Figure 2: Hymotion Prius Driven on Repeated UDDS Cycles;
                              Cold Start from 100% SOC to CS Operation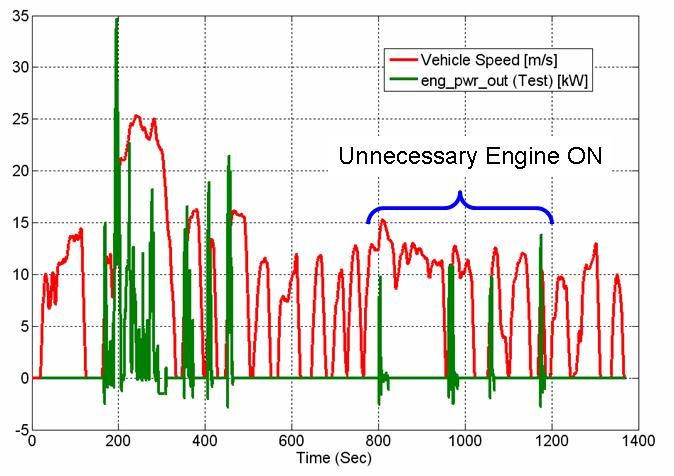
3.      Validation Process
To properly validate a model, several key parameters need to be measured. For advanced vehicles such as
power split vehicles, it is necessary to measure the torque of several components. Argonne has been
conducting very extensive testing of advanced vehicles, in terms of both instrumentation [6] and number
of tests.

Because of the large amount of data, a generic process [7] is necessary to automatically generate reports
that will allow engineers to quickly analyze data quality. This process, as shown in Figure 3, is based on
five steps:

        1. Automatically realign the data when different sources are used (e.g., emission bench,
           dynamometer).
        2. Select the proper sensor when the same parameter can be measured/recorded from different
           sources.
        3. Quantify the uncertainty of each sensor by comparing its values with measured or calculated
           parameters by using powertrain equations.
        4. Reuse existing post-processing capabilities developed initially for simulation purposes to
           automatically calculate effort, flow, power, energy, and efficiencies, as well as use the
           analytical tools already available in PSAT.
        5. Automate report generation so that complete analysis can be summarized in an HTML
           document within minutes.

Data post-processing usually includes filtering and merging sensors with different sample times. Because
these tasks were performed in the vehicle test facility, these functionalities were not implemented in the
process described in this paper.

                Vehicle Research        1- Import Data into PSAT
                Facility
                                        1- Import Test

                                                                                                  4- Calculate
                                                                                               Effort/Flow Based
                                                                                                  on Sensors
                                                             2- QA Level 1:
                                                             Individual Sensor
                                                                Evaluation

                                                                                 3- QA Level
                                                                                     2:
                                                                                    Sensor
                                                                                  Comparison

                                                                                                5- QA Level 3:
                                                                                               Sensor & Calculation
                                                                                                  Comparison

                                   Figure 3: Generic Data Quality Analysis Process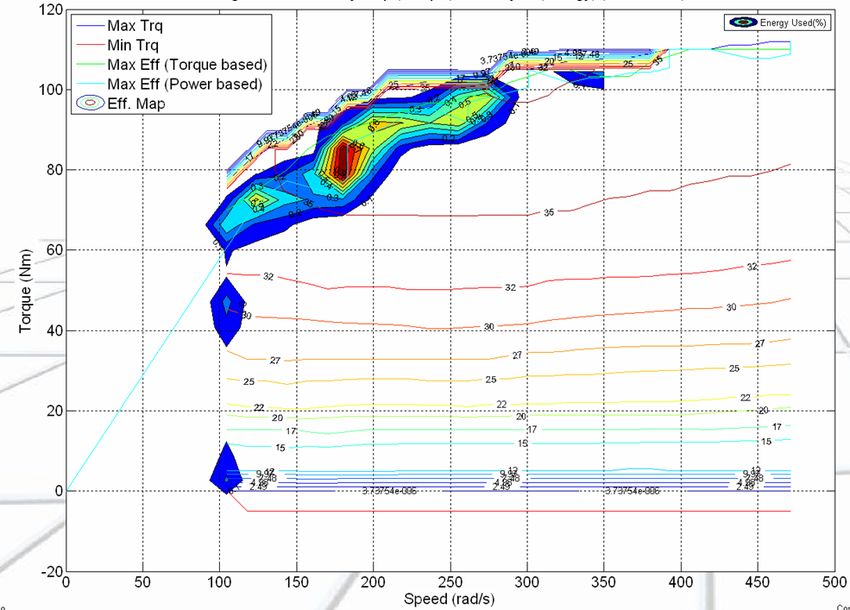
4.      Hymotion Prius Validation
The first step in the validation process consists of matching the component operating conditions, such as
engine ON/OFF, torque, and speed. Once each component operates according to the tests, the values for
fuel economy and electrical consumption should match the test data, pending component data accuracy.
The 2004 Prius HEV model was validated on the basis of component data provided by Oak Ridge
National Laboratory (electric machine and boost converter), Idaho National Laboratory (battery), and
Argonne (engine and vehicle). The performance characteristics of the additional components of the
Hymotion PHEV Prius (battery and power electronics) were estimated on the basis of component experts’
inputs. The battery model was developed by Argonne’s battery group to represent similar Li-ion
technology [8].

The validation was performed on both UDDS and highway fuel economy test (HWFET, i.e., highway
cycle) drive cycles. However, only the UDDS cycle data are presented in this paper cycle showed the
most differences when compared with the HEV Prius. Figure 4 shows the comparison between test and
simulated engine torque. Because Hymotion vehicle controller is unknown and the impact of the driver, it
is difficult to exactly reproduce every engine ON/OFF event. Except for the first and last events, all
engine ON/OFF events are reproduced in the simulation.

                    Figure 4: Engine Torque Comparison (UDDS during CD Mode)

Figure 5 shows the engine torque comparison on the second hill of the UDDS, showing good correlation
with the test data.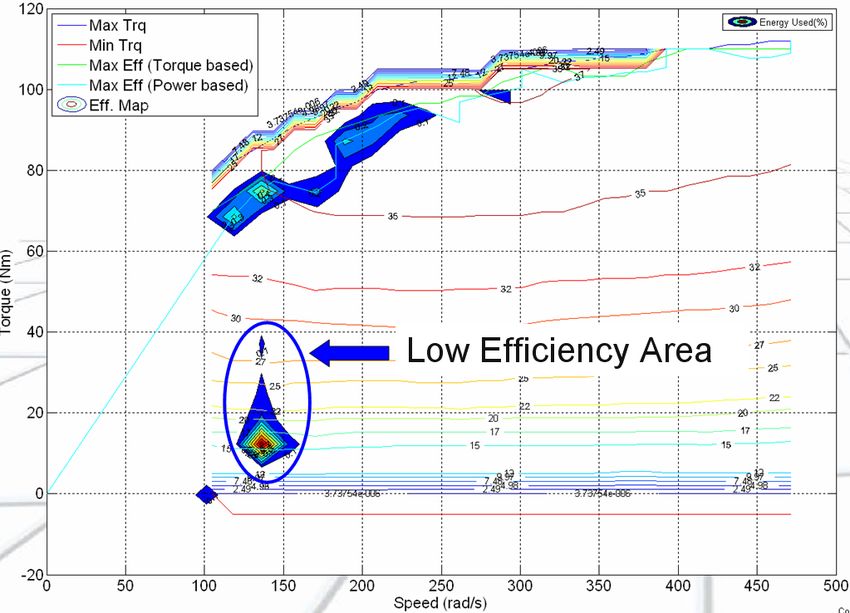
Figure 5: Engine Torque Comparison (UDDS during CD Mode) – ZOOM

Figure 6 shows the power of the high-capacity battery during a portion of the UDDS. Note that the battery
does not take part in the regenerative events.

             Figure 6: High-Capacity Battery Power Comparison (UDDS during CD Mode)

Tables 3 and 4 summarize the main results of the test and simulation for both CD and CS modes. Both
fuel and electrical consumption demonstrate good correlation with the test data.

                Table 3: Validation Results – UDDS during CD Mode (Test # 60610104)
                                                                  Absolute      Relative
              Parameter          Units        Test   Simulation Difference Difference
          Fuel Consumption l/100 km           1.33       1.22       0.11         8.8%
          Elec. Consumption     Wh/km         86.3       83.8        2.5         2.8%
          SOC Initial              %           62         62          0             0
          SOC Final                %           62        62.8        0.8         1.3%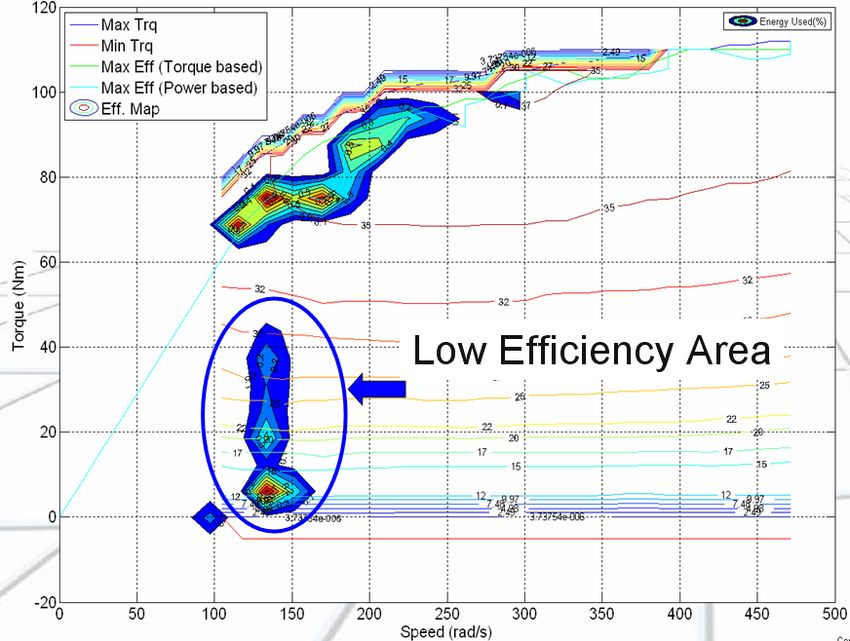
Table 4: Validation Results – UDDS during CS Mode (Test # 60610106)
                                                                     Absolute     Relative
                Parameter          Units        Test   Simulation Difference Difference
            Fuel Consumption l/100 km           3.64      3.58        0.06          1.7%
            SOC Initial              %           62        62           0             0
            SOC Final                %           62       61.8         0.2          0.3%

5.        Control Strategy Improvements
When analyzing the Hymotion control strategy, one notices that the engine average efficiency is lower in
CD mode than in CS mode, respectively 30.1% to 33.5%. This significant difference is due to the large
amount of fuel that is consumed at low power, as shown in Figure 7.

                                   Figure 7: Engine Operating Conditions
                           Density = f(Energy) − (UDDS during CD) − Simulation

Two control strategy changes were considered to improve the average engine efficiency during the cycle:

      1. Minimize the number of engine ON/OFF events.
      2. Operate the engine closer to its best efficiency curve.

5.1       Engine ON/OFF Reduction

As shown in Figure 8, several engine ON events occur at times of low vehicle-power demand during the
UDDS drive cycle. By changing some control parameters, such as the minimum power required at the
wheel to start the engine and the constraints of the power supply of the high-capacity battery, these engine
ON events can be deleted.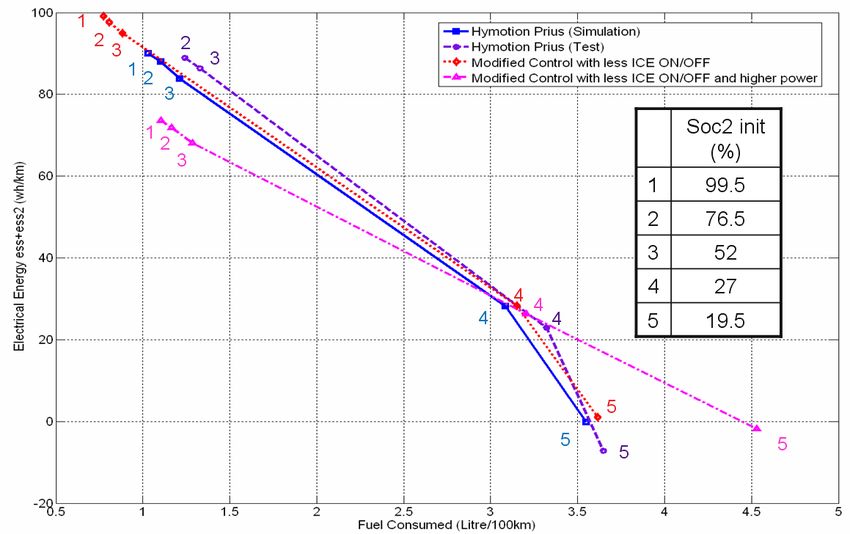
Figure 8: Engine ON/OFF Modification (UDDS during CD Mode)

As a consequence, the amount of fuel consumed in the low efficiency area decreases, as shown in
Figure 9. However, the engine still operates at low power, even when an engine ON event is required
because of high power demand or vehicle speed.

              Figure 9: Engine Operating Conditions after Engine ON/OFF Modification:
                           Density = f(Energy) − (UDDS during CD Mode)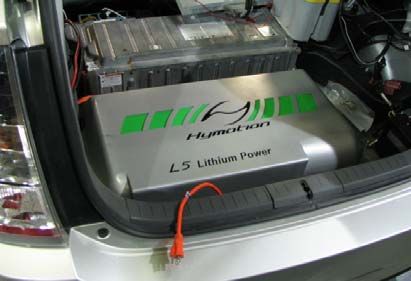
Figure 10 shows electrical consumption as a function of fuel economy for the reference control (from
both the test and simulation) as well as the modified control. Note that the relationship between both
energies remains unchanged.

        Figure 10: Energy Consumption Change Due to Fewer Engine ON/OFF Events (UDDS)

5.2     Engine Operating Condition Improvement

In addition to the engine ON/OFF event logic modifications, we also changed the engine operating
conditions during CD. As can be seen in Figure 11, the Hymotion Prius engine operates at lower power
during the second hill of the UDDS than does the Prius HEV. As a result, there is a drop in engine
efficiency.

         Figure 11: Engine Power Comparison between Hymotion and Reference Prius (UDDS)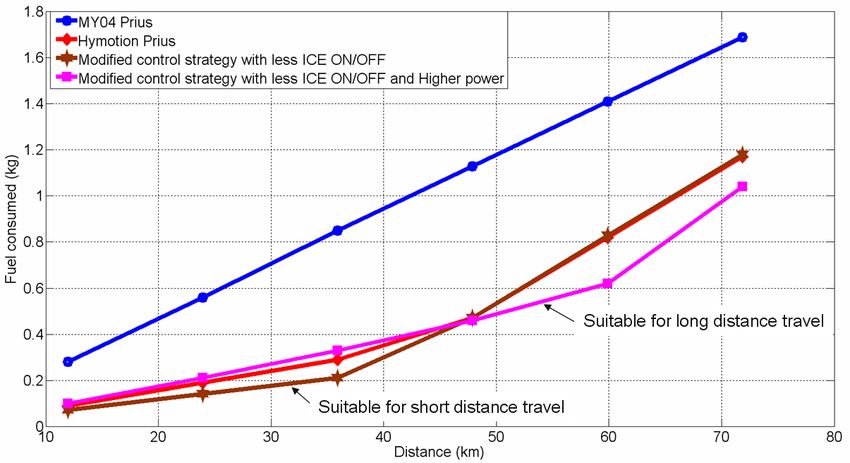
Figure 12 shows the engine power for both the HEV and the Hymotion Prius after control modification,
showing a good correlation. The control logic algorithm has been modified.

            Figure 12: Engine Power Comparison after PHEV Control Modification (UDDS)

The amount of fuel consumed in the area of low efficiency has now almost disappeared, as shown in
Figure 13.

        Figure 13: Engine Operating Conditions after Engine ON/OFF and Power Modifications:
                           Density = f(Energy) − (UDDS during CD Mode)
Figure 14 shows electrical consumption as a function of fuel economy for the reference control (from
both the test and simulation) as well as both modified controls. Note that the relationship between both
energies is now changed when the engine operates at higher power. The slope of the control based on the
higher engine power is not as stiff as the other slope. This is due to the fact that the engine is used to
recharge the battery. This approach is consistent to the one used in previous studies [9] based on global
optimization, which demonstrated that the engine, when ON, should operate close to its best efficiency
curve.
Figure 14: Energy Consumption Change Due to Control (UDDS)
5.3 Control Strategy Options Comparison
Figure 15 shows the amount of fuel consumed after driving six UDDS cycles in a row as a function of
distance for the reference HEV Prius and the PHEV Hymotion with original and modified control. As
expected, using a PHEV allows a significant reduction in fuel consumption compared to that of the Prius
HEV. Once the PHEV reaches CS mode (i.e., 35 km for the modified control strategy with minimum
engine ON), the slope of the fuel consumed becomes identical to that of the reference HEV vehicle.
As shown in previous studies [10], the optimum control for PHEVs depends highly on the distance
traveled. When someone is driving a short distance, he or she would like to use the battery as much as
possible to minimize the amount of fuel consumed. When driving a long distance, one should instead
retain some battery energy to allow more flexibility in the control strategy. Around 48 km, the modified
control strategy options cross each other, which indicates that, for a short distance, the engine should not
be used to recharge the battery, while for longer distances, the engine should be operated at higher power.Figure 15: Fuel Consumed for Each Control Option as a Function of Distance (UDDS) 6. Conclusion On the basis of vehicle test data collected in Argonne’s four-wheel-drive dynamometer, the model of the 5-kWh Hymotion Prius was validated in PSAT. The engine ON logic and its operating points were correlated with test data. On the basis of the analysis of the control strategy, several changes were proposed to minimize the number of engine ON/OFF events and maximize the engine’s efficiency throughout the drive cycle. Each control option demonstrated its benefits for specific applications. The study demonstrated that it is preferable to operate the engine at low power during short trips and higher power during longer trips to maximize the efficiency of the entire system. 7. Acknowledgments This work was supported by DOE’s FreedomCAR and Vehicle Technology Office under the direction of Lee Slezak. The submitted manuscript has been created by UChicago Argonne, LLC, Operator of Argonne National Laboratory (“Argonne”). Argonne, a U.S. Department of Energy Office of Science laboratory, is operated under Contract No. DE-AC02-06CH11357. The U.S. Government retains for itself, and others acting on its behalf, a paid-up nonexclusive, irrevocable worldwide license in said article to reproduce, prepare derivative works, distribute copies to the public, and perform publicly and display publicly, by or on behalf of the Government.
8.      References
[1] Argonne National Laboratory, PSAT (Powertrain Systems Analysis Toolkit), http://www.
transportation.anl.gov/.

[2] Rousseau, A., Sharer, P., and Besnier, F., “Feasibility of Reusable Vehicle Modeling: Application to
Hybrid Vehicles,” SAE paper 2004-01-1618, SAE World Congress, Detroit, March 2004.
[3] The Mathworks, Inc., Matlab Release 14, User’s Guide, 2005.
[4] http://www.eere.energy.gov/vehiclesandfuels/.
[5] Carlson, R., et al., “Testing and Analysis of Three Plug-in Hybrid Electric Vehicles,” SAE paper
2007-01-0283, SAE World Congress, Detroit, April 2007.
[6] Bohn, T., and Duoba, M., “Implementation of a Non-intrusive In-vehicle Engine Torque Sensor for
Benchmarking the Toyota Prius,” SAE paper 2005-01-1046, SAE World Congress, Detroit, April 2005.
[7] Rousseau, A., Sharer, P., Pagerit, S., and Duoba, M., “Integrating Data, Performing Quality
Assurance, and Validating the Vehicle Model for the 2004 Prius Using PSAT,” SAE paper 2006-01-0667,
SAE World Congress, Detroit, April 2006
[8] Rousseau, A., Shidore, N., Carlson, R., and Freyermuth, V., “Research on PHEV Battery
Requirements and Evaluation of Early Prototypes,” AABC 2007, Long Beach, May 16-18, 2007.
[9] Karbowski, D., Rousseau, A, Pagerit, S., and Sharer, P, “Plug-in Vehicle Control Strategy: From
Global Optimization to Real Time Application,” 22nd International Electric Vehicle Symposium
(EVS22), Yokohama, October 2006.

9.      Authors
                Qiandong Cao, Research Aide, Argonne National Laboratory, 9700 South Cass Avenue, Argonne,
                IL 60439-4815, USA, qcao@anl.gov
                Qiandong Cao received a Master of Science in Executive Engineering from the Ecole des Mines
                de Paris, France, in 2007. Focused on energy, his thesis is based on the control strategy for plug-in
                hybrid vehicles.
                Sylvain Pagerit, Research Engineer, Argonne National Laboratory, 9700 South Cass Avenue,
                Argonne, IL 60439-4815, USA, spagerit@anl.gov
                Sylvain Pagerit received a Master of Science in Industrial Engineering from the Ecole des Mines
                de Nantes, France, in 2000 as well as a Master of Science in Electrical Engineering from the
                Georgia Institute of Technology, Atlanta, in 2001.
                Richard “Barney” Carlson, Research Engineer, Argonne National Laboratory, 9700 South Cass
                Avenue, Argonne, IL 60439-4815, USA, rwcarlson@anl.gov
                Richard “Barney” Carlson received a Master of Science in Mechanical Engineering from
                University of California Davis in 2000.

                Aymeric Rousseau, Research Engineer, Argonne National Laboratory, 9700 South Cass Avenue,
                Argonne, IL 60439-4815, USA, arousseau@anl.gov
                Aymeric Rousseau is head of the Advanced Powertrain Vehicles Modeling Department at
                Argonne National Laboratory. He received his engineering degree at the Industrial System
                Engineering School in La Rochelle, France, in 1997.
You can also read