2017 Profile of Older Americans - April 2018 The Administration for Community Living, which includes the Administration on Aging, is an ...
←
→
Page content transcription
If your browser does not render page correctly, please read the page content below

2017 Profile
          of Older Americans

                                      April 2018

The Administration for Community Living, which includes the Administration on Aging, is an
        operating division of the U.S. Department of Health and Human Services.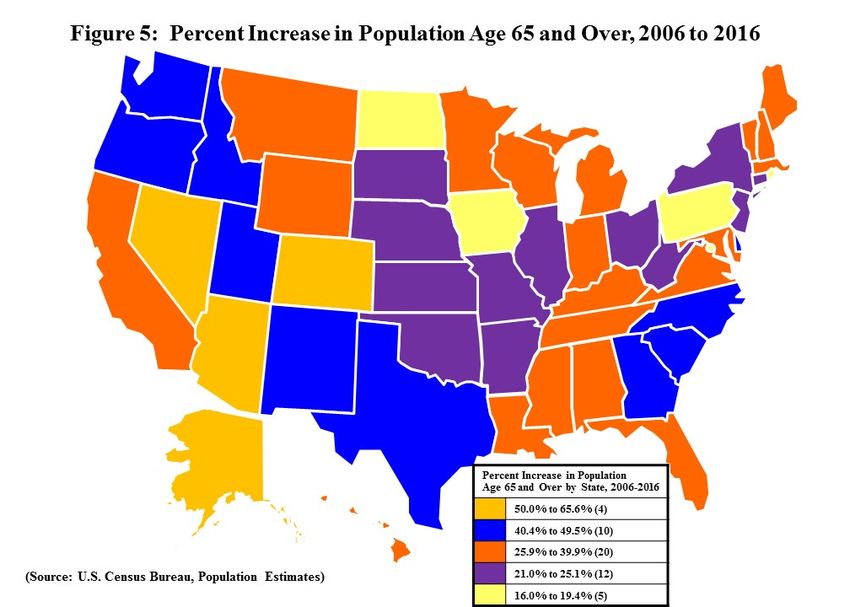
Table of Contents
HIGHLIGHTS ................................................................................................................................................ 1
THE OLDER POPULATION ........................................................................................................................ 2
FUTURE GROWTH ....................................................................................................................................... 3
    FIGURE 1: NUMBER OF PERSONS AGE 65 AND OVER: 1900-2060 (NUMBERS IN MILLIONS)........................................... 3
MARITAL STATUS ........................................................................................................................................ 4
    FIGURE 2: MARITAL STATUS OF PERSONS AGE 65 AND OVER, 2017 .............................................................................. 4
LIVING ARRANGEMENTS.......................................................................................................................... 5
    FIGURE 3: LIVING ARRANGEMENTS OF PERSONS AGE 65 AND OVER, 2017 ................................................................... 5
RACIAL AND ETHNIC COMPOSITION ................................................................................................... 6
GEOGRAPHIC DISTRIBUTION ................................................................................................................. 6
    FIGURE 4: PERSONS AGE 65 AND OVER AS A PERCENTAGE OF TOTAL POPULATION, 2016 ............................................ 7
    FIGURE 5: PERCENT INCREASE IN POPULATION AGE 65 AND OVER, 2006 TO 2016........................................................ 7
    FIGURE 6: THE AGE 65 AND OVER POPULATION BY STATE, 2016 .................................................................................. 8
INCOME........................................................................................................................................................... 9
    FIGURE 7: PERCENT DISTRIBUTION BY INCOME: 2016 .................................................................................................... 9
POVERTY ...................................................................................................................................................... 10
HOUSING....................................................................................................................................................... 10
EMPLOYMENT ............................................................................................................................................ 11
EDUCATION ................................................................................................................................................. 11
HEALTH AND HEALTH CARE ................................................................................................................ 12
HEALTH INSURANCE COVERAGE ........................................................................................................ 13
    FIGURE 8: PERCENTAGE OF PERSONS AGE 65 AND OVER BY TYPE OF HEALTH INSURANCE COVERAGE, 2016 ............ 13
DISABILITY AND PHYSICAL FUNCTIONING ..................................................................................... 14
    FIGURE 9: PERCENTAGE OF PERSONS AGE 65 AND OVER WITH A DISABILITY, 2016 ..................................................... 14
CAREGIVING ............................................................................................................................................... 15
NOTES ............................................................................................................................................................ 16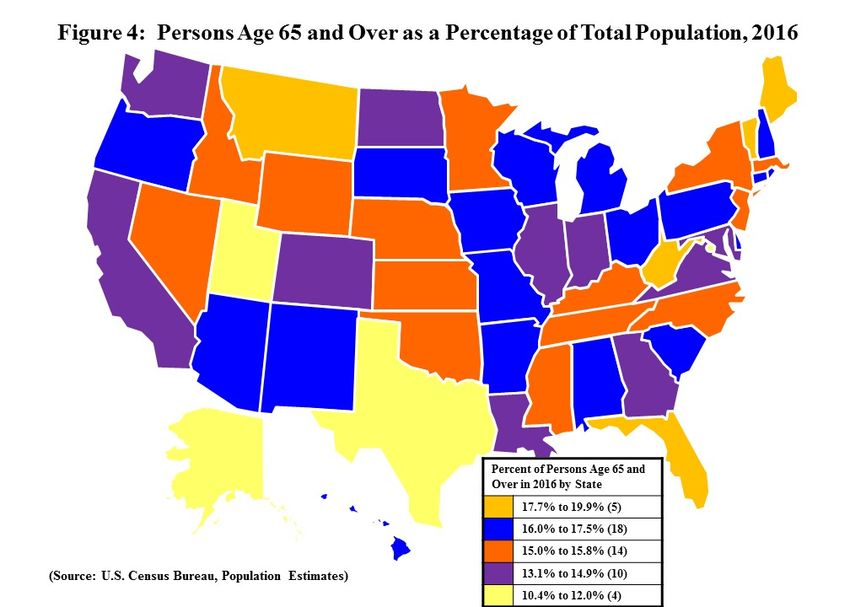
Highlights 1 2 3

    •    Over the past 10 years, the population age 65 and over increased from 37.2 million in 2006 to 49.2
         million in 2016 (a 33% increase) and is projected to almost double to 98 million in 2060.
    •    Between 2006 and 2016 the population age 60 and over increased 36% from 50.7 million to 68.7 million.
    •    The 85 and over population is projected to more than double from 6.4 million in 2016 to 14.6 million in
         2040 (a 129% increase).
    •    Racial and ethnic minority populations have increased from 6.9 million in 2006 (19% of the older adult
         population) to 11.1 million in 2016 (23% of older adults) and are projected to increase to 21.1 million in
         2030 (28% of older adults).
    •    The number of Americans aged 45-64 – who will reach age 65 over the next two decades – increased by
         12% between 2006 and 2016.
    •    About one in every seven, or 15.2%, of the population is an older American.
    •    Persons reaching age 65 have an average life expectancy of an additional 19.4 years (20.6 years for
         females and 18 years for males).
    •    There were 81,896 persons age 100 and over in 2016 (0.2% of the total age 65 and over population).
    •    Older women outnumber older men at 27.5 million older women to 21.8 million older men.
    •    In 2016, 23% of persons age 65 and over were members of racial or ethnic minority populations--9%
         were African-Americans (not Hispanic), 4% were Asian or Pacific Islander (not Hispanic), 0.5% were
         Native American (not Hispanic), 0.1% were Native Hawaiian/Pacific Islander, (not Hispanic), and 0.7%
         of persons 65+ identified themselves as being of two or more races. Persons of Hispanic origin (who may
         be of any race) represented 8% of the older population.
    •    A larger percentage of older men are married as compared with older women---70% of men, 46% of
         women. In 2017, 33% older women were widows.
    •    About 28% (13.8 million) of noninstitutionalized older persons lived alone (9.3 million women,
         4.5 million men).
    •    Almost half of older women (45%) age 75 and over lived alone.
    •    The median income of older persons in 2016 was $31,618 for males and $18,380 for females. The real
         median income (after adjusting for inflation) of all households headed by older people increased by 2.1%
         (which was not statistically significant) between 2015 and 2016. Households containing families headed
         by persons age 65 and over reported a median income in 2016 of $58,559.
    •    The major sources of income as reported by older persons in 2015 were Social Security (reported by 84%
         of older persons), income from assets (reported by 63%), earnings (reported by 29%), private pensions
         (reported by 37%), and government employee pensions (reported by 16%).
    •    Social Security constituted 90% or more of the income received by 34% of beneficiaries in 2015 (23% of
         married couples and 43% of non-married beneficiaries).
    •    Over 4.6 million older adults (9.3%) were below the poverty level in 2016. This poverty rate is not
         statistically different from the poverty rate in 2015 (8.8%). In 2011, the U.S. Census Bureau released a
         new Supplemental Poverty Measure (SPM) which takes into account regional variations in living costs,
         non-cash benefits received, and non-discretionary expenditures but does not replace the official poverty
         measure. In 2016, the SPM showed a poverty level for persons age 65 and over of 14.5% (more than 5
         percentage points higher than the official rate of 9.3%). This increase is mainly due to including medical
         out-of-pocket expenses in the poverty calculations.
    •    The need for caregiving increases with age. In January-June 2017, the percentage of older adults age 85
         and over needing help with personal care (22%) was more than twice the percentage for adults ages
         75–84 (9%) and more than six times the percentage for adults ages 65–74 (3%).

1
  Principal sources of data for the Profile are the U.S. Census Bureau, the National Center for Health Statistics, and the
Bureau of Labor Statistics. The Profile incorporates the latest data available but not all items are updated on an annual basis.
2
  This report includes data on the 65 and over population unless otherwise noted. The phrases “older adults” or “older
persons” refer to the population age 65 and over.
3
  Numbers in this report may not add up due to rounding.
                                                                1
The Older Population
In the United States, the population age 65 and over numbered 49.2 million in 2016 (the most recent year for
which data are available). They represented 15.2% of the population, about one in every seven Americans. The
number of older Americans increased by 12.1 million or 33% since 2006, compared to an increase of 5% for the
under-65 population.
Between 2006 and 2016, the number of Americans aged 45-64 (who will reach age 65 over the next two decades)
increased by 12% and the number of Americans age 60 and over increased by 36% from 50.7
million to 68.7 million.
In 2016, among the population age 65 and over there were 27.5 million women and 21.8 million men, or a sex
ratio of 126 women for every 100 men. At age 85 and over, this ratio increased to 187 women for every 100 men.
Since 1900, the percentage of Americans age 65 and over has more than tripled (from 4.1% in 1900 to 15.2% in
2016), and the number has increased over fifteen times (from 3.1 million to 49.2 million). The older population
itself is increasingly older. In 2016, the 65-74 age group (28.6 million) was more than 13 times larger than in
1900 (2,186,767); the 75-84 group (14.2 million) was more than 18 times larger (771,369), and the 85+ group
(6.4 million) was 52 times larger (122,362).
In 2016, persons reaching age 65 had an average life expectancy of an additional 19.4 years (20.6 years for
females and 18 years for males). A child born in 2016 could expect to live 78.6 years, more than 30 years longer
than a child born in 1900 (47.3 years). Much of this increase occurred because of reduced death rates for children
and young adults. However, the period of 1990-2007 also has seen reduced death rates for the population aged 65-
84, especially for men – by 41.6% for men aged 65-74 and by 29.5% for men aged 75-84. Life expectancy at age
65 increased by only 2.5 years between 1900 and 1960, but has increased by 4.2 years from 1960 to 2007.
Nonetheless, some research has raised concerns about future increases in life expectancy in the US compared to
other high-income countries, primarily due to past smoking and current obesity levels, especially for women age
50 and over (National Research Council, 2011).
In 2016, 3.5 million persons celebrated their 65th birthday. Census estimates showed an annual net increase
between 2015 and 2016 of 1.5 million in the number of persons age 65 and over.
Between 1980 and 2016, the centenarian population experienced a larger percentage increase than did the total
population. There were 81,896 persons age 100 and over in 2016 (0.2% of the total age 65 and over population).
This is more than double the 1980 figure of 32,194.
-----
Sources: U.S. Census Bureau, Population Division, Annual Estimates of the Resident Population for Selected Age
Groups by Sex for the United States, States, Counties, and Puerto Rico Commonwealth and Municipios: April 1,
2010 to July 1, 2016. Release Date: June 2017; Table 1. Intercensal Estimates of the Resident Population by Sex
and Age for the United States: April 1, 2000 to July 1, 2010. Release Date: September 2011; Annual Estimates of
the Resident Population by Single Year of Age and Sex for the United States, States, Counties, and Puerto Rico
Commonwealth and Municipios: April 1, 2010 to July 1, 2016. Release Date: June 2017; 2010 Census Special
Reports, Centenarians: 2010, C2010SR-03, 2012; Hobbs, Frank and Nicole Stoops, Census 2000 Special Reports,
Series CENSR-4, Demographic Trends in the 20th Century, Table 5. Population by Age and Sex for the United
States: 1900 to 2000, Part A; National Center for Health Statistics, Kochanek KD, Murphy SL, Xu JQ, Arias E.
Mortality in the United States, 2016. NCHS data brief, no 293. Hyattsville, MD: December 2017; and National
Research Council, Crimmins EM, Preston SH, Cohen B, editors. Explaining Divergent Levels of Longevity in
High-Income Countries. Panel on Understanding Divergent Trends in Longevity in High-Income Countries, 2011.
2Future Growth
The older population is expected to continue to grow significantly in the future (Figure 1). This growth slowed
somewhat during the 1990's because of the relatively small number of babies born during the Great Depression of
the 1930's. But the older population is beginning to burgeon as approximately one-third of the "baby boom"
generation is now age 65 and over.
The population age 65 and over has increased from 37.2 million in 2006 to 49.2 million in 2016 (a 33% increase)
and is projected to almost double to 98 million in 2060. By 2040, there will be about 82.3 million older persons,
over twice their number in 2000. People age 65 and over represented 15.2% of the population in the year 2016 but
are expected to grow to be 21.7% of the population by 2040. The 85 and over population is projected to more than
double from 6.4 million in 2016 to 14.6 million in 2040 (a 129% increase).
Racial and ethnic minority populations have increased from 6.9 million in 2006 (19% of the older adult
population) to 11.1 million in 2016 (23% of older adults) and are projected to increase to 21.1 million in 2030
(28% of older adults). Between 2016 and 2030, the white (not Hispanic) population age 65 and over is projected
to increase by 39% compared to 89% for older racial and ethnic minority populations, including Hispanics
(112%), African-Americans (not Hispanic) (73%), American Indian and Native Alaskans (not Hispanic) (72%),
and Asians (not Hispanic) (81%).
Figure 1: Number of Persons Age 65 and Over: 1900-2060 (numbers in millions)
Figure 1: Number of Persons Age 65 and Over,
1900 to 2060 (numbers in millions)
120
98.2
100
82.3
80
56.4
60 49.2
40 35
25.5
16.2
20 9
3.1 4.9
0
1900 1920 1940 1960 1980 2000 2016 2020 2040 2060
Year (as of July 1)
Note: Increments in years are uneven. Lighter bars indicate projections.
Source: U.S. Census Bureau, Population Estimates and Projections.
-----
Sources: U.S. Census Bureau, Population Division, Annual Estimates of the Resident Population for Selected Age
Groups by Sex for the United States, States, Counties, and Puerto Rico Commonwealth and Municipios: April 1,
2010 to July 1, 2016, Release Date: June 2017; Intercensal Estimates of the Resident Population by Sex and Age
for the United States: April 1, 2000 to July 1, 2010. Release Date: September 2011; Intercensal Estimates of the
White Alone Not Hispanic Resident Population by Sex and Age for the United States: April 1, 2000 to July 1,
2010. Release Date: September 2011; 2014 National Population Projections: Summary Tables, Table 3.
Projections of the Population by Sex and Selected Age Groups for the United States: 2015 to 2060, released
December 10, 2014; and NP2014_D1: Projected Population by Single Year of Age, Sex, Race, and Hispanic
Origin for the United States: 2014 to 2060. Release date: December 2014.
3Marital Status
In 2017, a larger percentage of older men were married as compared with older women--70% of men, 46% of
women (Figure 2). Widows accounted for 33% of all older women in 2017. There were more than three times as
many widows (8.9 million) as widowers (2.5 million).
Divorced and separated (including married/spouse absent) older persons represented only 15% of all older
persons in 2017. However, this percentage has increased since 1980, when approximately 5.3% of the older
population were divorced or separated/spouse absent.
Figure 2: Marital Status of Persons Age 65 and over, 2017
Figure 2: Marital Status of Persons Age 65 and Over, 2017
100%
90%
80% Women Men
70%
70%
60%
50% 46%
40%
33%
30%
20% 16% 14%
11%
10% 6% 5%
0%
Married Widowed Divorced or Single (never
Separated/ Spouse married)
Absent
Source: U.S. Census Bureau, Current Population Survey, Annual Social and Economic Supplement.
-----
Source: U.S. Census Bureau, Current Population Survey, Annual Social and Economic Supplement.
4Living Arrangements
Over half (59%) of older noninstitutionalized persons age 65 and over lived with their spouse (including partner)
in 2017. Approximately 16 million or 72% of older men, and 12.9 million or 48% of older women, lived with
their spouse (Figure 3). The proportion living with their spouse decreased with age, especially for women. Only
34% of women 75 and over years old lived with a spouse.
About 28% (13.8 million) of all noninstitutionalized older persons in 2017 lived alone (9.3 million women, 4.5
million men). They represented 34% of older women and 20% of older men. The proportion living alone
increases with advanced age. Among women age 75 and over, for example, almost half (45%) lived alone.
A relatively small number (1.5 million) and percentage (3.1%) of the 65 and over population lived in institutional
settings in 2016. Among those who did, 1.2 million lived in nursing homes. However, the percentage increases
dramatically with age, ranging from 1% for persons ages 65-74 to 3% for persons ages 75-84 and 9% for persons
age 85 and over.
Figure 3: Living Arrangements of Persons Age 65 and Over, 2017
Men
8%
Living with spouse or partner
20%
Living alone
Other
72%
Women
18%
Living with spouse or partner
48% Living alone
Other
34%
Source: U.S. Census Bureau, Current Population Survey, Annual Social and Economic Supplement.
-----
Sources: U.S. Census Bureau, American Community Survey; Current Population Survey, Annual Social
and Economic Supplement 1967 to present; Table AD3. Living arrangements of adults 65 to 74 years
old, 1967 to present; Table AD3. Living arrangements of adults 75 and over, 1967 to present.
5Racial and Ethnic Composition
In 2016, 23% of persons age 65 and over were members of racial or ethnic minority populations—9% were
African-Americans (not Hispanic), 4% were Asian or Pacific Islander (not Hispanic), 0.5% were Native
American (not Hispanic), 0.1% were Native Hawaiian/Pacific Islander, (not Hispanic), and 0.7% of persons age
65+ identified themselves as being of two or more races. Persons of Hispanic origin (who may be of any race)
represented 8% of the older population.
Only 9% of all the people who were members of racial and ethnic minority populations were age 65 and over in
2016 compared to 19% of non-Hispanic whites. The percentage of people age 65 and over within each racial and
ethnic minority group were as follows: 11% of African-Americans (not Hispanic), 12% of Asians (not Hispanic),
9% of Native Hawaiian and Other Pacific Islanders (not Hispanic), 11% of American Indian and Native Alaskans
(not Hispanic), and 7% of Hispanics.
-----
Source: U.S. Census Bureau, Population Division, Annual Estimates of the Resident Population by Sex, Age,
Race, and Hispanic Origin for the United States and States: April 1, 2010 to July 1, 2016. Release Date: June
2017.
Geographic Distribution
The proportion of older persons in the population varied considerably by state with some states experiencing
much greater growth in their older populations (Figures 4 and 5). In 2016, more than half (54%) of persons age 65
and over lived in 10 states: California (5.3 million); Florida (4.1 million); Texas (3.4 million); New York (3.0
million); Pennsylvania (2.2 million); Ohio (1.9 million); Illinois (1.9 million); Michigan (1.6 million); North
Carolina (1.6 million); and New Jersey (1.4 million). Georgia, Virginia, Arizona, Washington, Massachusetts, and
Tennessee each had over 1 million people age 65 and over in 2016
(Figure 6).
The five states with the highest percentage of persons age 65 and over in 2016 were Florida (19.9%), Maine
(19.4%), West Virginia (18.8%), Vermont (18.1%), and Montana (17.7%).
In four states, the age 65 and over population increased by 50% or more between 2006 and 2016: Alaska (66%);
Nevada (57%); Colorado (55%); and Arizona (50%).
The 14 states with poverty rates at or over 10% for older adults during 2016 were: District of Columbia (13.4%);
Louisiana (13%); Mississippi (12.3%); New Mexico (11.5%); New York (11.4%); Kentucky (11.1%); South
Dakota (10.9%); Arkansas (10.5%); Texas (10.5%); Florida (10.4%); California (10.3%); Georgia (10.1%);
Alabama (10.0%); and Idaho (10.0%).
A smaller percentage of older adults changed residence as compared with younger age groups. From 2016 to
2017, only 4% of older persons moved as opposed to 12% of the under age 65 population. Most older movers
(57%) stayed in the same county and 21% remained in the same state (different county). Only 22% moved out-of-
state or abroad.
-----
Sources: Administration for Community Living agid.acl.gov. Data Source: Population Estimates 2006, accessed
January 30, 2018. U.S. Census Bureau, American Community Survey; Current Population Survey, Annual Social
and Economic Supplement; Table 1. General Mobility, by Race and Hispanic Origin, Region, Sex, Age,
Relationship to Householder, Educational Attainment, Marital Status, Nativity, Tenure, and Poverty Status: 2016
to 2017; Annual Estimates of the Resident Population for Selected Age Groups by Sex for the United States,
States, Counties, and Puerto Rico Commonwealth and Municipios: April 1, 2010 to July 1, 2016. Release date
June 2017.
6Figure 4: Persons Age 65 and Over as a Percentage of Total Population, 2016
Figure 5: Percent Increase in Population Age 65 and Over, 2006 to 2016
7Figure 6: The Age 65 and Over Population by State, 2016
Number of Persons Percent of All Percent Increase from Percent Below
State
65 and Over (1) Ages 2006 to 2016 Poverty 2016 (2)
US Total (50 States+ DC) 49,244,195 15.20% 32.5 9.30%
Alabama 784,551 16.10% 28.0 10.00%
Alaska 77,206 10.40% 65.6 4.20%
Arizona 1,170,924 16.90% 50.0 9.00%
Arkansas 486,734 16.30% 24.0 10.50%
California 5,346,635 13.60% 38.1 10.30%
Colorado 743,524 13.40% 55.0 7.60%
Connecticut 577,403 16.10% 21.2 6.50%
Delaware 166,950 17.50% 44.2 6.90%
District of Columbia 78,691 11.60% 19.4 13.40%
Florida 4,094,917 19.90% 36.3 10.40%
Georgia 1,354,662 13.10% 49.4 10.10%
Hawaii 243,962 17.10% 37.3 8.90%
Idaho 254,989 15.10% 48.7 10.00%
Illinois 1,871,264 14.60% 22.8 9.20%
Indiana 991,563 14.90% 25.9 7.70%
Iowa 514,215 16.40% 17.1 6.90%
Kansas 436,993 15.00% 21.7 8.00%
Kentucky 690,717 15.60% 28.3 11.10%
Louisiana 674,443 14.40% 30.9 13.00%
Maine 257,683 19.40% 32.4 9.10%
Maryland 876,210 14.60% 35.6 8.20%
Massachusetts 1,073,964 15.80% 26.3 8.50%
Michigan 1,611,755 16.20% 27.0 8.10%
Minnesota 832,228 15.10% 31.8 7.20%
Mississippi 450,941 15.10% 26.0 12.30%
Missouri 978,021 16.10% 24.8 8.20%
Montana 185,040 17.70% 39.5 8.90%
Nebraska 286,744 15.00% 21.6 7.80%
Nevada 441,142 15.00% 57.3 8.70%
New Hampshire 226,804 17.00% 39.9 4.60%
New Jersey 1,372,612 15.30% 22.1 8.30%
New Mexico 342,426 16.50% 40.4 11.50%
New York 3,032,509 15.40% 21.8 11.40%
North Carolina 1,569,465 15.50% 43.1 9.40%
North Dakota 109,999 14.50% 16.0 7.90%
Ohio 1,886,629 16.20% 22.4 8.10%
Oklahoma 590,138 15.00% 24.2 8.60%
Oregon 688,878 16.80% 42.8 7.50%
Pennsylvania 2,223,721 17.40% 17.5 7.80%
Rhode Island 173,964 16.50% 17.4 9.10%
South Carolina 830,232 16.70% 49.5 8.60%
South Dakota 138,805 16.00% 25.1 10.90%
Tennessee 1,047,052 15.70% 35.3 8.90%
Texas 3,353,240 12.00% 44.0 10.50%
Utah 321,164 10.50% 44.8 6.70%
Vermont 112,932 18.10% 35.2 8.70%
Virginia 1,228,744 14.60% 39.7 7.80%
Washington 1,081,063 14.80% 47.2 7.60%
West Virginia 343,517 18.80% 21.0 9.50%
Wisconsin 928,418 16.10% 26.7 7.60%
Wyoming 87,812 15.00% 38.0 8.50%
Puerto Rico 645,887 18.90% 26.3 38.10%
Notes: (1) Population Estimates (2) Poverty data for the US total are from the Current Population Survey, Poverty
data for States and Puerto Rico are from the American Community Survey.
Data Sources: U.S. Census Bureau, Current Population Survey, Annual Social and Economic Supplement;
Population Estimates; and American Community Survey.
8Income
The median income of older persons in 2016 was $31,618 for males and $18,380 for females. From 2015 to
2016, the real median income (after adjusting for inflation) of all households headed by older people increased by
2.1% which was not statistically significant. Households containing families headed by persons age 65 and over
reported a median income in 2016 of $58,559 ($61,458 for non-Hispanic Whites, $44,986 for Hispanics, $43,554
for African-Americans, and $66,116 for Asians). About 5% of family households with an older adult householder
had incomes less than $15,000 and 73% had incomes of $35,000 or more (Figure 7).
Figure 7: Percent Distribution by Income: 2016
Family Households with Householder Age 65 and Over, 2016
0% 20% 40% 60% 80% 100%
Under $10,000 3%
$10,000 - $14,999 2%
$15,000 - $24,999 9%
$25,000 - $34,999 12%
$35,000 - $49,999 15%
$50,000 - $74,999 20%
$75,000 and over 38%
$58,559 median for 17.1 million family households with householder age 65 and over
Persons Age 65 and Over Reporting Income, 2016
0% 20% 40% 60% 80% 100%
Under $5,000 4%
$5,000 - $9,999 10%
$10,000 - $14,999 16%
$15,000 - $24,999 23%
$25,000 - $34,999 13%
$35,000 - $49,999 12%
$50,000 and over 22%
$23,394 median for 47.5 million persons age 65 and over reporting income
Note: Percentages may not add to 100 due to rounding.
Source: U.S. Census Bureau, Current Population Survey, Annual Social and Economic Supplement.
9For all older persons reporting income in 2016 (47.5 million), 14% reported less than $10,000 and 47% reported
$25,000 or more. The median income reported was $23,394.
The major sources of income as reported by older persons in 2015 were Social Security (reported by 84% of older
persons), income from assets (reported by 63%), earnings (reported by 29%), private pensions (reported by 37%),
and government employee pensions (reported by 16%). In 2015, Social Security benefits accounted for 33% of
the aggregate income 4 of the older population. The bulk of the remainder consisted of earnings (34%), asset
income (9%), pensions (20%) and other (4%). Social Security constituted 90% or more of the income received by
34% of beneficiaries (23% of married couples and 43% of non-married beneficiaries).
-----
Sources: U.S. Census Bureau, Current Population Survey, Annual Social and Economic Supplement, FINC-01.
Selected Characteristics of Families by Total Money Income in 2016; PINC-01. Selected Characteristics of
People 15 Years Old and Over by Total Money Income in 2016, Work Experience in 2016, Race, Hispanic
Origin, and Sex; and U.S. Census Bureau, Income and Poverty in the United States: 2016, Current Population
Reports, P60-259, issued September 2017. Social Security Administration, “Fast Facts and Figures About Social
Security, 2017.”
Poverty
Over 4.6 million people age 65 and over (9.3%) were below the poverty level in 2016. 5 This poverty rate is not
statistically different from the poverty rate in 2015 (8.8%). Another 2.4 million or 4.9% of older adults were
classified as "near-poor" (income between the poverty level and 125% of this level).
In 2016, 2.7 million older Whites (alone, not Hispanic) (7.1%) were poor in 2016, compared to 18.7% of older
African-Americans (alone), 11.8% of older Asians (alone), and 17.4% of older Hispanics (any race).
Older women had a higher poverty rate (10.6%) than older men (7.6%) in 2016. A higher percentage of older
persons living alone were poor (17.3%) as compared with older persons living with families (5.3%). The highest
poverty rates were experienced among older Hispanic women who lived alone (39.5%).
In 2011, the U.S. Census Bureau released a new Supplemental Poverty Measure (SPM). The SPM methodology
shows a significantly higher number of older persons below poverty than is shown by the official poverty
measure. For persons age 65 and over, this poverty measure showed a poverty level of 14.5% in 2016 (more than
5 percentage points higher than the official rate of 9.3%). Unlike the official poverty rate, the SPM takes into
account regional variations in the cost of housing etc. and, even more significantly, the impact of both non-cash
benefits received (e.g., SNAP/food stamps, low income tax credits, and WIC) and non-discretionary expenditures
including medical out-of-pocket (MOOP) expenses. For persons 65 and over, MOOP was the major source of the
significant differences between these measures. The SPM does not replace the official poverty measure.
-----
Sources: U.S. Census Bureau, Current Population Survey, Annual Social and Economic Supplement; POV01:
Age and Sex of All People, Family Members and Unrelated Individuals Iterated by Income-to-Poverty Ratio and
Race: 2016; "Income and Poverty in the United States: 2016," P60-259, issued September, 2017; Poverty
Thresholds for 2016 by Size of Family and Number of Related Children Under 18 Years; and “The Supplemental
Poverty Measure: 2016,” P60-261(RV), revised September 2017.
Housing
Of the 11.9 million households headed by persons age 75 and over in 2015, 76% were owners and 24% were
renters. The median family income of older homeowners was $31,000. The median family income of older renters
4
Aggregate income refers to the total income of couples and nonmarried persons aged 65 or older.
5
The poverty threshold in 2016 was $11,511 for householders age 65 and over living alone.
10was $17,400. In 2015, almost 44% of older householders spent more than one-third of their income on housing
costs - 36% for owners and 78% for renters.
For older homeowners age 75 and over in 2015, the median construction year was 1969 compared to 1978 for all
homeowners. Among the homes owned by people age 75 and over, 3.5% had moderate to severe problems with
plumbing, heating, electric, wiring, and/or upkeep. In 2015, the median value of homes owned by older persons
was $150,000 (with a median purchase price of $53,000). In comparison, the median home value all homeowners
was $180,000 (with a median purchase price of $127,000). About 78% of older homeowners in 2015 owned their
homes free and clear.
-----
Source: Department of Housing and Urban Development, American Housing Survey, National Tables: 2015.
Employment
In 2017, 9.6 million (19.3%) Americans age 65 and over were in the labor force (working or actively seeking
work), including 5.3 million men (23.9%) and 4.3 million women (15.7%). They constituted 6% of the U.S. labor
force. About 3.6% were unemployed. Labor force participation of men age 65 and over decreased steadily from
63.1% in 1900 to 15.8% in 1985; then stayed at 16%-18% until 2002; and has been increasing since then to over
20%. The participation rate for women age 65 and over rose slightly from 8.3% in 1900 to 10.9% in 1956, fell to
7.3% in 1985, and then stayed at 8%-9% during the 1990s. Beginning in 2000, labor force participation of older
women started to gradually rise from 9.7% to the 2017 level of 15.7%. This increase is especially noticeable
among the population ages 65-69.
----
Source: Bureau of Labor Statistics, Current Population Survey, Labor Force Statistics, Household Data, Annual
Averages, Table 3. Employment status of the civilian noninstitutional population by age, sex, and race.
Education
The educational level of the older population is increasing. Between 1970 and 2017, the percentage of older
persons who had completed high school rose from 28% to 86%. About 30% in 2017 had a bachelor's degree or
higher. The percentage who had completed high school varied considerably by race and ethnic origin in 2017:
91% of Whites (not Hispanic), 79% of Asians (not Hispanic), 75% of African-Americans (not Hispanic), 79% of
American Indian/Alaska Natives (not Hispanic), and 58% of Hispanics. The increase in educational levels is also
evident within these groups. In 1970, only 30% of older Whites and 9% of older African-Americans were high
school graduates.
-----
Source: U.S. Census Bureau, Current Population Survey, Annual Social and Economic Supplement.
11Health and Health Care
In June-July 2017, 45% of noninstitutionalized people age 65 and over assessed their health as excellent or very
good (compared to 64% for persons ages 18-64 years). Most older persons have at least one chronic condition and
many have multiple conditions. In 2015, among persons age 65 and over, the top five chronic conditions were
hypertension (58%), hyperlipidemia (48%), arthritis (31%), ischemic heart disease (29%), and diabetes (27%).
In January-June 2017, 71% of people age 65 and over reported that they received an influenza vaccination during
the past 12 months and 69% reported that they had ever received a pneumococcal vaccination. About 31% (of
persons age 60 and over) reported height/weight combinations that placed them among the obese. Slightly under
half (44%) of persons ages 65-74 and 29% of persons age 75 and over reported that they engaged in regular
leisure-time physical activity. Only 9% of persons age 65 and over reported that they were current smokers and
8% reported excessive alcohol consumption. Less than 3% of persons age 65 and over reported that they had
experienced serious psychological distress during the past 30 days.
In 2015, 7.1 million people age 65 and over stayed in a hospital overnight at least one night during the year.
Among this group of older adults, 10% stayed overnight 1 time, 3% stayed overnight 2 times, and 2% stayed
overnight 3 or more times. This is approximately double the number of overnight hospital stays for the population
ages 45 to 64; 6% had stayed overnight 1 time, 1% stayed overnight 2 times, and 1% stayed overnight 3 or more
times. Older persons averaged more office visits with doctors than younger persons in 2016. Among people age
75 and over, 19% had 10 or more visits to a doctor or other health care professional in the past 12 months
compared to 17% among people ages 65 to 74,15% among people ages 45 to 64, and 11% among people ages 18
to 44.
In January-June 2017, 97% of persons age 65 and over reported that they did have a usual place to go for medical
care and only 3% said that they failed to obtain needed medical care during the previous 12 months due to cost.
In 2016, consumers age 65 and over averaged out-of-pocket health care expenditures of $5.994, an increase of
38% since 2006 ($4,331). In contrast, the total population spent considerably less, averaging $4,612 in out-of-
pocket costs. Older Americans spent 13.1% of their total expenditures on health, as compared to 8% among all
consumers. Health costs incurred on average by older consumers in 2016 consisted of $4,159 (69%) for insurance,
$913 (15%) for medical services, $715 (12%) for drugs, and $207 (3%) for medical supplies.
-----
Sources: National Center for Health Statistics, National Health Interview Survey, Early Release of Selected
Estimates Based on Data from the January-June 2017; Tables of Summary Health Statistics for U.S. Adults: 2015
and 2016; Centers for Medicare and Medicaid Services, Medicare claims data. Bureau of Labor Statistics,
Consumer Expenditure Survey, Table 1300. Age of Reference Person: Annual Expenditures Means, Shares,
Standard Errors, and Coefficient of Variation, 2016. Table 3. Age of reference person: Average annual
expenditures and characteristics, Consumer Expenditure Survey, 2006.
12Health Insurance Coverage
In 2016, almost all (93%) non-institutionalized persons age 65 and over were covered by Medicare. Medicare
covers mostly acute care services and requires beneficiaries to pay part of the cost, leaving about half of health
spending to be covered by other sources. About half of older adults (53%) had some type of private health
insurance, 8% had military-based health insurance,7% were covered by Medicaid, and 1% had no coverage
(Figure 8).
Figure 8: Percentage of Persons Age 65 and Over by type of Health Insurance Coverage, 2016
Figure 8: Percentage of Persons age 65 and Over by Type of
Health Insurance Coverage, 2016
100% 99%
94% 93%
90%
80%
70%
60% 53%
50%
40%
28% 28%
30%
20%
10% 7% 8%
1%
0%
Note: A person can be represented in more than one category.
Source: U.S. Census Bureau, Current Population Survey, Annual Social and Economic Supplement.
-----
Sources: U.S. Census Bureau, Current Population Survey, Annual Social and Economic Supplement; Table HI01.
Health Insurance Coverage Status and Type of Coverage by Selected Characteristics: 2016.
13Disability and Physical Functioning
According to the U.S. Census Bureau’s American Community Survey, some type of disability (i.e., difficulty in
hearing, vision, cognition, ambulation, self-care, or independent living) was reported by 35% of people age 65
and over in 2016. The percentages for individual disabilities ranged from almost one quarter (23%) having an
ambulatory disability to 7% having a vision difficulty (Figure 9).
Figure 9: Percentage of persons age 65 and over with a disability, 2016
Figure 9: Percentage of Persons age 65 and Over
with a Disability, 2016
Independent living difficulty 15%
Self-care difficulty 8%
Ambulatory difficulty 23%
Cognitive difficulty 9%
Vision difficulty 7%
Hearing difficulty 15%
Any disability 35%
0% 20% 40% 60% 80% 100%
Source: U.S. Census Bureau, American Community Survey.
In 2016, 44.3% of people age 75 and over reported having a difficulties in physical functioning. This percentage
is more than twice as large as for the age group 45 to 64 (19.7%). The percentage of people age 75 and over
reporting difficulties in physical functioning ranged from 4.9% reporting it was very difficult to (or cannot) sit for
2 hours to 29.2% reporting it was very difficult to (or cannot) stand for 2 hours.
-----
Sources: U.S. Census Bureau, American Community Survey. National Center for Health Statistics, National
Health Interview Survey.
14Caregiving
The need for caregiving increases with age. In January-June 2017, the percentage of older adults age 85 and over
needing help with personal care (22%) was more than twice the percentage for adults ages 75–84 (9%) and more
than six times the percentage for adults ages 65–74 (3%).
Older adults not only need care, but often also provide care to younger family members. For example,
approximately 1 million grandparents age 60 and over were responsible for the basic needs of one or more
grandchildren under age 18 living with them in 2016. Of these caregivers, 58% were grandmothers and 42% were
grandfathers.
In addition, in 2015, among the 3.6 million people with Intellectual and Developmental Disabilities (I/DD) 6 living
with a family caregiver, 24% had caregivers who were age 60 and over (872,042). The percentage of people with
I/DD living with older caregivers ranged from 11% in Alaska to 25% in Florida.
-----
Sources: National Center for Health Statistics, National Health Interview Survey, Early Release of Selected
Estimates Based on Data from the January-June 2017. U.S. Census Bureau, American Community Survey.
Braddock, D., Hemp, R., Tanis, E.S. Wu, J. & Haffer, L. (2017). State of the States in Developmental Disabilities.
American Association on Intellectual and Developmental Disabilities.
6
The total number of people with Intellectual and Developmental Disabilities (I/DD) is estimated to be 5 million.
15Notes
Principal sources of data for the Profile are the U.S. Census Bureau, the National Center for Health Statistics, and
the Bureau of Labor Statistics. The Profile incorporates the latest data available but not all items are updated on
an annual basis.
Numbers in this report may not add up due to rounding.
Age-adjusted estimates are used when available.
The data presented in this report refer to the noninstitutionalized population except where noted.
A Profile of Older Americans: 2017 was developed by the Administration on Aging (AoA), Administration for
Community Living, U.S. Department of Health and Human Services.
AoA serves as an advocate for older adults within the federal government and is working to encourage and
coordinate a responsive system of family and community based services throughout the nation. AoA helps states
develop comprehensive service systems which are administered by 56 State Units on Aging, 629 Area Agencies
on Aging, 263 Tribal organizations, and 1 Native Hawaiian organization.
16You can also read