Optimization of Rice, Mung Beans and Vegetable Planting Patterns at Paloh Border Area in Sambas Regency, West Kalimantan
←
→
Page content transcription
If your browser does not render page correctly, please read the page content below
E3S Web of Conferences 232, 01030 (2021) https://doi.org/10.1051/e3sconf/202123201030
IConARD 2020

 Optimization of Rice, Mung Beans and Vegetable
 Planting Patterns at Paloh Border Area in
 Sambas Regency, West Kalimantan
 Rusli Burhansyah1,*, Juliana Carolina Kilmanun1 and Melia Puspitasari1
 1 West Kalimantan Assessment Institute for Agricultural Technology

 Abstract. The aim of this study was to analyze the pattern of planting rice,
 mung beans and vegetables and maximizing the income of farmers in the
 border area of Paloh, Sambas Regency. The study used a survey method.
 The unit of analysis in this study is rice farming. The sample of farmers was
 determined by purposive sampling on the consideration of the variety of
 harvested area and the types of vegetable farming that varied. The number
 of farmer respondents as many as 30 cases was determined by purposive
 sampling. To analyze the data, the income analysis and Linear Programming
 are used. The results showed that: farming area of 0.6 ha (arable area) can
 be optimized with a combination of local rice farming in the wet season of
 0.6 ha. In the superior rice dry season, about 0.3 ha, mung beans 0.1 ha,
 mustard 0.05 ha, chilli 0.05 ha and cucumber 0.1 ha. (4) Optimal solutions
 can maximize farmers' income by IDR 34,818,000. To optimize rice
 farmyng system, green beans and vegetables with an average arable land of
 0.6 ha, the recommended farming pattern is in the local rice dry season 0.6
 ha, superior rice dry season 0.3 ha, mung beans 0.1 ha, mustard 0.05 ha, chili
 0.05 ha and cucumber 0.1 ha.

 1 Introduction
 Scarcity of water resources occurs in this part of the world due to industrial needs, food
 consumption in urban areas, recreation and the agricultural sector. Factors increasing human
 population, higher living standards and changes in land use and global climate change also
 influence [11]. Future agricultural development is needed, among others; efficient utilization
 of scarce resources due to demand for agricultural products. Agricultural stakeholders can
 increase income by optimizing the use of resources to meet community demand [7]. [13]
 explain the strategy to increase production and sustainability in the agricultural ssector in the
 future is very important. Aptive landscape farming, taking into account specific soil-climatic,
 organizational, economic, environmental and other factors. The concept of “maximum
 possible grain yield” will always change upward with increasing intensification of
 agriculture, maintaining soil fertility, creating and introducing highly productive varieties,
 using a mineral nutrition system, as well as means of protection against pests and diseases,
 etc.

 * Corresponding author: burhansyahrusli@yahoo.com

© The Authors, published by EDP Sciences. This is an open access article distributed under the terms of the Creative Commons
Attribution License 4.0 (http://creativecommons.org/licenses/by/4.0/).
E3S Web of Conferences 232, 01030 (2021) https://doi.org/10.1051/e3sconf/202123201030
IConARD 2020

 Efforts to improve resource efficiency are pursued through cropping patterns. Research
 on cropping patterns is widely carried out by many researchers. [11] examined cropping
 patterns using irrigation water. The results increased from 5,904 ha to 8,051 ha (80%) and
 there was a 48% irrigation efficiency. [4] say that the problem in farming in the future
 cropping patterns is soil acidity and soil fertility. This research was conducted in the
 Himalayan Piedmont region of Bangladesh. The aim of this study was to evaluate the effects
 of lime and fertilizer on the rice-potato-mung bean cropping pattern. The study was
 conducted on farmer's land for two years. There were 2 treatments, namely first dose of lime
 (1 ton/ha and 2 ton/ha) and two, administration of manure fertilizer (poultry, fertilizer and
 control) with three replications. Application of lime and fertilizer had an impact markedly on
 potato production and fertilizer residues have an effect on mung beans and rice. An increase
 in profits of about 45-59% from rice plants and 41-43%, from mung beans. The provision of
 lime 1 ton/ha plus 3 ton/ ha poultry fertilizer and 5 ton / ha manure is the best treatment
 resulting in high production. Such treatment can increase soil pH and nutrient absorption by
 plants. [3] to optimization model for determining optimal land allocation for secondary plants
 in smallholding oil palm plantations in Langkat Regency to increase farmers’ income levels
 and reduce poverty. The objective function of the model is to maximize profit for farmers.
 Land allocation is limited by available budgets and planting areas. In addition, the allocation
 is also limited by the number of plants that can be planted in each unit area because each
 plant requires different care procedures and has a different planting period. Each plant’s yield
 is adjusted within a 6-month timeframe. [1] researched applied linear programming methodes
 the production planning system and scheduling shallots planting patterns using fuzzy time
 series and linear programming methods. [16] applied time series method use to predict
 demand on based on sales amount, while linear programming is used to assist horticulture
 farmers in making production planning decisions and determining the schedule of cropping
 patterns in accordance with demand predictions of the fuzzy time series method.
 Paloh Subdistrict is a region of Sambas Regency which borders directly neighboring with
 Malaysia. The potential of rice food crop farming is around 8,002 ha. Besides rice, green
 bean plants are cultivated by farmers because of the high prices. The harvest area of mung
 beans is around 1,376 ha, with a production of 1,043 tons and a productivity of 0.758 t / ha.
 Vegetable mustard greens, long beans, large chillies, eggplant and cucumbers [5]. The
 cropping patterns applied by farmers in Paloh sub-district include; in the local wet season,
 superior dry season, green beans, chili and cucumber.
 The problem at the farm level is that there is no planning for planting patterns that
 maximizes profits. For this reason research in cropping patterns is needed that maximizes
 farmers' income. The purpose of this study was to determine the planting patterns of rice,
 green beans and vegetables in the border region of Sambas Regency.

 2 Research Method

 2.1 Location and Time of Research
 This research uses survey method. The method is a systematic method for gathering
 information from a population sample with the aim of describing a quantitative description
 of a larger population [15]. The study was conducted in 3 villages in Paloh sub-district with
 the consideration that three villages already had broader rice and vegetable planting patterns
 than the other villages. These villages include: Tanah Hitan Village, Matang Danau Village
 and Kalimantan. Research time was in October to December 2018.

 2
E3S Web of Conferences 232, 01030 (2021) https://doi.org/10.1051/e3sconf/202123201030
IConARD 2020

 2.2 Data Processing and Sampling Methods
 The study was directed at farmers who planted rice, green beans and vegetables based on
 information from Field Agricultural Extension Paloh District. Furthermore, to get farmers
 who became respondents conducted random sampling. The number of respondents were 30
 people.

 2.3 Data Processing and Analysis Techniques
 The collected data is then presented in tabular form. To calculate the income of farmers from
 farming rice, green beans and vegetables, the writers use the analysis of gross income,
 analysis of net income with the following formulation [12].
 = − (1)

 = − − (2)
 Where:
 GM = Gross margin/ha
 GFI = Gross farm income/ha
 TVC = Total variable cost/ha
 TFC = Total fixed cost/ha
 NFI = Net farm income/ha

 The QM for window v5 Programming linear program was used to solve the problem of
 optimizing rice, mung beans and vegetables farming [8] with the following models:
 Purpose Function:
 Functions that maximize income from various activities (types of rice, mung beans, and
 vegetables farming) mathematically as follows [9].
 Maximize

 = 1 1 + 2 2 + ⋯ (3)
 Where:
 Cj = parameters used as optimization criteria or the j th decision-making coefficient
 change in the objective function (objective function coefficient), namely the net
 income of each farming activity.
 Xj = Changes in decision making or activities (to be sought), namely types of rice
 farming, green beans, vegetables
 Z = value of decision-making criteria; an objective function; or optimized value
 Constraint function:
 The constraint function is the availability of agricultural resources owned by farmers.
 Mathematically formulated as follows:
 a11X1+a12X2+a13X3+ …………+a1jXj ≤ b1
 a21X1+a22X2+a23X3+ …………+a2jXj ≤ b2
 a31X1+a32X2+a33X3+ …………+a3jXj ≤ b3
 . . . . .
 . . . . .
 . . . . .
 ai1X1+a12X2+ai3X3+ ……………. +aijXj ≤ bi
 and non-negative conditions
 Xj ≥0, for j=1,2,……, n

 3
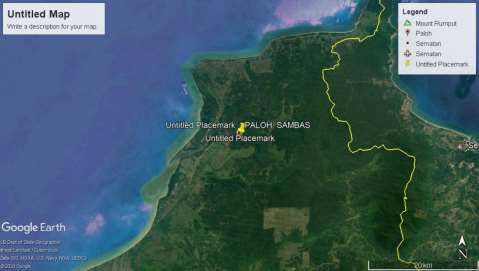
E3S Web of Conferences 232, 01030 (2021) https://doi.org/10.1051/e3sconf/202123201030
IConARD 2020

 Where:
 aij = the coefficient of technological change in decision-making j in the first obstacle, namely
 the use of agricultural resources per ha
 bi = limited i resource which discusses activities
 Xi= changes in decision making or activities (to be sought), namely types of rice farming,
 mung beans, vegetables.
 I = the number of agricultural resources that is a constraint
 J = Change number of decisions - making (activity)
 Next, the linear programming planning model was solved using the simplex method with the
 linear programming matrix model. In addition to the optimal solution, sensitivity or post
 optimal analysis was also performed

 3 Result and Discussion

 3.1 Geographical Location, Climate and Planting Pattern
 Geographically Paloh sub-district is located between 1035 '35 '' until 2005 '43' 'North Latitude
 and 109038 '56 "to 1090 28 '27" East Longitude. Paloh Subdistrict is located in the north of
 Sambas Regency which borders directly with Sarawak Country in eastern Malaysia. This
 sub-district is a coastal area which has the longest coastline in Sambas district. Paloh
 Subdistrict has an area of 1,148.84 km2 (114,884 ha) or 17.96 percent of the area of Sambas
 district [5].

 Fig. 1. Paloh sub-district map
 Based on data on average rainfall in 2011-2017 in the District of Paloh, the average per
 month is around 223 mm. The rainy season starts from September / October to February. The
 dry season starts from March / April to August (Figure 2).

 4
E3S Web of Conferences 232, 01030 (2021) https://doi.org/10.1051/e3sconf/202123201030
IConARD 2020

 500
 Rain fall (mm/month)
 400
 300
 200
 100
 0

 Month

 Fig.2. Average rainfall in 2011-2017 in Paloh District
 Based on the results of the FGD at the farmer level, the cropping patterns in the rainy and
 dry seasons are obtained as follows (Figure 3)
 Jan Peb Mar Apri May June July Aug Sept Octo Nov Dec

 Local Rice

 Mung bean
 Superior
 Rice

 Collards

 Chili

 Cucumber

 Fig.3. Planting Patterns in Paloh District
 The dominant types of food and vegetable commodities cultivated by farmers in the Paloh
 border region are local rice, New Superior Variety rice (Inpari 43), mung beans, collards,
 chili and cucumber. Generally the cropping patterns applied by farmers are monoculture. In
 the wet season the land is planted with local rice, dry season rice is planted with superior rice,
 mung beans, collards, chili and cucumber.

 3.2 The Costs and Benefits of Farming
 The results of the analysis of farmer income per hectare based on the type of farming carried
 out by farmers are presented in Table 1 below. From the results of the income analysis (Table
 1), it is known that the biggest income from six farming activities with an average of 0.6 ha
 is chilli farming, which is IDR 29,288,000 / grp. Of all the farming activities, collards farming
 provides the smallest income, which is IDR 885,000. The highest B / C ratio was 3.51 for
 chili farming, the lowest B / C ratio was 1.94 for local rice farming.
 Farm size, production cost and revenue and cost ratio (B/ C ratio) are important aspects
 in farm planning. Issues of farming area and production costs will be important in
 determining the types of plants that will be cultivated if farmers are faced with limited
 resources, both land area, capital for production facilities and paying labor costs. The
 implication, although a farm can provide the highest income, is not necessarily the best option

 5
E3S Web of Conferences 232, 01030 (2021) https://doi.org/10.1051/e3sconf/202123201030
IConARD 2020

 to implement because the size and type of farming are related to production costs. How to
 determine the type of farming activity by considering the limitations of agricultural resources
 owned so that optimal farming (can maximize income). The results of the analysis applying
 linear programming presented below can solve this problem.
 Table 1. Costs and Income per Cultivation of Various Food Crops and Vegetable Farming in Paloh,
 2018

 Type of Farming *)
 No Description
 Mung Collards Chili Cucumber
 Local Rice VUB Rice Bean
 Production
 1
 Facilities
 Seeds / Seeds cost
 (IDR) 200,000 300,000 450,000 570,000 512,000 2,100,000
 Fertilizer cost (IDR)
 450,000 1,300,000 525,000 200,000 2,650,000 2,300,000
 Pesticides cost
 (IDR) 350,000 750,000 200,000 250,000 1,500,000 300,000
 2 Labor cost (IDR)
 3,710,000 5,475,000 1,950,000 4,250,000 5,000,000 3,750,000
 3 Fixed cost (IDR)
 1,200,000 1,200,000 700,000 1,000,000 2,000,000 800,000
 4 Total Costs
 5,910,000 9,025,000 3,825,000 6,270,000 11,662,000 9,250,000
 5 Production (IDR)
 2,200 3,700 650 1,000 2,730 3,845
 6 Revenue (IDR)
 11,440,000 18,500,000 9,100,000 7,155,000 40,950,000 26,915,000
 7 Benefit (IDR)
 5,530,000 9,475,000 5,275,000 885,000 29,288,000 17,665,000
 8 B/C ratio 1.94 2.05 2.38 1.14 3.51 2.91
 *) Average arable area of 0.6 ha

 3.3 Farm Optimization
 The results of the optimization analysis include solving primal and dual problems and
 sensitivity analysis. This analysis considers 6 farming activities with 14 types of agricultural
 resources with an average area of arable land based on respondents is 0.6 ha.

 3.3.1 Primal Settlement

 The results of the analysis with linear programming obtained optimal solutions or
 maximizing farmers' income in the average area of 0.6 ha. The area and type of plant
 (combination) arrangement of farms cultivated in this area can be shown from the results of
 primal settlement (Table 2).
 There are 2 activities that enter the base with a value of Z max = 34,818,000. This means
 that the combination of the two farms on an area of arable land of an average of 0.6 ha can
 maximize farmers' income in the Paloh border region, which is as much as IDR 34,818,000.
 It can be assumed that the selected farming activities in the optimal solution include local
 rice farming and chilli farming included in the base. From an average of 0.6 ha of arable land
 will provide maximum total income with an allocation of that value. The arrangements are:
 for local rice farming of 0.6 ha and chilli farming 0.05 ha. Both activities are carried out with
 a monoculture pattern in different seasons. The combination of farming activities with the
 arrangement of farming area will maximize the farmer's total income, in the amount of IDR
 34,818,000.

 6
E3S Web of Conferences 232, 01030 (2021) https://doi.org/10.1051/e3sconf/202123201030
IConARD 2020

 Table 2. Results of Linear Programming Analysis on Primal settlement
 Farming Reduced Cost
 Variable Status Value (ha)
 Activities (IDR)
 X1 Local rice Basis 0,6 0
 X2 Superior rice Non Basis 0 19.813.000
 X3 Mung bean Non Basis 0 24.013.000
 X4 Collards Non Basis 0 28.403.000
 X5 Chili Basis 0,05 0
 X6 Cucumber Non Basis 0 11.623.000
 Final Optimal Solution
 Z max=34.818.000
 The reduced cost value for activities that are included in the basis is 0, meaning that the scale
 of entrepreneurship for those activities has provided maximum income and is not profitable
 if the scale of exploitation is done. Based on the results of primal settlement analysis, the
 magnitude of the scale of the activity suggested is indicated by the magnitude of the values
 as previously described. Farming activities that are not included on a non-basis basis have a
 reduced cost value. This shows that if the resources are allocated for these activities, each
 allocation unit will actually reduce the total income in the optimal solution by the value of
 reduced cost. Therefore, the two farming activities, namely local rice and chili are not
 included in the optimal solution (value equal to zero).
 The results of the study by [14] showed that the optimal planting pattern would produce
 a maximum income of IDR 76,568,940.00 per period of rice planting season is rice and
 mustard greens for the first planting season and lettuce for the second planting season. Based
 on primal analysis, with limited capital available, the area of land that can be planted each
 season is 0.30 Ha for rice plants in the first planting season, 0.26 Ha for mustard plants in the
 first planting season, and 0.26 Ha for the second planting season.

 3.3.2 Dual Settlement
 In addition to the primal settlement which points to the optimal solution of the objective
 function, important information obtained from the results of the optimization analysis is an
 evaluation of the use of agricultural resources shown in the dual settlement (Table 3). In
 Table 3 below there are 13 agricultural resources available, there are 2 agricultural resources
 with binding status, while other non-binding resources. Agricultural resources that have
 binding status indicate that these resources are limited and used up in an optimal solution
 (slack value = zero) or there are no leftovers (Table 3).
 This depleted agricultural resource covers the area of the wet season and the area of the
 dry season by having a dual value (dual value / shadow price) as in Table 3. In theory the
 production is referred to as the marginal product value. A dual value states that each
 additional use of resources by one activity unit will add to the optimal value of the dual value.
 A dual value of the width of the wet season claim of 55.30 means that each addition of arable
 area (other resources remains) will increase the optimal revenue solution of IDR 5,530,000.
 While the dual value of the width of the dry season arable is 29.28 meaning that each
 additional arable area (other resources remains) will increase the optimal income solution of
 IDR 29,288,000. Other resources that have non-binding status means that the resource still
 has slack or is overused or not used because it is not included in the optimal solution, so the
 dual value is zero. This means that increasing the use of these resources does not increase
 revenue for optimal solutions.

 7
E3S Web of Conferences 232, 01030 (2021) https://doi.org/10.1051/e3sconf/202123201030
IConARD 2020

 Table 3. Results of Linear Programming Analysis in Dual Resolution
 Constraints Dual Value/
 Slack/
 Resources Unit Symbol Status Shadow
 Surplus
 Price
 Arable area Rain Season ha C1 Binding 0 5,530,000
 Arable area Dry season ha C2 Binding 0 29,288,000
 Local Rice Seed kg C3 Non Binding 199,960 0
 Superior rice seed kg C4 Non Binding 300,000 0
 Mung bean seed kg C5 Non Binding 450,000 0
 Collard seed gr C6 Non Binding 570,000 0
 Chili seed gr C7 Non Binding 511,984 0
 Cucumber seed gr C8 Non Binding 2,100,000 0
 Urea fertilizer kg C9 Non Binding 1,349,800 0
 NPK fertilizer kg C10 Non Binding 3,374,400 0
 KCl fertilizer kg C11 Non Binding 2,699,900 0
 Labor in the family HOK C12 Non Binding 24,134,930 0
 Labor outside the family HOK C13 Non Binding 24,134,900 0

 3.4 Sensitivity Analysis

 Sensitivity analysis is used to identify critical variables that are uncertain and adopted in the
 uncertainty analysis of the Monte Carlo Simulation that was developed. The method for
 sensitivity analysis cannot be expected to be exactly the same for all models [6]. Sensitivity
 analysis in the Linear Program is used to estimate the amount that is difficult to estimate after
 optimal [10]. Furthermore, [2] stated that there are three approaches in sensitivity analysis
 namely first using a base, second approach using an optimal partition and third using an
 optimal value. The purpose of the sensitivity analysis is to reduce the calculation and avoid
 re-calculation, if there are changes in one or several coefficients when the optimal completion
 has been achieved.
 On completing objective row ranges (Table 4), it can be seen that from activities that are
 included in the basis of being sensitive to changes in income, chili farming (X5) has an
 optimal minimum program limit is more sensitive to income decline than other activities
 because it has a sensitivity range of at least 40%, then X1 (local rice farming) is less sensitive
 to decreasing income because it has a wider allowable decrease of 100%.
 Table 4. Value of the range of sensitivity of the objective function coefficients in the
 objective row ranges objective Coefficient Ranges
 Farming Varia Lower Current Upper Allowable Allowwabl
 Activities ble Limit Value Limit Increase e Decrease
 Local rice X1 0 5.530.000 No Limit No Limit 0
 Inpari 43 X2 No Limit 9.475.000 29.288.000 38.763.000 No Limit
 Mung bean X3 No Limit 5.275.000 29.288.000 34.563.000 No Limit
 Collards X4 No Limit 885.000 29.288.000 30.173.000 No Limit
 Chili X5 17.655.000 29.288.000 No Limit No Limit 11.633.000
 Cucumber X6 No Limit 17.665.000 29.288.000 No Limit No Limit

 The next sensitivity analysis is the situation where if there is a change in the supply of
 land resources used. The range of sensitivity of agricultural resources included in the status
 bindings appears in the completion of the right-hand side ranges (Table 5), which explains

 8
E3S Web of Conferences 232, 01030 (2021) https://doi.org/10.1051/e3sconf/202123201030
IConARD 2020

 the sensitivity of the optimal program value to changes in the availability of resources or the
 right value. From the results of sensitivity analysis in completing the right hands side ranges,
 there are 2 which have binding status, namely the width of the rainy season and the width of
 the dry season. Both of these resources are used up in optimal solutions. The area covered by
 the Rainy Season is around 5,000 ha and the dry season is 6,749 ha.
 Table 5. Value of the Range of Agricultural Resource Sensitivity in Right Hand Side
 Ranges

 Curre
 Constraints Allowab
 Lower nt Upper Allowable
 le
 Resources Unit Symb Limit Value Limit Decrease
 Increase
 ol s
 Arable area ha C1 0,6 0,6 5.000 1,2 0
 Rain Season
 Arable area ha C2 0,6 0,6 6.749 1,2 0
 Dry Season
 The implication is that if farmers can increase their use of both land resources, it can
 provide higher income for optimal solutions. This is supported by the results of the analysis
 on the dual solution as previously described (Table 3) where both resources have a shadow
 price or dual value which means that each additional use of resources by one activity unit
 will add to the value of the solution for its dual value.

 4 Conclusion and Suggetsion
 The results showed that: (1) the average area of arable land by farmers in the Paloh Border
 area was 0.6 ha and there were 6 types of commodities dominantly cultivated by farmers
 including local rice, superior rice, mung beans, collards, chili, and cucumber; (2) farmer's
 income from local rice farming Farmer's income from local rice farming is IDR 5,530,000,
 superior rice IDR 4,475,000, mung beans IDR 5,275,000, collards IDR 885,000, chili IDR
 29,288,000 and cucumber IDR 17,665,000, (3) farming of 0.6 ha (arable area) can be
 optimized with a combination of local rice farming in the wet season of 0.6 ha. In the dry
 season, superior rice is around 0.3 ha, mung beans are 0.1 ha, collards 0.05 ha, chili 0.05 ha
 and cucumber 0.1 ha. (4) optimal solution can maximize farmers' income of IDR 34,818,000
 The recommended farming patterns so that the total income of farmers in the Paloh
 Border area for a maximum area of 0.6 ha arable is superior rice about 0.3 ha, mung beans
 0.1 ha, collards 0.05 ha, chili 0.05 ha and cucumbers 0.1 ha. The sensitivity analysis shows
 that the used resources are the Rainy Season and the Dry Season. The optimal solution for
 the rainy season is around 5,000 ha and the dry season is 6,749 ha.

 Refrences
 1. A D.Indriyanti, D. R. Prehanto, G.S. Permadi, C.Mashuri, T.Z. Vitadiar. E3S Web of
 Conferences 125, 23007 ICENIS 2019 (2019)
 2. B. Jansen 2, JJ. De Jong, C. Roos, T. Terlaky. European Journal of Operationsl
 Research.(1997)
 3. B.D.B.S. Sitorus, R.D.Kusumastuti. 1st Asia Pacific Business and Economics
 Conference (APBEC 2018). (2019).
 4. B.S. Sultana, M.H Main, M Jahiruddin, M.Z Rahman, M.N.E.A Siddique and J Sultana..
 L. Asian Journal Agricultural and Horticultural Research. 3,2(2019)
 5. BPS Kabupaten Sambas, Kabupaten Sambas dalam angka 2018. BPS (2018)

 9
E3S Web of Conferences 232, 01030 (2021) https://doi.org/10.1051/e3sconf/202123201030
IConARD 2020

 6. Eriksson,. Thesis, Linkoping University Faculty of art and Sciences. (2007)
 7. H. Mohmmad H and F Bostani. Journal Of Agricultural Economics Researches,
 1,3(2009)
 8. H.A. Taha. Operation Research. An Introduction.(University of Arkansas, Fayetteville.
 © Pearson Education Limited,(2017)
 9. I.D. Anna, S.B.Febrian. 2nd International Conference on Social Science (ICSS 2019)
 (2019)
 10. J.L.Higle, S.W.Wallance. Interface 33,4 (2003)
 11. K.T. Birhani, T Alamirew, MD Olumana, S Ayalew and D Aklog.. Irrigat Drainage Sys
 Eng 4,2 (2015)
 12. N.Mamun, Departemen of Agricultural Economic University of Nigeria, Nsukka. (2013)
 13. O.Makarova, V.Makarov, S.Gasparyan, Z.Napris, A.Shemyakin. E3S Web of
 Conferences 175, 01003 (2020)
 14. R.Khalik, Safrida, A.H.Hamid. J.Agrisep 14,1(2013)
 15. R.M, Groves, F.J.Jr. Fowler, M.P.Couper, J.M.Lepkowski, E.Singer, R.Tourangeau.
 Survey Methodology.(John Wiley and Sons, Inc, 2009).
 16. T.Z. Vitadiari,, F.Farikhin, B.Surarso . E3S Web of Conferences 31, 10004 (2018)

 10
You can also read