PRESENTATION OF UNAUDITED FY2017 RESULTS - Arvida Group Limited Year Ended 31 March 2017
←
→
Page content transcription
If your browser does not render page correctly, please read the page content below
PRESENTATION OF
UNAUDITED FY2017
        RESULTS

           Arvida Group Limited
       Year Ended 31 March 2017

                      24 May 2017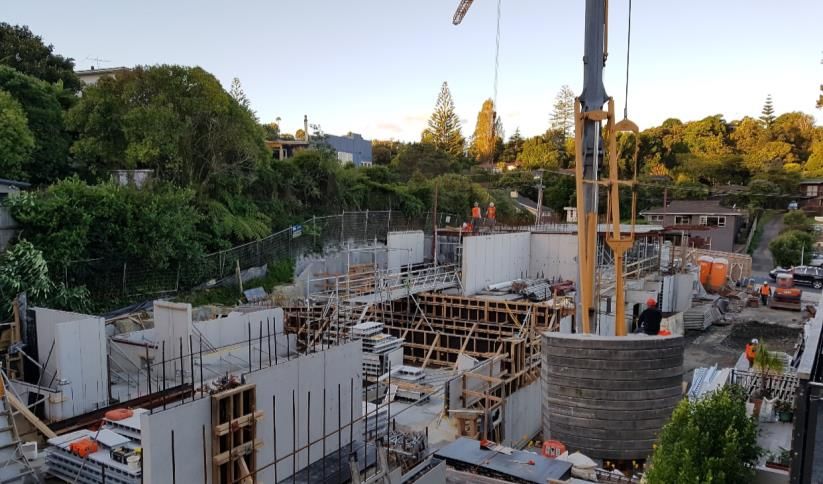
FY2017 HIGHLIGHTS

$160                         m                            47              %                                         95%
Market capitalisation increased                           Strong growth in Underlying Profit1                       Occupancy at our care facilities
60% or $160m following a $42m                             up 47% on FY2016 to $23.1m,                               remains significantly above the
rights issue, $25m issue of vendor                        delivering 27% accretion in                               industry average; outstanding
shares, inclusion in S&P/NZX50                            Underlying Profit per share                               result from first resident and care
Index and significant share price                                                                                   satisfaction survey
appreciation

$795                          m                           262                    units/beds                         1.15           cps
Total assets up $334m to $795m,                           Brownfield development activity in                        Final dividend lifted to 1.15cps;
having acquired 5 high quality                            progress across multiple sites (and                       total net dividends up 5% to
villages that have increased further                      a further 645 units/beds in                               4.45cps for year
$14m in value since acquisition                           planning stage)

Unless otherwise indicated, all numerical data is unaudited and stated as at 31 March 2017.
1. Underlying Profit is a non-GAAP (unaudited) measure and differs from NZ IFRS net profit after tax by replacing the unrealised
fair value adjustment in property values with the Board’s estimate of realised components of movements in investment property                           2
value and to eliminate deferred tax and one-off items.
FY2017 FINANCIAL PERFORMANCE
FY2016 vs. FY2017
54 FY2016 FY2017
40
24 23 24
21
17 16
$ million
1
Operating NPAT (IFRS) Underlying Profit Operating Cash
Earnings Flow
Strong FY2017 result recorded that was well above FY2016 on all measures
Includes part year contributions from Lansdowne Park, Copper Crest, Lauriston Park,
Views Lifecare, Cascades that were acquired during the year
Significant contribution from sales activity experienced across Villages
Cash tax paid of $5.8 million in FY2017
1. Underlying Profit is a non-GAAP (unaudited) measure and differs from NZ IFRS net profit after tax by replacing the unrealised
fair value adjustment in property values with the Board’s estimate of realised components of movements in investment property 3
value and to eliminate deferred tax and one-off items.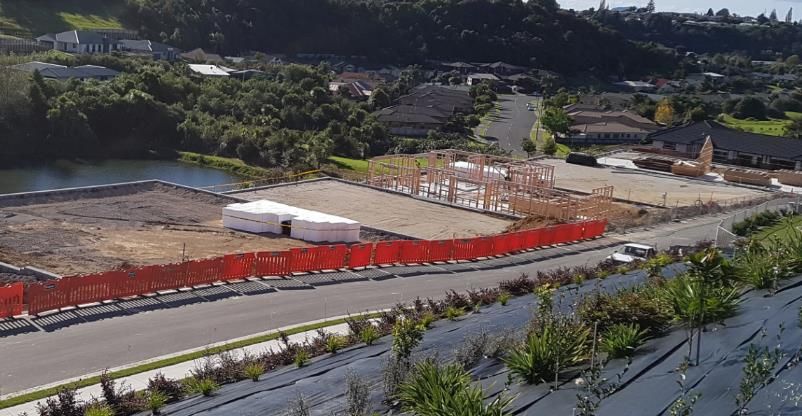
FINANCIAL
OVERVIEW

            4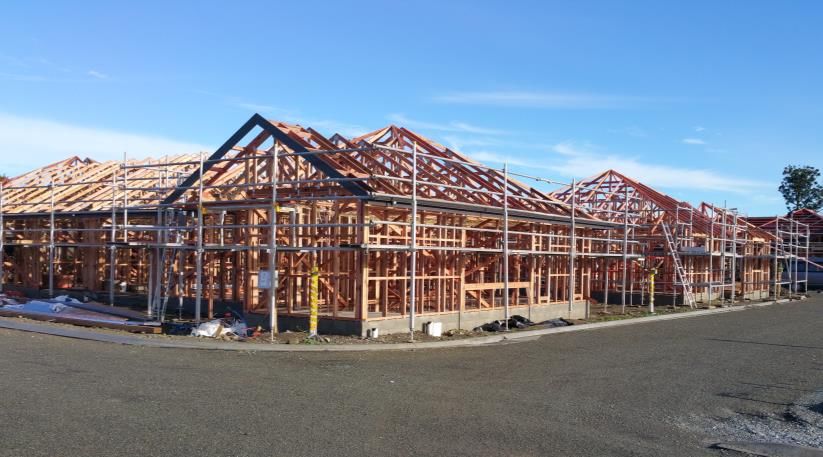
INCOME STATEMENT
Year ended 31 March
FY2016 FY2017
$71.5m generated from care fees
Unaudited (NZ$m)
provides strong operating cash
Care & village service fees 72.4 85.7 flows for the group
Deferred management fees 7.8 12.3 Revenue and operating cost
Other revenue 2.3 3.4 increases mainly related to new
Total revenue 82.5 101.4
villages acquired
Gain on acquisition of subsidiaries 0.0 3.2
Fair value movement of investment
Change in fair value of investment properties at $39.3m from CBRE
19.1 39.3
property revaluation of the retirement village
Change in fair value of PPE (3.1) 0.8 land and buildings
Total income 98.5 144.7 One off costs relate to transaction
Operating expenses (65.1) (80.9) associated expenditure
Depreciation (2.9) (3.4)
Total expenses (68.0) (84.3) Revenue and Key Expense Composition
Operating profit before financing, one-off 3% 3%
30.5 60.4 100%
costs 9% 12% 24% 24%
80% 13% 14%
Financing costs (0.9) (1.3) 9% 9%
60%
One-off costs (1.4) (1.0)
40% 75% 71% 67% 67%
Profit before income tax 28.2 58.1 20%
Income taxation (4.2) (4.4) 0%
FY2016 FY2017 FY2016 FY2017
Net profit after tax 24.0 53.7 Care fees Village fees DMF Other revenue Employee costs Property costs Other expenses
5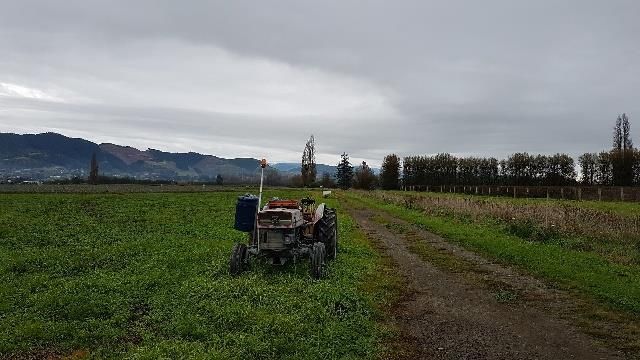
EARNINGS BRIDGE
Movements in Underlying Profit
4.0 23.1
1.2
2.1
15.8
$ million
FY16 Underlying
months in FY17
for FY17 Acquired
Original portfolio
FY17 Underlying
Underlying Profit
Gains on Sales -
Aria - Extra 3
Properties
Profit
Profit
Underlying Profit benefited from:
Higher level of gains on sales being generated
Inclusion of the Aria villages for a full 12 months; and
Acquisition of 5 villages, contributing $4.0m in period
6
EMBEDDED VALUE
Embedded value measures future cash Embedded Value (per unit)
that can be generated when a unit is 120
resold 63
Embedded value per unit increased 74% 100
to $117,000:
80
Indicator of future realised gains
and cash flow generation 60 24
20
Total embedded value is $153 million: 54
Strong growth since IPO which has 40
42 43
been enhanced by acquisition
$ thousands
20
strategy
CBRE average price per unit has 0
increased 32% since FY2016 due to FY2015 FY2016 FY2017
acquisition of higher value units and unit DMF Resales Gains
repricing strategy
Average price per unit is $375k reflecting
the portfolio composition of 45%
Serviced Apartments and 55% Villas
$49m of embedded value acquired
during the year:
This increased by $17m at year end
due to higher unit prices
7
VALUATION RECONCILIATION
Implied Value per share Reconciliation^ (NZ$m)
Movements in Investment Property
Investment Property 570
215 14 Less: ORA / DMF (306)
570
Retirement Villages1 264
Add: Care Facilities2 178
25
19
CBRE Valuation 443
296
Work in Progress 20
Implied Value 463
$ million
Less: Bank Debt 74
Net Implied Value
Investment
Investment
Acquired
Village Revaln
389
Additions
Original Village
Villages
Property
Property
Acquired
FY16
FY17
Revaln
Shares on Issue 334
Implied Value per share $1.16
1. CBRE valuation as at 31 March 2017.
2. CBRE valuation at the later of 31 March 2016 or date of acquisition.
During the year investment property increased 92% or $274m
The portfolio of villages at the start of the year increased $25m in value
$215m of investment property purchased as part of villages acquisitions in FY2017. This
investment property increased $14m in value by year end
^ Implied Value is a non-GAAP (unaudited) measure and differs from NZ IFRS by replacing components of Property, Plant and
Equipment with an independent valuation. 8
BALANCE SHEET
Year ended 31 March
FY2016 FY2017
Term sheet for a new $150m bank
Unaudited (NZ$m)
facility agreed in May 2017
Cash and cash equivalents 1.8 1.3 Core operational debt to remain
Property, plant and equipment 110.0 156.5 unchanged, however debt will increase
Investment property 295.8 569.9 with development build rate
Goodwill 39.0 50.5 Expected $75m development spend
Other assets 14.1 16.7
over next 12 months. Matched total
development funding to development
TOTAL ASSETS 460.7 794.9
programme through to project
External debt 13.3 73.5
completion
Residents’ loans 142.2 290.9
PP&E and investment property balances
Deferred tax liability 16.6 20.2 increased mainly due to acquisitions in
Other liabilities 23.8 38.8 the period, gains on revaluation and
TOTAL LIABILITIES 195.9 423.4 development spend
NET ASSETS 264.8 371.5 Care facility value determined by
director review having reference to the
valuation completed by CBRE in FY2016
Issued capital 246.7 311.7
Reserves 2.3 3.5
Retained earnings 15.8 56.3
TOTAL EQUITY 264.8 371.5
9
CASH FLOW
Year ended 31 March
FY2016 FY2017
$90.3m generated from care fees
Unaudited (NZ$m)
and village services
Receipts from residents for care fees and
village services
70.8 90.3 $62.4m of cash generated from ORA
Residents’ loans 41.3 62.4 transactions offset by repayments of
$26.0m
Repayment of residents’ loans (20.4) (26.0)
Payments to suppliers and employees
Purchase of investment property
(63.7) (76.8)
includes acquisition of neighbouring
Other operating cash flows (0.2) (3.3)
residential property and buyback of
Financing costs (0.9) (1.1) unit titled ORAs
Taxation (2.8) (5.8) Purchase of PPE mainly reflects
Net cash flow from operating activities 24.1 39.7 development spend during the year
Bank overdraft acquired from
subsidiaries
0.1 (0.2) $66.5m paid in cash for acquisitions
Purchase of investment property (11.4) (19.2) Included in financing activities are
Purchase of property, plant and $41.8m of proceeds from new shares
(3.3) (23.3)
equipment issued in relation to the rights issue,
Payments for investments in subsidiaries (29.3) (66.5) net bank debt drawdowns of $42.0m
Net insurance claim proceeds 17.8 0.9 and dividends paid of $13.2m
Capitalised interest paid 0.1 (0.3) Overall cash balance at $1.3m and
Net cash flow from investing activities (26.0) (108.6) drawn debt balance of $73.5m
Net cash flow from financing activities 1.8 68.3
Closing cash balance 1.8 1.3
10RECONCILIATION TO UNDERLYING PROFIT1
Underlying Profit1 up 47% to $23.1m, equating to underlying EPS of 7.7 cents per share
Total of 166 resales and 32 sales of new units completed in period
Mix of units sold in period was 32% Villas and 68% Serviced Apartments
Year ended 31 March
FY2016 FY2017 Sales Analysis FY2016 FY2017
(NZ$m)
Net profit after tax 24.0 53.7 New Sales
Less: Change in fair values New units sold 20 32
(16.0) (40.1)
Value $m 9.3 14.0
Add: Deferred tax (0.1) 0.5
Av. value per new sale $000 465.0 438.7
Less: Gain on acquisition of subsidiaries - (3.2)
Development margin $m 1.5 2.4
Add: One-off costs 1.4 1.0 Margin % 16% 17%
Underlying operating profit 9.3 11.8 Resales
Add: Gains on resale of existing units 5.0 8.9 Villas 35 47
Serviced Apartments 114 119
Add: Gain on sale of new units 1.5 2.4
Total resales 149 166
Underlying profit1 15.8 23.1
Value $m 36.5 45.5
1. Underlying Profit is a non-GAAP (unaudited) measure and differs from NZ IFRS net
profit after tax by replacing the unrealised fair value adjustment in property values Av. value per resale $000 244.9 274.1
with the Board’s estimate of realised components of movements in investment
property value and to eliminate deferred tax and one-off items.
Resale margin 5.0 8.9
Margin % 14% 19%
11BUSINESS OVERVIEW
PORTFOLIO STATISTICS
FY2016 ACQUIRED ADJs FY2017
Rest Home 610 93 +11 714
Dementia 131 20 -1 150
Hospital 505 99 -22 582
Total Aged Care 1,246 212 -12 1,446
Serviced Apartments 529 61 -2 588
Villas 379 329 +5 713
Total Retirement Units 908 390 +3 1,301
Total Units/Beds 2,154 602 2,747
Needs-based Composition 82% 45% 74%
1 2
Development Units/Beds 182/43 711/196
Continued high proportion of total portfolio is needs-based accommodation
5 villas delivered at Copper Crest since acquired
Other adjustments in accommodation mix reflect a combination of swing beds and
decommissioning for development
1. Excludes potential care suite conversions from number of beds.
2. Excludes an additional 100+ units/beds in the development pipeline yet to be assessed. 13VILLAGE STATISTICS
FY2016 FY2017 Average age of all
Number of Villages 21 26 retirement village residents
at 82.9 years
Number of Residents >2,100 >3,000
Resident density at 1.3 per
occupied unit
FY2016 FY2017 Decrease in Villa average
Care Facility Occupancy 94% 95% ages due to acquisition of
3 newer villages with high
Villa composition
Independent Living Units FY2016 FY2017 No change in age profile of
Av. Ingoing Age 77 yrs 76 yrs Serviced Apartment
residents
Av. Current Age 83 yrs 80 yrs
Av. Current Price $216,000 $411,000
Serviced Apartments FY2016 FY2017
Av. Ingoing Age 84 yrs 84 yrs
Av. Current Age 87 yrs 87 yrs
Av. Current Price $188,000 $245,000
14OPERATIONAL PERFORMANCE
Continual improvement in village staff leadership and clinical governance:
Have restructured clinical teams to improve accountability for reporting and
clinical risk management, teamwork and staff satisfaction
Ultimate goal of improved quality of care and meaningful engagement with
residents
Six villages hold 4-year Ministry of Health certifications (av. 3.2 years across all sites):
Improvements against Ministry of Health criteria have resulted in the duration of
certification extending
Strong result from first independent resident and care satisfaction survey conducted
across group:
94% satisfaction for people living independently and 94% satisfaction for residents
living in our care
Resident management system now live and being progressively rolled out across the
group:
Significant change management project that will transform the way care provision
is documented and organised on a day-to-day basis
ACC tertiary accreditation now across the group
Investment in payroll and staff management systems to drive improvements and
support our staff
Considerable work in progress on key initiatives in Wellness and Nutrition to promote
and strengthen our resident-centred approach to care
15DEVELOPMENT PROGRAMME
FY2018
Village Location Status Units / Beds FY17 FY18 FY19
Under
Aria Bay Auckland construction 25 Apts Construction Sell down
Under Construction
Copper Crest Tauranga construction 15 Villas Stage 6 Sell down
Construction
Copper Crest Tauranga Planning 25 Villas^ Stage 7
Under
Lauriston Park Cambridge construction 22 Villas Construction Sell down
Under
Lansdowne Park Masterton construction 5 Villas Construction Sell down
Under
Oakwoods Nelson construction 24 Villas Construction Sell down
Under Construction
Park Lane Christchurch construction 28 Apts Stage 1 Sell down
Construction
Park Lane Christchurch Planning 52 Apts^ Stage 2
Rhodes on Under Construction
Cashmere Christchurch construction 18 Apts Stage 1 Sell down
Rhodes on 12 Apts / Construction
Cashmere Christchurch Planning 36 Beds(ORA)^ Stage 2 & 3
TOTAL 226 / 36
^ Subject to final investment decision approval.
16FUTURE OPPORTUNITY IN RICHMOND
Conditional agreement to acquire 8.2 hectares of bare land in Richmond for $11m:
Acquisition subject to completion of re-zoning and subdivision as it forms part of a
larger residential subdivision to be developed
Site provides the opportunity for a $100 million retirement village and integrated care
development
Richmond is the largest urban settlement in the Tasman District and one of the fastest
growing with a healthy economic outlook
Sound knowledge of local market with Oakwoods, our existing village in Richmond,
being in close proximity
New 8.2ha Site
Oakwoods
17“NEEDS-BASED” DEVELOPMENT PIPELINE
Development pipeline is at an early Planned / Unconsented Developments^
stage of feasibility and subject to final
investment decision approval:
Enhances needs-based offering Cascades Copper Crest
Acquired strategic parcels of adjacent 120 S. Apts 40 Care Beds
land at Aria Bay, Oakwoods, St Albans, 30 S. Apts
Cascades, Lauriston Park and
Lansdowne Park:
Enables improved product from Lauriston
planned developments and 60 Care Beds
50 S. Apts
efficiencies within existing villages
Richmond
Planned / unconsented development 40 Care Beds
includes an additional 485 units and 160 Villas/40 S. Apts
160 beds St Albans
20 Care Beds
Care ORA concept is being planned: 25 S. Apts
Bed developments likely to Wendover
60 S. Apts
comprise a significant component
of Care ORA (Care Suites)
Care ORA likely to be first
introduced at Rhodes on
Cashmere
^ Net of decommissions. Subject to final investment decision approval.
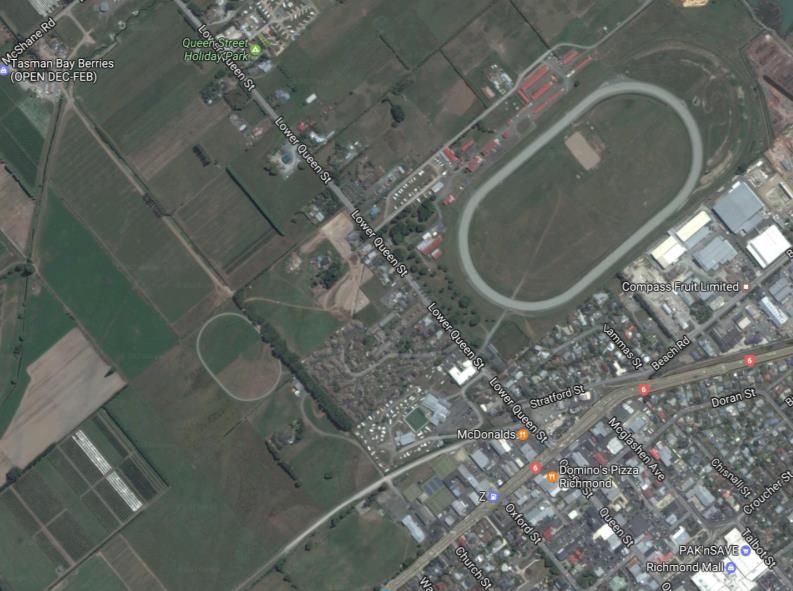
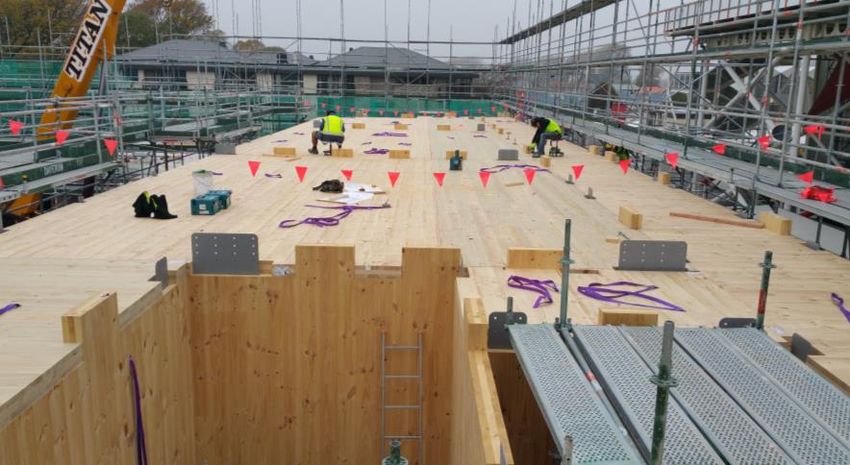
18DEVELOPMENT IN PROGRESS
Aria Bay Apartments, Auckland Park Lane Apartments, Christchurch
Oakwoods Villas, Richmond Copper Crest Villas, Tauranga
19STRATEGY UPDATE
27% accretion in Underlying Profit per Underlying Profit (cents per share)
share since FY2016
Executed on $170m of net assets
acquired and integrated since IPO: 4.2
Acquisitions integrated to plan
and identified synergies reinvested
Sound integration management 3.5
capability and processes in place
Development processes established 3.1
2.9
with sizeable pipeline now identified
cents per share
Continue to see a range of value
accretive opportunities. Apply strict
screening criteria to acquisitions:
Location, quality of assets and 1H 2016 2H 2016 1H 2017 2H 2017
current management, potential for
development and earnings
accretion
20DIVIDEND AND FY2018 OUTLOOK
4Q FY2017 dividend of 1.15 cps Dividend (cents per share)
declared:
5.0
Record date for payment is 8 June
2017, payment on 16 June 2017
4.0
Partially imputed with 0.40 cps of
imputation credits
3.0
Supplementary dividend of 0.18
cps from non-resident
2.0
shareholders
Total FY2017 to 4.45 cps, in line with
cents per share
1.0
guidance
Full year dividend payout ratio at 62% 0.0
consistent with Dividend Policy to pay FY2015^ FY2016 FY2017 FY2018F
out 60-80% of Underlying Profit 1Q 2Q 3Q 4Q
Lift in 4Q dividend sustainable with
momentum in revenue and earnings
continuing Strong fundamentals continue to
underpin sector outlook, however the
Expect earnings impact of recent pay
Group is aware of concern on absolute
settlement to be neutral but positively
levels of house prices, the emerging
impact recruitment and retention of
home care trend and rising
caregivers
construction costs
^ Annualised. Arvida paid a dividend of 1.03 cps in respect of the FY15
21APPENDIX
22A1: PORTFOLIO VALUATION ASSUMPTIONS
Discount Rates FY2016 FY2017
Discount rates decreased at 2 villages by
High 16.0% 16.0% 0.5% where development activity has
Low 12.5% 12.5% advanced
Long Term Property Price Growth FY2016 FY2017
No material changes in long term property
High 3.5% 3.5% price growth rates
Low 2.0% 2.0%
Short Term Property Price Growth FY2016 FY2017
No material changes in short term (Yr 1-3)
High 2.5% 2.5% property price growth rates
Low 0.0% 0.0%
Tenure – Units (yrs) FY2016 FY2017
Increase of high tenure to 9.0 yrs at village
High 8.5 9.0 acquired in FY2017
Low 6.3 6.2
Tenure – Serviced Apt (yrs) FY2016 FY2017
Lengthening of average tenure at one village
High 4.9 4.9 from 3.5 yrs to 4.0 yrs
Low 3.5 4.0
EBITDA per Bed $000 FY2016 FY2017
Valued every 2 years by CBRE. Last valued in
High 18.7 20.8 FY2016. Acquired care facilities valued at
Low 10.4 10.4 time of purchase
23A2: PORTFOLIO SUMMARY
Region Villas Apts SA RH Hospital Dementia Develop Planning^
Aria Bay Retirement Village Auckland 9 24 57 25
Aria Gardens Auckland 42 91 20
Aria Park Retirement Village Auckland 46 40 44
Cascades Retirement Village Hamilton 5 32 44 30 120
Lauriston Park Retirement Village Cambridge 149 22 110
Views Lifecare Tauranga 34 34 20
Copper Crest Retirement Village Tauranga 116 40 70
Glenbrae Village Bay of Plenty 78 27 23 18
Olive Tree Village and Olive Tree Apartments Palmerston North 95 48 27 17
Molly Ryan Retirement Village New Plymouth 35 28 21 12
Waikanae Country Lodge Village Kapiti Coast 4 20 21 38
Lansdowne Park Lifestyle Village Masterton 64 29 30 20 5
Ashwood Park Retirement Village Blenheim 18 35 47 48 26
The Wood Retirement Village Nelson 5 38 30 47
Oakwoods Retirement Village Nelson 92 45 23 25 24
Bainlea House Waimakariri 27
Bainswood on Victoria Waimakariri 25 31
Bainswood Retirement Village Waimakariri 4 14 26
Wendover Retirement Village Christchurch 11 43 60
St Albans Retirement Village Christchurch 4 53 3 18 45
Ilam Lifecare Christchurch 45 22 34 20
Mayfair Retirement Village Christchurch 11 23 29 36
Maples Retirement Village Christchurch 25 52
St Allisa Rest Home Christchurch 55 34 20
Park Lane Retirement Village Christchurch 8 45 20 22 80
Rhodes on Cashmere Christchurch 16 66
TOTAL 683 30 588 714 582 150 262 405
Greenfield Site (8.2 ha) Richmond 240
^ Net of decommissions. Subject to final investment decision approval.
24IMPORTANT NOTICE
Disclaimer
The information in this presentation has been prepared by Arvida Group Limited with due care and attention. However,
neither the Company nor any of its directors, employees, shareholders nor any other person shall have any liability
whatsoever to any person for any loss (including, without limitation, arising from any fault or negligence) arising from this
presentation or any information supplied in connection with it.
This presentation may contain projections or forward-looking statements regarding a variety of items. Such projections or
forward-looking statements are based on current expectations, estimates and assumptions and are subject to a number
of risks, uncertainties and assumptions. There is no assurance that results contemplated in any projections and forward-
looking statements in this presentation will be realised. Actual results may differ materially from those projected in this
presentation. No person is under any obligation to update this presentation at any time after its release to you or to
provide you with further information about Arvida Group Limited.
A number of non-GAAP financial measures are used in this presentation. You should not consider any of these in isolation
from, or as a substitute for, the information provided in the audited consolidated financial statements for the year ended
31 March 2017, which will be made available at www.arvida.co.nz.
Forward-looking statements are subject to any material adverse events, significant one-off expenses or other
unforeseeable circumstances.
The information in this presentation is of a general nature and does not constitute financial product advice, investment
advice or any recommendation. Nothing in this presentation constitutes legal, financial, tax or other advice.
25You can also read