Changes in Dementia Incidence, Prevalence, Severity and Mortality - Estimating future demand across the Dementia pathway
←
→
Page content transcription
If your browser does not render page correctly, please read the page content below

Changes in Dementia Incidence,
Prevalence, Severity and Mortality
Estimating future demand across the
Dementia pathway

A support pack for commissioning Dementia services

NHS Dudley Clinical Commissioning Group
Key points for the CCG

There has been a sustained increase in         If not already, the CCG should consider
Dementia prevalence in recent years, likely    implementing or improving the
due in part to improved ascertainment.         following interventions along the
There are significant practice variation in    Dementia pathway:
reported prevalence even accounting for age
                                               • Primary prevention – CVD risk-
profiles.
                                                 reduction
There are estimated to be around 4,067
patients in the CCG with Dementia.             • More timely and accurate diagnosis
Currently 58.6% are on Dementia disease        • Integrated care:
registers, compared to 58.0% regionally.               •   Social Care

Projections for the CCG suggest there may              •   MDT across 1o and 2o care
be around 4,891 patients living with                   •   Training for housing and nursing home staff
Dementia by 2021.
                                               •   Ongoing palliative care
In order for the CCG to achieve the 67%        •   Carer support
diagnosis aspiration, they require 1,368 new
diagnosis throughout 2015.                     •   Dementia friendly communities and hospitals

                                                                                                         2
Background

There are currently estimated to be over ¾              Whilst this information is useful,
million people in the UK living with                    effective service planning will require
Dementia, costing society over £26 billion
                                                        detailed information about for
per year. Returns from primary care disease
registers and national prevalence estimates             example, the number of new cases of
suggest a large diagnosis gap across the UK             dementia, the progression of patients
[1].                                                    between mild, moderate and
These numbers and costs are likely to rise              advanced stages and the number of
materially over the coming years in line with           dementia patients who are expected
demographic changes to the population [2].              to die each year.
Primary and secondary mental health                     This support pack is intended to help
services will require detailed information to
support service planning.                               understand the need for future
HSCIC and NHS England have made                         dementia diagnosis and treatment
information available on the underlying                 services in their area and to identify
prevalence of dementia and the number of                and prioritise interventions.
dementia cases known to primary care.
                                         [1] Dementia Prevalence Calculator, Primary Care Webtool, NHS England
                                           [2] Dementia UK: Second edition, Alzheimer’s Society, September 2014   3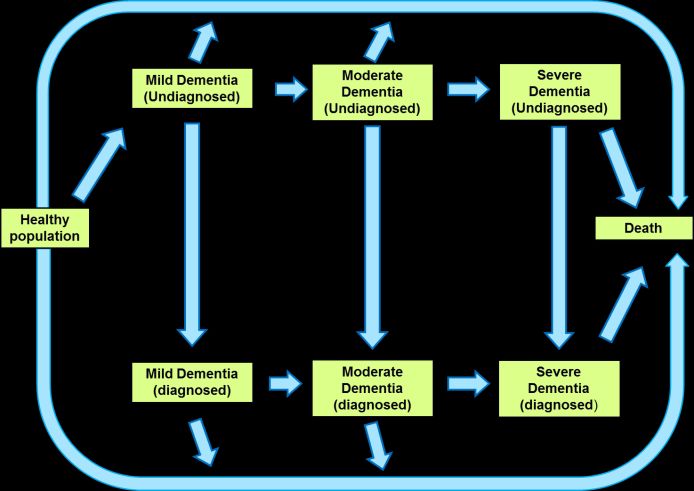
Pack contents

There are 4 principle components to the     Steps 1 & 2 replicate information that is
analysis presented in this report:          already available via the HSCIC and NHS
                                            England’s Dementia Prevalence Calculator,
1. A review of historic and current rates   however they are necessary steps in
   of formal diagnosis of Dementia          developing the model (step 3) that predicts
   from Primary Care registers              the future burden of Dementia.
2. Estimates of the likely prevalence       Whilst the modelled estimates in 3 & 4 are
   using the latest literature - thus       presented here unadjusted in the report, it
   deriving diagnosis rates.                should be noted that due to the margin for
                                            error, figures rounded to the nearest 50 or
3. Estimates of the future incidence,       100 should be used for planning
   severity of disease and mortality        assumptions.
   using the latest population
   projections and a Markov chain
                                            NB. Due to slight methodological differences
   modelling approach
                                            or variations in assumptions, the outputs of
4. Estimates of the prevalence of           our modelling are comparable but may not
   dementia in nursing and care homes.      match precisely with that of existing modelled
                                            estimates of dementia prevalence from other
                                            sources.
                                                                                          4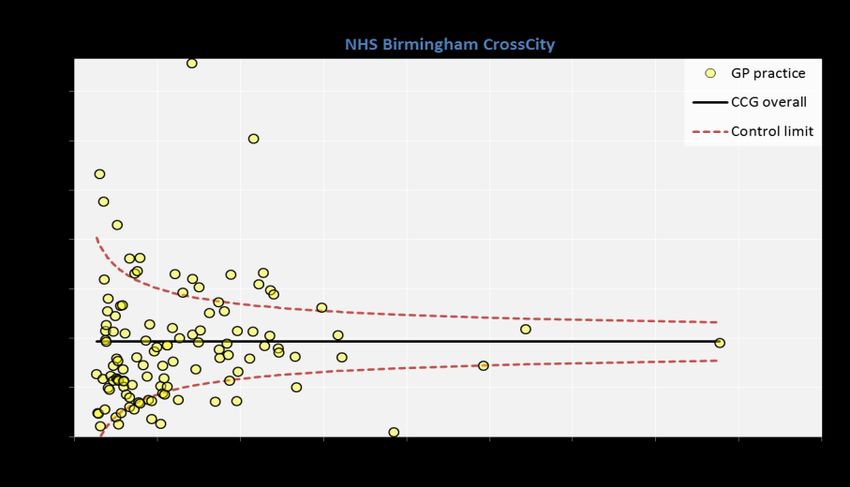
How to interpret the information
Box and Whisker plots:                                                                             SPC Funnel charts:

                                                                                                   The funnel charts show the spread of reported prevalence data by practice in the context of the
                                                                                                   practice list size. Practices with smaller populations have a wider range of values that would be
                                                                                                   considered ‘normal’. The red lines in funnel shape represent control limits (equivalent to 3
                                                                                                   standard deviations from the CCG mean). Practices falling outside these limits demonstrate
                                                                                                   ‘special cause variation’ and may be worthy of further investigation.

These charts show the distribution of practice data in the CCG for each year of QOF. The green
bars show the interquartile range (IQR, the middle 50% of practices) and the yellow circle on
line shows the median (middle) value of all practices.                                             The reasons for high outliers may be that they are nursing home practices therefore have a
                                                                                                   particularly high prevalence. Similarly, those practices with very low prevalence may be
                                                                                                   University practices and thus have few patients with Dementia.

If the IQR is small, then the practices tend to have similar prevalence. A larger IQR suggests a
greater variation in prevalence. If the median is not in the centre of the IQR then the data are
skewed i.e. more practices are above/below the average.                                            However, any outlying practice may also have good or poor processes in place to identify new
                                                                                                   Dementia patients.

Maximum and minimum outliers are also shown so the full extent of the data range can be
seen.

                                                                                                                                                                                                   5
1. Evaluation of changes over time and variation in
reported Dementia prevalence
The following information utilises For pre-CCG information, data is
publically available QOF data at practice processed at practice level and
and CCG level.
aggregated to current CCG
Changes to diagnosed prevalence over
configurations. Where historic
time for practices and CCGs are
compared to national and regional practices do not exist in current CCG
trends and assessed for significance of configurations, they are allocated on a
any differences. PCT-to-CCG best fit basis. Although
The nature and extent of current small in number, this may affect some
variation in practice and CCG-level CCG outputs more than others.
prevalence is evaluated using statistical
process control methods to identify
potential outliers.
Projections are provided for future
disease register sizes to 2021 on the
basis of 67% (2015) and 80% (2021)
ascertainment rates.
61. Evaluation of changes over time and variation in
reported Dementia prevalence
Trends in diagnosed prevalence, 06/07 to 14/15*
Reported prevalence trajectory (QOF) in CCG, Region and England (relative growth
06/07 to 14/15 in brackets): NHS Dudley
0.8%
Diagnosed prevalence of Dementia per 100 population
0.7%
0.6%
0.5%
0.4%
0.3%
0.2%
NHS Dudley CCG (108.8%) West Midlands (86.4%) * QOF
0.1%
submissions to
England (84.5%) end Mar 2015
0.0%
2006/07 2007/08 2008/09 2009/10 2010/11 2011/12 2012/13 2013/14 2014/15*
* Prevalence figures for 2014/15 are based on the Dementia-specific QOF returns as at March 2015
published by the HSCIC. Final QOF prevalence figures for 14/15, when published, may differ slightly. 71. Evaluation of changes over time and variation in
reported Dementia prevalence
Variation in current reported prevalence [1]
Box and whisker plot - distribution of reported prevalence in GP practices, 2006/07 to 2014/15
NHS Dudley
12.0%
10.0%
8.0%
6.0%
4.0%
2.0%
0.0%
2006/07 2007/08 2008/09 2009/10 2010/11 2011/12 2012/13 2013/14 2014/15*
Interquartile range Median Min Outlier Max Outlier
81. Evaluation of changes over time and variation in
reported Dementia prevalence
Variation in current reported prevalence [1]
Box and whisker plot - distribution of reported prevalence in GP practices, 2006/07 to 2014/15
NHS Dudley
12.0%
10.0%
8.0%
6.0%
4.0%
2.0%
0.0%
2006/07 2007/08 2008/09 2009/10 2010/11 2011/12 2012/13 2013/14 2014/15*
Interquartile range Median Min Outlier Max Outlier
91. Evaluation of changes over time and variation in
reported Dementia prevalence
Variation in current reported prevalence [2]
Variation in reported dementia prevalence in 65+ population by practice, 2014/15
NHS Dudley
M87018
GP practice
30.6%
CCG overall
Percentage of list size (65+) on Dementia register
27.2%
Control limit
23.8%
20.4%
17.0%
13.6%
10.2%
6.8% M87634
M87617
M87601
M87024
3.4%
M87002
M87021
M87037 M87023
M87605
0.0%
0 1000 2000 3000 4000 5000 6000
Practice list size aged 65+ 101. Evaluation of changes over time and variation in
reported Dementia prevalence
Variation in current reported prevalence [3]
Practices with the highest number of cases relative to 65+ list size 2014/15:
Patients with The reasons for high
Code Practice Name outliers may be that the
65+ Dementia
practice has a high volume
M87018 SUMMERHILL SURGERY 1,904 630 of nursing home patients
M87601 KEELINGE HOUSE SURGERY 864 42 therefore has an artificially
M87617 NETHERTON SURGERY 235 13 high prevalence. These
practices may also have
M87634 ST. THOMAS'S MEDICAL CENTRE 47 3 good early diagnosis
M87024 WYCHBURY MEDICAL GROUP 4,399 178 processes in place.
Practices with the lowest number of cases relative to 65+ list size 2014/15:
Patients with Practices with very low
Code Practice Name prevalence may be
65+ Dementia
University practices and
M87023 WORDSLEY GREEN HEALTH CENTRE
2,136 38 thus have few patients with
M87037 THE NORTHWAY SURGERY 1,376 25 Dementia. Alternatively
they may have poor
M87021 COSELEY MEDICAL CENTRE 1,404 27
processes in place to
M87002 NORTON MEDICAL PRACTICE 1,513 31 assess and refer potential
M87605 CENTRAL CLINIC 580 6 Dementia patients.
111. Evaluation of changes over time and variation in
reported Dementia prevalence
Geographical variation in reported prevalence
2006/07 2013/14
NB. Size of practice
‘squares’ is in relation to
the median list size
across the 2 periods. As
such, any changes in size
reflects an
increase/decrease in list
size to 2013/14.
122. Estimating the total number of Dementia patients
This analysis utilises the latest For the purposes of this report, the
prevalence estimates [3,4] to model the definition of Dementia stages has
likely true prevalence of Dementia. As
been taken from Dementia UK report,
these estimates combine pre-65 and
2007 [6].
65+ age-specific prevalence from
different sources, they may differ The modelled prevalence for 2014 is
slightly from those published in the compared to the year-to-date
Dementia Prevalence Calculator.
reported prevalence in 2014/15 to
Rates have been applied to Clinical derive a ‘diagnosis rate’. The variation
Commissioning Groups using the most in this measure is assessed across the
up-to-date age and gender resident
region at CCG level and by using
population counts from ONS adjusted
statistical process control charts [7]
for registration to resident ratios [5].
to determine significant variance
A break-down of dementia diagnosis
from the national average.
by severity/stage and by Dementia
sub-type for the CCGs is presented.
[3] CFAS II. Matthews, Fiona E et al. The Lancet , Volume 382 , Issue 9902 , 1405 – 1412
[4] Dementia UK: Second edition, Alzheimer’s Society, September 2014
[5] Office for National Statistics, mid-year population estimates 2013.
[6] Knapp M, Prince M. Dementia UK. Alzheimer’s Society, 2007.
[7] Flowers J. Technical briefing 2: Statistical process control methods in public health intelligence. APHO, December 2007. 132. Estimating the total number of Dementia patients
This analysis utilises the latest For the purposes of this report, the
prevalence estimates [3,4] to model the definition of Dementia stages has been
likely true prevalence of Dementia. As taken from Dementia UK report, 2007
these estimates combine pre-65 and [6].
65+ age-specific prevalence from
The modelled prevalence for 2014 is
different sources, they may differ slightly
compared to the year-to-date reported
from those published in the Dementia
prevalence in 2014/15 to derive a
Prevalence Calculator.
‘diagnosis rate’. The variation in this
Rates have been applied to Clinical measure is assessed across the region at
Commissioning Groups using the most CCG level and by using statistical
up-to-date age and gender resident process control charts [7] to determine
population counts from ONS adjusted significant variance from the national
for registration to resident ratios [5]. average.
A break-down of dementia diagnosis by [3] CFAS II. Matthews, Fiona E et al. The Lancet , Volume 382 , Issue 9902 , 1405 –
severity/stage and by Dementia sub- [4] Dementia UK: Second edition, Alzheimer’s Society, September 2014
1412
type for the CCGs is presented. [5] Office for National Statistics, mid-year population estimates 2013.
[6] Knapp M, Prince M. Dementia UK. Alzheimer’s Society, 2007.
[7] Flowers J. Technical briefing 2: Statistical process control methods in public
health intelligence. APHO, December 14 2007.2. Estimating the total number of Dementia patients
Overall burden of disease [1] Year Mild Moderate Advanced
2014 2,325 1,297 445
The current total estimated number of 2021 2,768 1,565 558
Change 443 268 113
patients in the CCG with Dementia is
% change 19.1 20.6 25.5
4,067
This is projected to rise to 4,891 -
a net increase of 824 by the year 2021.
In the latest available QOF data
(2014/15 to Mar 31st) for disease
Dementia sub-type, 2014 Estimate %
Alzheimer's disease 2,521 62% registers 2,385 patients are being
Vascular dementia 691 17% managed by GPs in the CCG for
Mixed dementia 407 10%
Dementia – a diagnosis rate of 58.6%
Dementia with Lewy bodies 163 4%
Frontotemporal dementia 81 2% compared to 58.0% across the region
Parkinson's dementia 81 2% as a whole.
Other 122 3%
Total 4,067 152. Estimating the total number of Dementia patients
Overall burden of disease [2]
Estimated number of people with Dementia by 'Population' pyramid for Dementia, 2014
age and gender, 2014 and 2021 NHS Dudley
2014 2021 85+ 1,221 369
Age-
group Male Female Male Female
50-54 7 6 7 6 -6 80-84 -6 479 396
55-59 16 9 19 11 -9 -11
60-64 79 81 82 83 -81 75-79-83 413 298
65-69 109 166 98 154 -166 -154
70-74 220 197 249 220 -197 70-74
-220 197 220
75-79 298 413 354 470 -413 -470
80-84 396 479 494 533 -479 65-69
-533 166 109
85+ 369 1,221 561 1,549 -1,221 -1,549
Aged 50+ 1,494 2,573 1,864 3,027 60-64 81 79
Early
onset
The numbers of early-onset dementia cases in the 55-59 Dementia 9 16
CCG population are relatively small compared to
the overall burden and unlikely to increase
50-54 6 7
dramatically over the next few years. Female Male
162. Estimating the total number of Dementia patients
Variation in prevalence and diagnosis rates
Reported prevalence Diagnosis rate
Variation in reported prevalence of Dementia by West Midlands CCG, perNHS Walsall Diagnosis ratio of Dementia patients by West Midlands CCG, 2014/15
6.0%
head of 65+ population, 2014/15
90%
CCG prevalence CCG diagnosis rate
3 sigma limit 3 sigma limit
5.5%
2 sigma limit 2 sigma limit
West Mids prevalence 80% West Mids diagnosis rate
5.0%
Population prevalence rate per 65+
Percentage of patients 'identified'
SOT
4.5% WOL SHR SOT
70% NST
NST WAL SHR
BSC BCR
4.0% CCH WAL
WOL
SWO 60%
3.5%
COV
TWR HER
SOL SWA
3.0% SWO
WNO SES 50% HER COV
2.5% WNO SES
2.0% 40%
20000 30000 40000 50000 60000 70000 80000 90000 100000 1000 2000 3000 4000 5000 6000 7000
Population aged 65+ Estimated dementia patients
The CCG currently has well above average reported prevalence and current diagnosis rates compared to
the region as a whole.
This may suggest overall the systems in place for the identification of disease are GOOD compared to the
West Midlands, although improvements can always be made in diagnosis across disease stages, for all age
groups and in some GP practices.
173. Predicting the future number of Dementia patients
across the pathway.
Analysis at this level utilises the latest evidence of A Markov chain model approach is used to allocate
disease progression and mortality in dementia at a numbers of patients to different states of disease
population level [10]. We have assumed a static over time, forecasting these likely states up to
age-specific incidence rate over time in the 2021. These are compared to aspirational
absence of quality evidence to the contrary. diagnosis rates to 2015 and 2021 of 67% and 80%
respectively to identify opportunities for the
The model parameters haven been applied to the
identification of new cases of dementia.
latest CCG-specific population projections [11].
These projections are based on resident
populations within CCG geographical boundaries.
As such, prior to modelling we have adjusted the
total resident population by historic CCG
registered-to-resident population ratios and
applied the resident-based age and gender
population distribution to obtain estimates for
CCG-registered populations.
[10] Launer LJ et al. Rates and Risk factors for Dementia and Alzheimer’s disease. EURODEM
Incidence Research Group, 1999
[11] Mid-year population estimates and 2013-based SNPP. Office for National Statistics
183. Predicting the future number of Dementia patients
across the pathway.
Overall burden of disease [1]
Estimated number of prevalent cases of Dementia by stage and gender, 2012 to 2021
NHS Dudley
Mild Moderate
1,600 1,600
1,400 1,400
1,200 1,200
1,000 1,000
800 800
600 600
400 400
200 200
0 0
2012 2013 2014 2015 2016 2017 2018 2019 2020 2021 2012 2013 2014 2015 2016 2017 2018 2019 2020 2021
Males Females Males Females
Advanced All stages
3,500
1,600
1,400 3,000
1,200 2,500
1,000 2,000
800
1,500
600
1,000
400
200 500
0 0
2012 2013 2014 2015 2016 2017 2018 2019 2020 2021 2012 2013 2014 2015 2016 2017 2018 2019 2020 2021
Males Females Males Females 193. Predicting the future number of Dementia patients
across the pathway.
Prevalence by disease stage
Estimated and projected dementia prevalence by stage, 2014 and 2021
6,000
Advanced
Moderate
Mild
5,000
558
Total numbers with the disease
25.5
4,000
431
1,565
20.6
3,000
1,264
2,000
2,768
19.1
2,269
1,000
0
2014 % change 2021
203. Predicting the future number of Dementia patients across the pathway.
Aspiration and opportunity for diagnosis
Opportunity for case-finding - the gap between estimated and diagnosed patients:
NHS Dudley
58.6% 67.0% 80.0%
4,891 ‘Diagnosis gap 1’
refers to the
asp act gap gap1 curr
4,600
Total estimated cases difference between
2013 2,939 1914
978
2014 4,067 4,067
3,226 4,169 2385 2,385 diagnosed
2015
4,000
2,793 4,169 3,481 1,376 2619 348 2,445 DIAGNOSIS 'GAP' 2 numbers at the
2016 3,614 2731 3,912
Number of patients
2017
Target diagnosis
Total estimated
rate cases
3,760 2852 Current
diagnosis rate current rate (Jan
2018 3,917
1,376
2984
‘15) and the
2019 4,078
DIAGNOSIS 'GAP' 23118
DIAGNOSIS 'GAP' 1
aspirational rate
3,400 1,044
2020 4,240 3254
2021 3,912 4,891 4,402 978 3390Target1,044
diagnosis2,868
rate DIAGNOSIS 'GAP' 1 for the CCG.
2,800 2,793
2,868
348
2,445
Current diagnosis rate ‘Diagnosis gap 2’ is
2,385
2,200
the difference
between 100%
1,600 ascertainment of
2013 2014 2015 2016 2017 2018 2019 2020 2021 estimated cases
Current Target Target ? and the
Flows through dementia pathway milestones, 2013 to 2021
aspirational rate
for the CCG
213. Predicting the future number of Dementia patients
across the pathway.
The ‘opportunity’ for diagnosis presented
Diagnosis requirements for the CCG
here is based on numbers of aspirational
cases at year end (point prevalence). The sum
No. on Aspirat - Deaths New New of the change from the previous years’ point
Year
Register ional no. from diagnosis diagnosis prevalence (at aspirational rate) plus deaths
(current on register require - required
rate) register prior year ment pppy^* during the prior year equate to the
‘opportunity’.
2013~ 1,914 1,914 455 652 14
2014~ 2,385 2,385 450 921 19
2015 2,445 2,793 459 867 18
2016 2,506 2,955 476 638 13 As such, the number of newly identified
2017 2,574 3,131 485 660 14
patients required in any given period to even
2018 2,648 3,319 499 687 14
2019 2,723 3,513 517 711 15 maintain the diagnosis rate exceeds that of
2020 2,797 3,711 531 729 15 the simple gap between the current and
2021 2,868 3,912 554 755 16
previous diagnosis aspirations.
^ pppy = per practice per year
* assuming diagnosis gap met in prior year
~ actual numbers on register as per QOF The figures for each year depend on the
previous year’s diagnosis aspiration being
met. Should they not, the volumes will
accumulate and the gap become more 223. Predicting the future number of Dementia patients
across the pathway.
Estimated patient flows for the CCG
The numbers of incident Flows through dementia pathway milestones, 2013 to 2021
cases are rising steadily due 1,400
NHS Dudley
to demographic changes,
however the rate remains 1,200
constant. Estimated number of patients 1,000
The number of deaths are 800
estimated to rise at a
600
slightly slower rate, hence
the incremental growth in 400
prevalence each year. 200
Across the CCG between 0
390 and 480 patients will 2013 2014 2015 2016 2017 2018 2019 2020 2021
Incident cases (mild) Deaths Progress mild-to-mod Progress mod-to-adv
progress from mild to
moderate disease each year, The scale and nature of services for patients and their carers along each
and a further 130 to 160 element of this pathway will vary by CCG. Where numbers are fairly small,
from moderate to advanced neighbouring CCGs may wish to co-commission some services.
stage disease.
234. Estimates of Dementia in care and nursing homes.
2021 estimates are based on the changes to the
Methods and summary combined population prevalence of moderate and
The exact number of persons living in care homes severe disease predicted by our model to that time.
Overall numbers in nursing homes are assumed to
is not known. There has been no national data remain constant.
collection for GP populations since September With dementia*
2011, for which an overall ‘Nursing Home’ All* 2014 2021
population was counted [8]. CCG Patients in
2,025 1,280 1,518
residential care (all)
The Census tells us how many people within a Patients in Local
specified residential area live in care homes by Authority care homes
99 57 57
type (Local Authority / Other with nursing / Other Patients in other care
without nursing). 1,214 703 840
homes w/o nursing
By applying these proportions to the latest CCG Patients in other care
712 520 621
homes with nursing
registered populations we can estimate the likely
numbers in homes by type and thus derive further * Summed figures may differ to overall figures due to rounding
estimates of the numbers in the CCG with NB. These are broad estimates only, intended for
Dementia. high-level planning use. Specific and up-to-date
The prevalence estimates used here are the local data collections would be required at GP or
setting-based consensus estimates taken from the care home level when considering the design and
2014 Dementia UK update report [9]. scale of care home services and/or interventions.
[8] Health and Social Care Information Centre, Indicator Portal, Data item number P01109
[9] Dementia UK: Second edition, Alzheimer’s Society, September242014List of appendices
1. Markov model visualisations, 2014 and
2021.
2. Dementia pathway intervention points
3. Other resources and links
4. Markov model explained
5. Additional modelling assumptions
25Appendix 1a: Markov Chain Model outputs: Baseline year
(2014)
Dementia patient stocks and flows, 2014: NHS Dudley
145 35 2
Undiagnosed 1,362 303 17
1,062 151 19
Healthy 605 125 18 Death
population
107 57
Diagnosed 963 994 427
103 114 60
2014 2021 x y
Stock New incidence 1,062 1,280 0 5
Flow- Diagnosed - Mild
Death 103
MILD 192 2 1
MODERATE ADVANCED
Death - Diagnosed - Moderate 114 183 4 1
26Appendix 1b: Markov Chain Model outputs: Final year (2021)
Progress-Diagnosed-mildtomod
Dementia patient 107 stocks206
and flows,22021: NHS
3 Dudley
Progress-Diagnosed-modtoadv 57 95 4 3
Diagnosis of mild 605 496 1 4
Diagnosis of moderate 125 153 3 4
Diagnosis of advanced 18 5 5 4
105
Progress-Undiagnosed-mildtomod 151 113 2 5
Progress-Undiagnosed-modtoadv 19 2 4 5
Undiagnosed-Mild 1,362
Undiagnosed 978 978 1 6
Undiagnosed-Moderate 303 0 3 6
Undiagnosed-Advanced 17 0 5 6
1,280
Death - Undiagnosed - Mild 145 105 113 2 7 2
Death - Undiagnosed - Moderate 35 0 4 7
DeathHealthy
- Undiagnosed - Advanced 2 0 6 7
496 153 5 Death
population Died 7 4
206 95
Diagnosed 1,790 1,565 558
192 183 78
Stock
Flow MILD MODERATE ADVANCED
27Appendix 2: Intervention points and management of disease
TIMELY ACCURATE
DIAGNOSIS:
• Primary Care assessment
PRIMARY & referral
PREVENTION: Dementia patient stocks and flows, 2014: NHS Dudley
• Self help information
• Promote
wellbeing
• ‘Dementia
Friendly’
145 35 2
Undiagnosed 1,362 Carer support
303 17
1,062 151 19
Healthy 605 125 18 Death
population
INTEGRATED CARE:
MEMORY • Dementia friendly housing
107 • Integrated CMHT 57
ASSESSMENT:
• Reablement / Intermediate Care
• Multi-
• Quality residential / nursing care
disciplinaryDiagnosed 963 994 427 ADVANCED
• Expert diagnosis
CARE:
• Home treatment
103 114 60 / Crisis
intervention
• Appropriate
2014 2021 x y Home & Respite
Stock New incidence
ONGOING CARE:
1,062 1,280 Carer support
0 5 care
• IAPT Flow
Death - Diagnosed - Mild 103
MILD 192 2 1
MODERATE ADVANCED
• GeneticDeath - Diagnosed - Moderate
counselling 114 183 4 1
• Dental / Hearing / Sight PALLIATIVE CARE:
checks • End-of-life
• BereavementAppendix 3: Other resources and useful links
Information and Intelligence: Commissioning support:
1. Dementia Prevalence calculator - 4. West Midlands SCN -
https://www.primarycare.nhs.uk/default.aspx http://www.wmscnsenate.nhs.uk/strategic-clinical-
network/our-network/mental-health-dementia-and-
Information and interactive reports of practice and
neurological-conditions/
higher-level reported and estimated prevalence
snapshots (updated monthly). Information on current projects and commissioning
resources available from the SCN.
2. Mental Health, Dementia and Neurology
Intelligence Network - 5. National Institute for Health and Care
http://fingertips.phe.org.uk/profile-group/mental- Excellence -
health http://www.nice.org.uk/search?q=Dementia
Series of profiles and reports on common or severe All the latest UK guidance, quality standards and
mental health, dementia and neurology conditions. evidence on Dementia from NICE.
3. Health and Social Care Information Centre - 6.‘ Dementia Partnerships’ hub -
http://www.hscic.gov.uk/dementia http://dementiapartnerships.com/resource/dementia-
commissioning-pack/
Range of information and reports on timely diagnosis,
QOF, prescribing audits and the MHMDS in relation to Wide range of Dementia commissioning tools and
Dementia. templates grouped by stages and settings. 29Appendix 4. Markov model explained
Specific formulae for our model:
A Markov chain is a process with a Parameter Ref Derivation
finite number of states and Prevalent Cases – Mild,Moderate,Advanced P1,2,3 Population projection
x
dependent events. The likelihood of Prevalent Cases - Total P Age and gender specific dementia prevalence rates
a patient moving from one state (e.g. Population projection
Mild dementia, undiagnosed) to Incident Cases I x
Age and gender specific dementia incidence rates
another (e.g. diagnosed) is generally Death of Prevalent Cases - Mild D1
pre-determined by available Death of Prevalent Cases - Moderate D2 Prevalent cases
x
evidence or expert consensus. The Death of Prevalent Cases - Advanced D3 Age and gender and CCG specific mortality rate
‘flows’ of patients through states are Death of Prevalent Cases - Total D
applied to the ‘stocks’ from previous Prevalent Cases - Mild > Moderate T1 T1(t+1)= P3(t+1)-P3(t)+D3(t+1)
periods (in this case a period = 1 Prevalent Cases - Moderate > Advanced T2 T2(t+1) = P2(t+1)- P2(t)+D2(t+1)+T1(t+1)
year) in order to estimate the ‘stocks’ Diagnosed Cases - Mild R1 R1(t+1) = R(t+1) -R2(t+1) -R3(t+1)
Diagnosed Cases - Moderate R2 R2(1) = 0.7 R2(t+1) = (R2(t)/(P32(t) +0.03) x P2 (t+1)
in future periods.
Diagnosed Cases - Advanced R3 R3(1) = 0.95 R3(t+1) = (R3(t)/(P3 (t) +0.0053) x P3 (t+1)
Diagnosed Cases - Total R R(t+1) = (R(t)/P(t) +0.03)*P(t+1)
Diagnosed Cases - Mild > Moderate S1 S1(t+1)= P1(t+1)xR1(t+1) / T1(t+1)
Diagnosed Cases - Moderate > Advanced S2 S2(t+1)= P2(t+1)xR2(t+1) / T2(t+1)
Death of Diagnosed Cases - Mild E1 E1(t+1) = E(t+1) -E2(t+1)- E3(t+1)
Death of Diagnosed Cases - Moderate E2 E2(t+1)= D2(t+1) x 0.8
Death of Diagnosed Cases - Advanced E3 E3(t+1) = D3(t+1) x 0.95
Death of Diagnosed Cases - Total E E(t+1) = D(t+1) x 0.8
New Diagnoses – Mild,Moderate,Advanced N1,2,3 N1(t+1) =N(t+1)-N2(t+1)-N3(t+1)
New Diagnoses - Total N N(t+1) = E(t+1)+R(t+1)-R(t) 30Appendix 5: Additional assumptions used in the
modelling
The aspirational diagnosis for 2015 is set at 67% in That the distribution of the over 85 projected
line with the National Dementia Challenge. Where population for England & Wales is the same for
current CCG diagnosis exceeds that, the current each CCG.
rate is used for maintenance purposes.
That the number of practices per CCG will remain
The aspirational diagnosis for 2021 is set arbitrarily the same up to 2021.
at 80%.
That the sub-types of Dementia follow the same
Currently it is assumed that 70% of those with distribution for each CCG.
moderate disease and 95% of those with advanced
The adjustment to nursing home dementia
disease are on disease registers. Both are assumed
patients for changes in population prevalence of
to be at 100% ascertainment by 2021.
moderate/severe cases to 2021 only apply to non
That 20% of dementia patients die before formal Local Authority care homes.
diagnosis. This remains unchanged to 2021.
That the rates of all cause mortality by CCG follow
the same distribution as Dementia specific
mortality rates by CCG.
31Andrew Hood T: 0121 612 2800 E: andrewhood@nhs.net A: Kingston House | 438 -450 High Street | West Bromwich | B70 9LD M: 07720 343930
You can also read