Investor Presentation - Q1 2017 - Chartwell Retirement Residences

Page created by Norman Pearson
 
CONTINUE READING
Investor Presentation - Q1 2017 - Chartwell Retirement Residences
Investor Presentation
      Q1 2017
Investor Presentation - Q1 2017 - Chartwell Retirement Residences
Cautionary Statements
This presentation contains forward-looking information that reflects the current expectations,
estimates and projections of management about the future performance and opportunities for
Chartwell and the seniors housing industry. The words “plans,” “expects,” “scheduled,”
“estimates,” “intends,” “anticipates,” “projects,” “believes” or variations of such words and phrases
or statements to the effect that certain actions, events or results “may,” “will,” “could,” “might”
occur and other similar expressions identify forward-looking statements. Forward-looking
statements are based upon a number of assumptions and are subject to a number of known and
unknown risks and uncertainties, many of which are beyond our control, and that could cause
actual results to differ materially from those that are disclosed in or implied by such forward-
looking statements.
While we anticipate that subsequent events and developments may cause our views to change,
we do not intend to update this forward-looking information, except as required by applicable
securities laws. This forward-looking information represents our views as of the date of this
presentation and such information should not be relied upon as representing our views as of any
date subsequent to the date of this document. We have attempted to identify important factors
that could cause actual results, performance or achievements to vary from those current
expectations or estimates expressed or implied by the forward-looking information. However,
there may be other factors that cause results, performance or achievements not to be as
expected or estimated and that could cause actual results, performance or achievements to differ
materially from current expectations. There can be no assurance that forward-looking information
will prove to be accurate. Accordingly, readers should not place undue reliance on forward-
looking information. See the "Risks and Uncertainties" section in our 2016 MD&A and risk factors
highlighted in materials filed with the securities regulatory authorities in Canada from time to time,
including but not limited to our most recent Annual Information Form.
Non-GAAP Measures
In this document we use a number of performance measures that are not defined in generally
accepted accounting principles (“GAAP”) such as Funds from Operations (“FFO”), Adjusted
Funds from Operations (“AFFO”), Net Operating Income (“NOI”), “Same Property NOI,” “Same
Property Revenue,” “Same Property Direct Operating Expenses,” “G&A Expenses as a
percentage of Revenue,” “Interest Coverage Ratio,” “Indebtedness Ratio,” “Net Debt to Adjusted
EBITDA Ratio,” “Chartwell’s Interest”, “Adjusted EBITDA” and any related per unit amounts to
measure, compare and explain the operating results and financial performance of the Trust
(collectively, the “Non-GAAP Measures”). These Non-GAAP Measures do not have any
standardized meaning prescribed by International Financial Reporting Standards (“IFRS”) and,
therefore, may not be comparable to similar measures presented by other publicly-traded entities.
All financial information in this presentation is presented at Chartwell’s Interest. Please refer to
the “Non-GAAP Measures” section of our Q1 2017 MD&A for details.

 making people’s lives BETTER®                                                                           2
Investor Presentation - Q1 2017 - Chartwell Retirement Residences
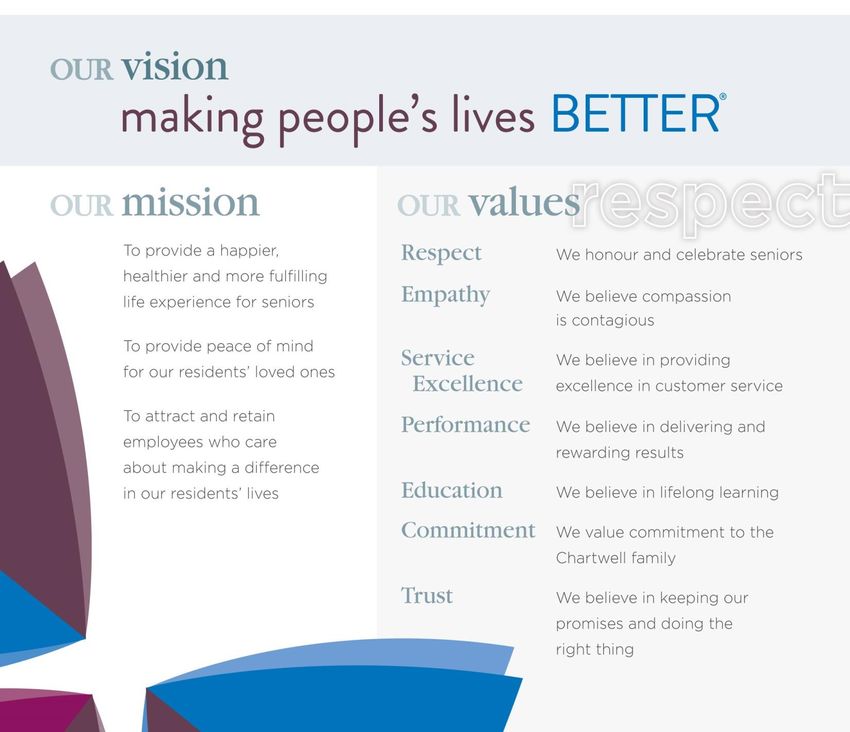
Why Chartwell?
Guided by our Vision, Mission and Values of Respect we focus
on providing quality care and services to our residents which we
believe will translate in sustainable earnings growth and long
term value creation for our unitholders.

making people’s lives BETTER®                                      3
Investor Presentation - Q1 2017 - Chartwell Retirement Residences
Why Chartwell?

      1. Unmatched national operating platform
      2. Well-located and well-maintained real estate portfolio
      3. Significant long-term growth potential
           Demographic trends = more demand
           Government fiscal constraints = more private pay demand
           Fragmented industry = consolidation opportunities

      4. Strong earnings growth potential
           1% growth in occupancy or rate = 2 cents growth in FFO
           Third consecutive annual increase in distributions effective
           March 31, 2017

      5. Improving financial position and lower interest
         costs on refinancing = reduced portfolio risk

making people’s lives BETTER®                                             4
Investor Presentation - Q1 2017 - Chartwell Retirement Residences
Profile - Corporate

  Member of S&P/TSX                          Largest Canadian           Significant Employer
   Composite Index                         Retirement Community
     since 2005                               Owner/ Operator
     $3.0 Billion (1)                            190 / 26,607               13,500
    Market Capitalization                 Communities / Suites & Beds
                                                                           Employees
            Revenue                              Adjusted EBITDA        High Occupancy Rates

  $852.4 Million (2)                            $250.4 Million (2)             93.0%
                                                                          Average Occupancy

    Interest Coverage                                Net Debt/               Debt to
          Ratio                                  Adjusted EBITDA          Capitalization
                                                                            (Market)
              3.5x                                      7.5                  39.8% (1)
  Strong Investment Grade                       Conservative Leverage    Conservative Leverage
          Coverage

As at March 31, 2017
(1) Trust Unit price $15.63 at March 31, 2017
(2) 12 months ended March 31, 2017

   making people’s lives BETTER®                                                                 5
Investor Presentation - Q1 2017 - Chartwell Retirement Residences
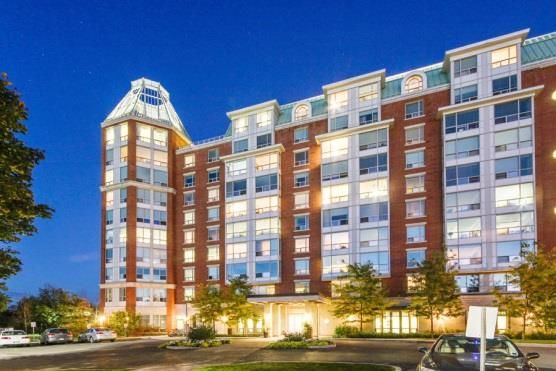
Profile – Property Portfolio
     •    Majority owned, well-maintained, well-located properties
     •    Diversified geographically and by service offering

                                                           By Ownership (1)
                                                                Managed
                                                                  5%
                                                   Joint
                                                 Venture (2)                            100% Owned
                                                   24%                                     71%

 By Geographic Location (3)                                                                          By Level of Care (3)
                            British
                           Columbia                                                                              Independent
                                                                                                                   Living 5%   Long Term
                             10%
                                   Alberta 3%                                                                                     Care
                                                                                                                                  17%
                                                                                         Independent                                   Memory
                                                                                          Supportive                                    Living
                                                                                            Living                                        1%
Ontario
                                        Quebec                                               72%                                       Assisted
 53%
                                         34%                                                                                            Living
                                                                                                                                          5%

                                                Leader in each of its markets:
                                     Province                           Share of Market (4)

                                     Ontario                                       16%

                                     Quebec                                         9%

                                     British Columbia                               7%
                                     Alberta                                       6%
1)    Based on number of properties.
2)    Minimum ownership of JV properties is 50%.
3)    Based on number of suites as of March 31, 2017.
4)    Ratio of Chartwell operated suites to total retirement suites inventory as reported by CMHC in their Seniors’ Housing Report –
      Canada Highlights (2016).

     making people’s lives BETTER®                                                                                                                6
Investor Presentation - Q1 2017 - Chartwell Retirement Residences
Profile - Industry
                      Independent               Assisted Living (AL)          Long Term Care (LTC)
                    Supportive Living            & Memory Living
                  (ISL) & Independent                  (ML)
                       Living (IL)
Level of Care:   Low to medium                  Medium to high               Very high

Target           More active, healthy seniors   Seniors with some            Seniors with acute cognitive
Resident:                                       cognitive and/or physical    and/or physical impairments
                                                impairments                  requiring higher levels of daily
                                                                             personal care

Service          Activities, transportation,    IS/IL services + Care        24-hour registered nursing
Offering:        security                       services and specific ML     care or supervision
                 Availability of meals,         programming included
                 housekeeping, basic
                 assistance with daily living

Funding:         Predominantly private pay      Mostly private pay           Predominantly government
                                                                             funded

Regulations:     Mostly consumer protection     Mostly consumer              Heavily regulated
                                                protection

                                                                            17%
               Chartwell’s Portfolio                                        LTC
                by Level of Care

                                                                   83%
                                                              ISL/IL/AL/ML
                                                                       83%
                                                                  ISL/IL/AL/ML

making people’s lives BETTER®                                                                                   7
Investor Presentation - Q1 2017 - Chartwell Retirement Residences
Profile - Industry
                      Significant Future Demand in Canada
                                                  Projected Aged 75 and over Population, 2015-2036, Canada
                6,000,000

                5,000,000

                4,000,000

                3,000,000

                2,000,000

                1,000,000

                            -
                                         2015                   2016                   2021                   2026                   2031                2036

                                                          2015                    2016                    2021                   2026                 2031                   2036
   Projected 75+ Population                             2,495,700               2,563,400               3,024,000              3,766,200            4,614,900              5,457,400

   Cumulative 75+ Growth from 2014                        56,000                  123,700                584,300               1,326,500            2,175,200              3,017,700

   Average Annual Increase                                56,000                  67,700                  92,120                 148,440             169,740                 168,500
      Source: Statistics Canada, Population Projections for Canada, Provinces, and Territories, 2009 to 2036, Catalogue no. 91-520-X, 2010

      •        The size of our market more than doubles in the next 20 years
      •        Current supply is ~ 425,000 suites
      •        ~ 600,000 new suites are required by 2036
          Total Supply                                                                                                                          Required Annual Supply

          1,200,000

          1,000,000

            800,000

            600,000

            400,000

            200,000

                        0
                                      2015                      2016             2021                           2026                         2031                 2036
                                                                        Long Term Care                     Retirement

Retirement demand is estimated by applying the current national capture rate of 8.0% (CMHC Seniors Housing Report Canada Highlights, 2014) to 75+ population as reported by Statistics Canada.
LTC demand is estimated based on 97.8 beds per 1,000 people aged 75 and over. This estimate represents the 2005-2010 average LTC Beds/Population ratios reported by Statistics Canada in their
Residential Care Facilities reports.

making people’s lives BETTER®                                                                                                                                                                    8
Investor Presentation - Q1 2017 - Chartwell Retirement Residences
Profile - Industry
                                                 Canadian Supply Concentration
Largest Retirement Operators                                     No. of Properties         No. of Suites   Largest Long Term Care Operators                                 No. of Properties         No. of Suites
                                                                   Operated (1)             Operated (2)                                                                      Operated (1)             Operated (2)

1        Chartwell Retirement Residences                                    176               25,791       1        Extendicare Inc.                                                  101                13,562
2        Revera Inc.                                                        100               12,175       2        Revera Inc.                                                        75                10,099
3        BayBridge Senior Living                                             69               8,694        3        Sienna Senior Living                                               42                6,738
4        Réseau Sélection                                                    33               8,550        4        Chartwell Retirement Residences                                    28                3,741
5        Cogir                                                               34               7,603        5        Schlegel Villages                                                  15                2,301
6        Le Groupe Maurice                                                   27               7,579        6        Retirement Concepts                                                17                1,918
7        Groupe Savoie                                                       14               5,331        7        Group Champlain                                                    14                1,746
8        Verve Senior Living                                                 36               4,475        8        Park Place Seniors Living                                          15                1,692
9        All Seniors Care                                                    29               4,383        9        Shannex Inc.                                                       14                1,648
10       Atria Senior Living                                                 29               3,354        10       Rykka Care Centres                                                  9                1,520
11       Shannex Inc.                                                        12               2,142        11       Jarlette Health Care                                               14                1,486
12       Retirement Concepts                                                 19               2,031        12       Omni Health Care                                                   18                1,475
13       Schlegel Villages                                                    8               1,820        13       Caressant Care                                                     15                1,247
14       Good Samaritan Society                                              25               1,713        14       Good Samaritan Society                                             13                1,228
15       Sienna Senior Living                                                15               1,502        15       Steeves & Rozema                                                    7                 928

                          Total                                             626               97,143                                 Total                                            397                51,329

               15 Largest Operators’ Share of Total Suites                                     43%                       15 Largest Operators’ Share of Total Suites                                      26%
(1) Includes properties under development; Includes managed properties for third parties                   (1) Includes properties under development; Includes managed properties for third parties
(2) Includes only IL, AL and MC suites within the above-noted properties                                   (2) Includes only LTC units within the above-noted properties
Source: CBRE Limited and Chartwell                                                                         Source: CBRE Limited and Chartwell

     making people’s lives BETTER®                                                                                                                                                                                9
Investor Presentation - Q1 2017 - Chartwell Retirement Residences
Profile – Historical Performance

          Resident Revenue ($ millions)                                                 EBITDA ($ millions)

                                        $927.8
                       $922.7
                                                                                                 $256.9    $260.1
                                                                                                                              $250.7
           $874.5                                                                       $246.4

                                                               $834.7
                                                                               $202.3                               $206.51

$750.6                                             $750.11

2011         2012          2013         2014        2015         2016           2011    2012     2013     2014      2015      2016
                                                                        EBITDA 27%       28%      28%     28%       28%       30%
                                                                        Margin:

                                  Proven track record of profitable growth

     Source: Company disclosure based at Chartwell’s interest.
 1   Note: In 2015 Chartwell sold its U.S portfolio of 35 properties.

                                                                                                                               3
                                                                                                                               9

     making people’s lives BETTER®                                                                                                   10
Profile – Historical Performance
                                           FFO ($ millions)

                            Same property portfolio performance
                        94.0%                                                           7.0%

                        92.0%                                                           6.0%   NOI (YOY % Growth)
                        90.0%                                                           5.0%
          Occupancy %

                        88.0%                                                           4.0%

                        86.0%                                                           3.0%

                        84.0%                                                           2.0%

                        82.0%                                                           1.0%

                        80.0%                                                           0.0%
                                                                                2017
                                2011    2012    2013    2014    2015    2016
                                                                                YTD
     Occupancy %                90.3%   90.3%   89.8%   90.3%   91.9%   93.6%   93.0%
     NOI (YOY % growth)         1.8%    3.7%    1.2%    1.8%    1.9%    6.6%    3.5%

   • Same property portfolio as defined in each year

making people’s lives BETTER®                                                                                       11
Profile – Credit Metrics

         EBITDA / Interest                                          Debt / EBITDA
                                                        9.3x
                                        3.5x    3.5x                      8.6x
                                                                8.7x
                                                                                   8.4x
                                2.8x
                        2.5x
                2.2x                                                                         7.6x            7.5x
        2.0x                                                                                         7.2x
1.9x

2011    2012    2013    2014    2015    2016    2017    2011    2012     2013      2014      2015    2016    2017
                                                YTD                                                          YTD

        Total Debt /GBV                                 Total Debt / Capitalization (1)

59.3%
        57.9%   56.6%   55.0%                           62.1%
                                49.7%   48.9%   50.1%                     55.9%
                                                                 54.0%              50.4%
                                                                                             43.1%
                                                                                                     40.3%   39.3%

2011    2012    2013    2014    2015    2016    2017    2011     2012      2013     2014     2015    2016    2017
                                                YTD                                                          YTD
                                                        (1) At market value of Trust Units

         Demonstrated ability to rationalize capital structure

   making people’s lives BETTER®                                                                                     12
Building Sustainable Value
                         Strategic Priorities

               Grow core                        Maintain
                property                        a strong
                portfolio                       financial
              contribution                      position

                                Exceptional
                                services and
                                quality care

               Improve
              quality and                      Build value
             efficiency of                       of our
             our corporate                     real estate
                support                         portfolio
               services

making people’s lives BETTER®                                13
Building Sustainable Value

                                Grow Core Property
                               Portfolio Contribution

     Maintain and
                                          Grow revenue                         Control costs
    grow occupancy
  Quality resident care                 Occupancy                          Labour relations
  and services
                                        Rate management                    Centralized
  Branding                              and suite turnover                 purchasing
  making people’s lives BETTER®

                                        Ancillary services                 Energy management
  Sales                                 program
  Improved training programs
  Performance-based
  compensation

         0.5pp                                2.0%                                 1.2%
      in Q1 2017*                         in Q1 2017*                          in Q1 2017*

                                  NOI     3.5% in Q1 2017*
  * Same property for three months ended March 31, 2017 compared to the same period of 2016

making people’s lives BETTER®                                                                  14
Building Sustainable Value

            Improve Quality and Efficiency of
             our Corporate Support Services
                      2011          - Budgeting and forecasting system
                      2012          - Consolidation and reporting system

  Continuing          2013          - Core financial system
                                    - Prospect management system
  investments                       - Standardized IT infrastructure rollout
      in IT                         - Capital budget system
   initiatives        2014          - Procurement and payment system
                                    - Capital asset management and reporting system
                      2015          - Internalized business support centre “At your
                                       Service”
                      2016/2017     - Implementation of Human Capital Management
                                      system

                          Blog

                          Website
     Online
    presence              Social Media
    strategy
                          Search Engine Optimization and Marketing

                          Chartwell Contact Centre

making people’s lives BETTER®                                                         15
Building Sustainable Value

                                     Mortgage Maturities

     * 10% of total mortgage debt = $175.1 million

                                                           At March 31, 2017                     At December 31, 2016
                                              Fixed Rate             Variable Rate      Total                   Total

Amount ($millions)
                                                     1,707.8                    42.8   1,750.6                1,722.7
Weighted average rate
                                                      3.83%                    2.87%    3.81%                  3.84%
Average term to maturity (years)                         6.9                     3.4       6.8                    6.9

       •      Well-staggered mortgage maturities reduce refinancing and
              interest rate risks

  making people’s lives BETTER®                                                                                         16
Building Sustainable Value
        Build Value of our Real Estate Portfolio
      Portfolio and                   Development                Acquisitions
    Asset Management

                     Market and                       Risk
                  Industry Research                 Management

                                            2

                                      Q1 2017

    Completed two acquisitions for a total of $28.9 million.
    Work continues on our development pipeline of 2,925 suites with nine
     projects in construction and five projects in pre-development.

making people’s lives BETTER®                                                   17
Building Sustainable Value

                •          Chartwell has continuously improved its portfolio by selling older
                           assets and buying/building newer, high-quality assets.
                •          Since 2013, the average age of suites acquired/developed is 7.8 years.
                •          Since 2013, the average age of suites sold is 22.6 years.

                      Average Age of Assets Acquired/Developed vs. Sold

                                                                              Acquisitions/Developments
                                                                              Dispositions
                      50
                      45
Average Age (years)

                      40
                      35
                      30
                      25
                      20
                      15
                      10
                       5
                       0
                                2013         2014         2015         2016               2017

                                                2013       2014      2015          2016          2017

                      Suites                    718        539       1,637         461            173
                      Acquired/Developed

                      Suites Sold               1,381     1,957      5,537         400            250

                                                                                                          1
                                                                                                          8

making people’s lives BETTER®                                                                                 18
Building Sustainable Value
                         Highlights of Development Pipeline
                                                                                                                    Costs
                                                                                                                 incurred
                                                                                                 Estimated           as at      Actual/
                                                                                              Development        Mar. 31,     Expected       Expected      Expected
                                                        Suites   Suite      Current Project        Costs (1)      2017 (2)   Completion   Stabilization   Unlevered
Project                                Location         / Beds   Type       Status              ($ millions)   ($millions)        Date            Date     Yield (3) )

Chartwell Waterford
Retirement Residence                   Oakville, ON       128    ISL / MC   Construction              40.3          14.9      Q3 2017       Q3 2019            8.3%
Chartwell Carlton Gardens
Retirement Residence                   Burnaby, BC        105    IL         Construction              38.4            9.9     Q4 2017       Q4 2019            7.7%
Chartwell Malaspina
Gardens Care Residence                 Nanaimo, BC        136    LTC        Construction              27.5          20.6      Q2 2017       Q2 2017            8.8%
Chartwell Bankside
Retirement Apartments                  Kitchener, ON       58    IL         Construction              18.6            2.5     Q2 2018       Q3 2019            7.3%
The Sumach by
Chartwell (4)                          Toronto, ON        332    IL         Construction              45.4          10.6      Q2 2018       Q2 2020            6.9%
Chartwell Meadowbrook                                                       Pre-
Village                                Lively, ON          55    IL / ISL   development               17.4            0.2     Q2 2018       Q2 2019            8.9%
Chartwell Wescott                                                           Pre-
Retirement Residence                   Edmonton, AB       137    ISL / MC   development               45.4            5.2     Q3 2018       Q4 2020            7.2%
Chartwell Guildwood                    Scarborough,                         Pre-
Retirement Residence           (5)     ON                 170    ISL / MC   development               56.0           0.3      Q2 2019       Q4 2020            8.4%
                                                        1,121                                        289.0          64.2

Projects by Batimo       (6)

Chartwell Le Prescott                  Vaudreuil, QC      290    ISL        Construction               N/A           N/A      Q2 2017       Q4 2018             N/A
Chartwell Le Montcalm                  Candiac, QC        283    ISL        Construction               N/A           N/A      Q4 2017       Q2 2019             N/A
Chartwell St. Gabriel                  St. Hubert, QC     310    ISL / AL   Construction               N/A           N/A      Q2 2018       Q3 2019             N/A
                                                                            Pre-
Chartwell Greenfield Park              Longueuil, QC      346    ISL / AL   development                N/A           N/A      Q4 2018       Q2 2020             N/A
                                       Quebec City,                         Pre-
Chartwell Charlesbourg                 QC                 410    ISL / AL   development                N/A           N/A      Q1 2019       Q1 2021             N/A
                                                        1,639
Project by Signature Living

Kingston Project   (7)               Kingston, ON         165    ISL / AL   Construction              33.0            6.8     Q2 2018       Q3 2021            7.0%

                                                        2,925                                        322.0          71.0

 (1)      Non-GAAP; refer to the “Non-GAAP Measures – Estimated Development Costs” section of this MD&A.
 (2)      Non-GAAP; reported at Chartwell’s Interest.
 (3)      Non-GAAP; refer to the “Non-GAAP Measures – Expected Unlevered Yield” section of this MD&A.
 (4)      Chartwell owns a 45% interest in this project and manages pre-opening and lease-up.
 (5)      Redevelopment of the existing 83-suite residence to a 170-suite residence. Chartwell owns a 50% interest in this project.
 (6)      Chartwell manages pre-opening and lease-up of these Batimo projects and has rights and obligations to acquire an 85%
          interest in these projects upon stabilization. N/A = not applicable to Chartwell as these projects are being developed by Batimo.
 (7)      The site includes excess land for potential development of 84 additional suites. Chartwell owns a 60% interest in this project
          and Signature Living and its affiliates own the remaining 40% interest and provide development and operations management
          services. Chartwell expects to acquire the remaining 40% interest upon stabilization.

  making people’s lives BETTER®                                                                                                                                      19
Building Sustainable Value
                Development Case Studies
        Chartwell Deerview Retirement Residence – ISL/ML

                                           •   119 suites
                                           •   Opened February 2014
                                           •   Unlevered cash yield 10.5%
                                           •   $27.2 million development cost

        Chartwell Georgian Traditions – Memory Living

                                           •   30 beds
                                           •   Opened March 2015
                                           •   Unlevered cash yield 10.8%
                                           •   $7.7 million development cost

        Chartwell Tranquility Place - Apartments

                                           •   30 suites
                                           •   Opened November 2015
                                           •   Unlevered cash yield 8.3%
                                           •   $7.7 million development cost

        Chartwell Le Teasdale Retirement Residence

                                           •   343 suites
                                           •   Opened May 1, 2016
                                           •   Mezzanine loan $5.9 million
                                           •   Development by Batimo Inc.
                                           •   78% leased

making people’s lives BETTER®                                                   20
Building Sustainable Value
                                     2017 Acquisitions
  The Orchards Retirement Residence, Vineland, ON

  107 suites
  $22.0 million purchase price

  Hilldale Retirement Residence, Thunder Bay, ON

  66 suites
  $6.95 million purchase price

                                     2016 Acquisitions
                                              Tiffin House,      Lord Lansdowne, Ottawa, ON
                                              Midland, ON             •   127 suites
                                                                      •   $68.4 million
                                              • 121 suites
                                              • $31.5 million

                                             Wedgewood,
                                            Brockville, ON

                                             • 109 suites       Duke of Devonshire, Ottawa, ON
                                             • $37.1 million          • 105 suites
                                                                      • $63.6 million

                                             Kamloops,
                                          Kamloops, B.C. (1)

                                            • 97 suites
                                            • $11.1 million

    (1) Acquired   the remaining 50% interest from JV partner

making people’s lives BETTER®                                                                    21
Financial Performance

                             Q1 2017 Highlights
•     Same property NOI up $2.2M or 3.5%
•     Same property occupancy remained strong at 93.0%
•     FFO up 4.4% and AFFO up 0.9%

                                                             Increase/
                                       Q1 2017    Q1 2016
                                                            (Decrease)

    Average occupancy – same
                                       93.0%       93.5%     (0.5pp)
    property

    NOI – same property ($ millions)    $63.2      $61.0       $2.2

    FFO ($ millions)                    42.1       40.3        $1.8

    FFO per unit diluted                0.22       0.22         -

    AFFO ($ millions)                   $38.8      $38.5       $0.3

    AFFO per unit diluted               $0.20      $0.21     ($0.01)

    Distributions declared              $27.5      $24.9       $2.6

    Distributions declared per unit     0.14       0.14         -

    making people’s lives BETTER®                                        22
Financial Performance

                     Ontario Retirement Platform

                                Q1 2017              Q1 2016             Increase/(Decrease)
                                                                            $          %
    Same property statistics:

    NOI ($ millions)               $29.9              $28.7              $1.2               4.1%
    Occupancy                   89.6%                89.8%               N/A               (0.2pp)

•   Strong NOI growth driven by rate growth in line with competitive
    market conditions.
•   Growing demand drives new construction activity in select markets.

           100%                              Occupancy
            95%

                                                      89.8%            89.6%    90.0%   89.6%
            90%                              89.2%             89.2%
                   86.9%             87.4%
                           86.3%
            85%

            80%

            75%

            70%
                   Q1 15   Q2 15     Q3 15   Q4 15    Q1 16    Q2 16   Q3 16    Q4 16   Q1 17

making people’s lives BETTER®                                                                        23
Financial Performance

                            Western Canada Platform

                                Q1 2017             Q1 2016             Increase/(Decrease)
                                                                           $          %
    Same property statistics:

    NOI ($ millions)             $11.9               $11.3              $0.6                   5.5%
    Occupancy                   96.2%               94.8%                N/A                   1.4pp

•   Favourable conditions in most of our markets and strong leasing
    activity.
•   Expect to maintain high occupancy and rental rate growth in line with
    competitive market conditions.

                                            Occupancy
            100%
                                                                              96.9%    96.2%
                                                              95.0%   95.8%
                                            94.7%    94.8%
             95%                    93.4%
                    92.1%   92.4%

             90%

             85%

             80%

             75%

             70%
                    Q1 15   Q2 15   Q3 15   Q4 15    Q1 16    Q2 16   Q3 16    Q4 16   Q1 17

making people’s lives BETTER®                                                                          24
Financial Performance

                                 Quebec Platform

                                Q1 2017             Q1 2016             Increase/(Decrease)
                                                                           $          %
    Same property statistics:

    NOI ($ millions)             $15.1               $14.6              $0.5                 3.1%
    Occupancy                   93.3%               94.5%                N/A                 (1.2pp)

•   Strong NOI growth driven primarily by rate growth in line with
    competitive market conditions.
•   New construction activity to meet accelerated demand growth.

                                            Occupancy
            100%

                                            94.7%    94.5%   94.4%   94.6%   94.5%
             95%    92.9%           93.7%                                            93.3%
                            92.6%

             90%

             85%

             80%

             75%

             70%
                    Q1 15   Q2 15   Q3 15   Q4 15    Q1 16   Q2 16   Q3 16   Q4 16   Q1 17

making people’s lives BETTER®                                                                          25
Financial Performance

                            Ontario LTC Platform

                                Q1 2017              Q1 2016             Increase/(Decrease)
                                                                            $          %
    Same property statistics:

    NOI ($ millions)                $6.3              $6.4               ($0.1)               (1.3%)
    Occupancy                   98.0%                98.7%                N/A                 (0.7pp)

•   NOI lower on lower ancillary revenues, operating performance
    continues to be strong.
•   Experienced and dedicated team delivers consistent results.

                                             Occupancy
            100%            98.9%    99.1%   98.9%    98.7%   98.9%   99.0%   98.6%
                    98.0%                                                             98.0%

             95%

             90%

             85%

             80%

             75%

             70%
                    Q1 15   Q2 15    Q3 15   Q4 15    Q1 16   Q2 16   Q3 16   Q4 16   Q1 17

making people’s lives BETTER®                                                                           26
You can also read