FY17 Results Presentation - 28 August 2017 - Metlifecare
←
→
Page content transcription
If your browser does not render page correctly, please read the page content below

FY17 Results Presentation
28 August 2017

Contents

#1   FY17 Results highlights    3

#2   Competitive positioning   11

#3   Development and growth    16

#4   Commercial intensity      20

#5   Risk Management           27

#6   Summary                   32

                                    Please refer to the definitions section on page 44 of the
#7   Financial Performance     34   presentation for additional detail on the non-GAAP financial
                                    measures contained within this presentation. A glossary of
                                    terms used in this presentation is contained on page 46.

#8   Appendices                41

2
FY17 Results Highlights
Section 1
FY17 Results highlights
Record Net Profit After Tax (NPAT) $251.5m, up 10%.
Underlying Profit1 $82.1m, up 24%.
Net Tangible Assets (NTA) per share $6.43, up 21%.
Underlying operating cash flows2 $51.3m, remain strong, up 2%.
Improved Loan to Value ratio3 (LVR) at 4.8%, providing capacity to grow and manage market
changes.
FY17 final dividend of 5.8 cps, up 45%.
1 Underlying profit removes the impact of unrealised fair value movements on investment properties, impairment of property, plant & equipment and excludes one-off gains &
losses and taxation. It is a non-GAAP financial measure and is not prepared in accordance with NZ IFRS.
2 Underlying operating cash flows are statutory operating cash flow per the financial statements less the first time sale of occupation rights agreements (development sales).
4 3 Loan to Value Ratio is total debt (excluding cash on hand) to CBRE investment property valuation as at 30 June 2017 (excluding 50% of Palmerston North Village).
FY17 Results highlights
Significant increase in realised development margin1 23%, up from 13%.
Delivered a record 235 units2 and care beds3 for the year, up 124%.
On track to deliver 233 new units and care beds in FY18.
Achieved a resource consent for Red Beach after balance date with a total of 320 units and care beds.
Added to the land bank securing a site in Botany (East Auckland) adjacent to the Pakuranga Golf
course.
Opened the Greenwich Gardens care home showcasing the “homestead” model.
1 Realised development margin of $19.0m is included in the audited financial statements and the margin percentage is calculated using total developments sales of $82.5m (refer
page 44 for additional details).
5 2 Units includes independent Living Units (ILUs), Independent Living Apartments (ILAs) and Care Apartments or Serviced Apartments.
3 Care Beds includes Hospital beds and or Rest home beds.
FY17 Disclosure
The company is changing the way it reports performance and providing greater detail
and breakdown in certain areas.
Increased disclosure regarding the independent CBRE valuation of villages including providing a
breakdown in the movement in that valuation as well as more detail surrounding individual village
valuations and key assumptions.
Clarified operating cash flows by introducing a new term, Underlying Operating Cash Flows1,
which removes the impact of development sales cash flows from operating cash flows.
Provided additional information on corporate costs and the level of capitalisation of those costs.
Reducing the significance of the non-GAAP measure, Underlying Profit, in future periods due to
the high level of judgment applied and difficulties with consistent reporting across the industry
including:
Judgments applied to the allocation of development costs associated with offices, common
areas and care homes and therefore, likely differences in the way realised development
margin is calculated;
Differences in the recognition of resales and development sales (Metlifecare recognises on a
cash basis, some operators measure on an accrued basis);
Timing differences between accrued DMF (as reported in Underlying Profit) and cash DMF
(as included in operating cash flows); and
Differences between realised development margin and the full impact on future cash flows.
6 1 Underlying operating cash flows are a preferred indicator of operating performance as they include cash DMF, cash realised resale gains
and cash tax paid.
Dividends paid from operating cash The Board is of the view that “underlying operating cash flows1” is the measure the company will use to determine current and future dividend pay-outs. The company will aim to increase dividends yearly while maintaining a dividend payout ratio of 30 to 50% of underlying operating cash flows. Development sales are excluded on the basis they are utilised to repay development debt associated with the construction of new villages and are therefore not available for distribution to shareholders. On completion of development projects any surplus cash available to distribute will be considered at completion. 7 1 Underlying operating cash flows are statutory operating cash flow per the financial statements less the first time sale of occupation right agreements (development sales).
FY17 Final dividend
FY17 FY16
Interim Dividend per share 2.25 1.75
Final Dividend per share 5.8 4.0
Total Dividend per share (cps) 8.05 5.75
The final dividend is un-imputed.
The company will aim for final dividends to
represent 60% of total dividends paid for
future financial years.
The record date for the final dividend is 15
September 2017 and the payment date is 29
September 2017.
The Dividend Reinvestment Plan does not
apply for this dividend.
8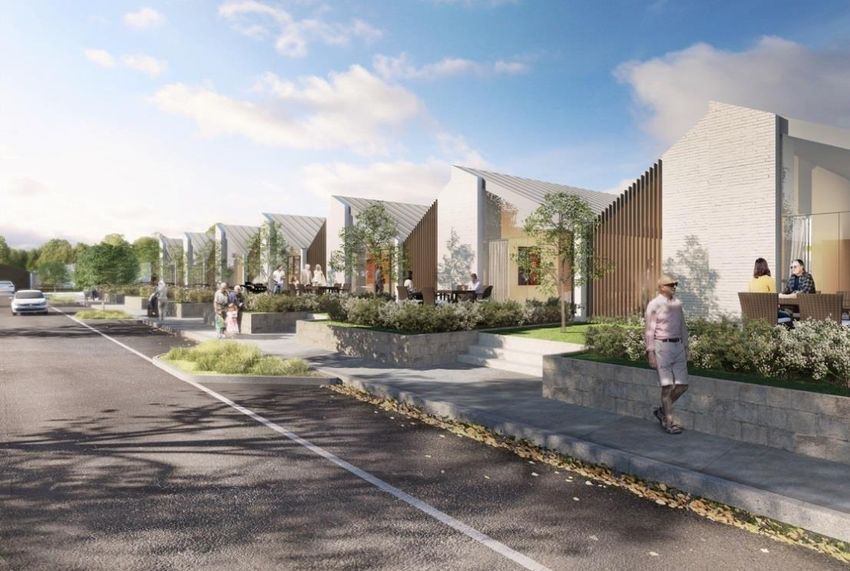
FY17 Portfolio statistics
Care apartments and care beds
represent 18% of the portfolio.
Seven villages are currently
without a care offering and we
have plans to build care at three of
these.
FY17 Portfolio statistics

10
Competitive Positioning
 Section 2

11
Competitive positioning
Strategic focus
Diverse and unique villages underpinned by a high level of
care and service
Villages designed to integrate with their local
communities and enhance resident experience.
Highly engaged and qualified staff.
Comprehensive understanding of existing and future
resident needs.
A significantly enhanced food and dining experience.
Metlifecare residents engaging in 3D printing with The
Resident-directed care which recognises everyone’s Mind Lab by Unitec
needs are different.
Asset management plans
Focus on villages being competitive, marketable and
able to meet future demands and expectations of
residents.
The long term village maintenance plan has been
expanded to a ten year village regeneration programme
- long-term asset plans in place by end 2017.
12
Newly refurbished homeCompetitive positioning
Village enhancement
Village regeneration
Pinesong Manukau apartment block – under construction,
to be completed FY19.
Pakuranga Village - in planning, first stage to be
completed FY20.
New care homes being planned at The Avenues,
Papamoa Beach Village and Oakridge Villas.
Crestwood regeneration being progressed.
Village remediation
Coastal Villas project delivering value with selling prices
on completion of remediated units being approximately
$100k higher.
Initiating remediation work at Waitakere Gardens and
Dannemora Gardens.
Estimated remediation costs of $44.1m over seven years.
13
Pinesong Manukau - Artist impression onlyCompetitive positioning
Outstanding resident experience
Preference drives commercial value
Increased High
Excellent High
customer occupancy +
reputation referrals
satisfaction sales growth
Strengthening Metlifecare’s brand
New branding launched November 2016, spearheaded
by ‘More to Come’ proposition.
Enhanced brand activity.
Unprompted brand awareness up 15% to 52%.
Overall resident satisfaction remains high at 90%,
care satisfaction up 4% to 92%.
Referrals up 2% at 24%.
Village occupancy remains strong at 98%, care
occupancy at 96%.
14Competitive positioning
Outstanding resident experience
Care
Strengthened care proposition with company-wide
establishment of resident-directed care approach.
Completion of new design ‘homestead model’ care home
at Greenwich Gardens.
Increased care resident satisfaction and occupancy (see
page 14).
Greenwich Gardens care home
Food & dining
Food is an essential ingredient of the customer
experience and an opportunity to differentiate from our
competitors, driving referrals and resales.
Simon Gault partnership has enhanced our food offering;
increased capability of our kitchen staff; provided a focal
point with residents and prospects; increased use of
offering and raised company profile and reputation.
15Development & Growth Section 3
Development and growth Record development sales of $82.5m with an average price of $640k per settlement reflecting the investment in higher value villages. 88% increase in realised development margin. Sales volumes slightly lower than FY16 as a result of delivery timing. Total development units not contracted at 30 June 2017: 63 (1.3%). 17
Development and growth
On track to deliver FY18 delivery
targets (233 units, care
apartments and care beds).
254 units, care apartments and
care beds currently under
construction.
Development land bank1 of
1,666 units and care beds.
Secured an additional site at
Botany next to the Pakuranga
golf course which will deliver
another full-continuum village in
Auckland.
Secured resource consent for our
Red Beach village following year
end providing additional
certainty for future unit delivery.
Detailed evaluation of several
other sites to strengthen the
land bank.
18 1 Development land bank above includes some existing units and care beds which will and may be decommissioned and rebuilt to intensify and regenerate villages.Development progress
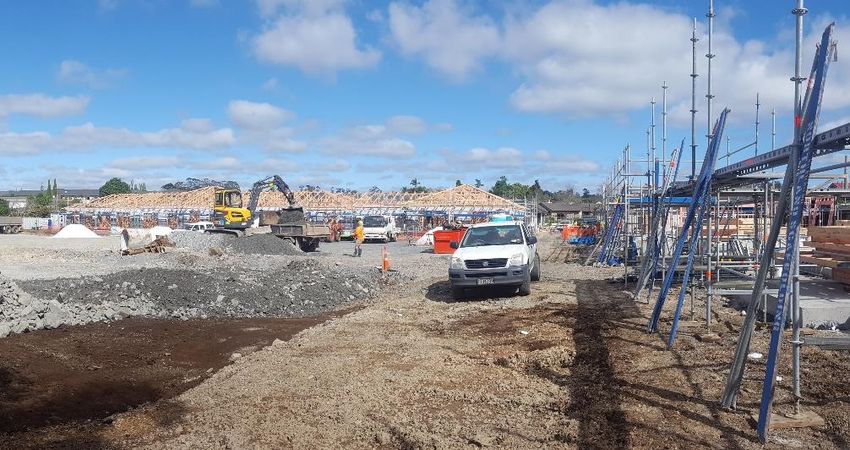
Papamoa Beach Village Somervale care home
19
19 Oakridge Villas development and completionCommercial Intensity Section 4
19% Increase in realised resale gains
*
Occupancy high with current year volume turnover impacted by returns and units held to temporarily
relocate residents for remediation projects (25).
Care home occupancy remained strong at 96% (significantly higher than the national average).
Return volumes in FY17 were lower than in prior years for the period from October 2016 to March
2017 which had an impact on available stock levels and therefore resale volumes.
97 resale units unsold at 30 June 2017.
21 * Resales volumes disclosed above include Palmerston North Village - refer page 44 for additional detail.34% Resale gain The prices of ILU and ILA units sold during the year averaged $565k, a 10% uplift above the CBRE valuation. The average price of Care Apartments sold during the year was $302k with the uplift over the CBRE valuation of 8%. Achieving selling prices above CBRE valuation prices supports the assessment of list prices for the valuation as at 30 June 2017 which drives the fair value movement. 22
55% Increase in resale gain per settlement
Realised resale gains are driven by list price management, unit price inflation and resident tenure.
DMF per settlement up 13%.
Realised resale gains impacted by the age and mix of units returned and settled during the period.
ILUs and ILAs at 76% and Care Apartments at 24%.
ILUs and ILAs average length of stay was 9.3 years and Care Apartments was 3.2 years.
231.5 year increase to age of entry for ILUs and ILAs resales The average age of all residents is 81.7 years, up 0.5 years. Stabilised departing occupancy estimate from CBRE valuation 8.3 years for ILUs and 4.4 years for Care Apartments (CAs). 24
14% increase in investment properties
Movements
Movement ($m)
Resale & Development Sales Activity 118.6
Land & Work in Progress 44.9
CBRE Valuation
Unit Prices 267.7
Discount rates (10.4)
Growth Rates (25.0)
Other changes (31.2)
Total movement in the value of investment properties 364.6
Unit price increases are the primary driver of movement in the value of investment
properties.
CBRE increased discount rates associated with several villages reflecting remediation
activities.
Growth rates in Auckland villages were reviewed and lowered.
Other changes reflect movements in expenses and the recycling profile associated with the
valuation model.
25Embedded value $269k per unit, up 29% Embedded value drives future operating cash flows through realised resale gains and DMF. Embedded value is the difference between the CBRE list price and the resident liability expressed on a per unit basis. Embedded value has built up over the tenure of all residents in the portfolio with older units in stronger growth areas having higher embedded value. 26
Risk Management
Section 5
Conservative Debt Profile
Balance sheet strength:
LVR of 4.8% using CBRE investment
property valuation.
LVR limit currently 35% providing capacity
to increase debt levels subject to
serviceability.
Facility Limits - three tranches totalling $250m.
Debt Maturity - evenly split over the next three
years.
Four bank syndicate.
28Strongly Positioned (interest cover)
Underlying operating cash flows to total
interest paid can be used as a proxy for
interest cover and serviceability of the
debt facilities.
Monitoring and maintaining sufficient
interest cover provides support to
increase borrowing and manage
potential changes to the residential
property market.
29Capital management (debt) The graph above shows $71m of debt (net of cash on deposit) as at 30 June 2017 matched to the current value of development land, development work in progress and completed and unsold units. $193m headroom indicates that the current value of assets covers all debt. This excludes the cost to be incurred to complete current projects which is shown on the following page. 30
Capital management (debt) The graph above shows that the estimated total asset value on completion of current projects of $242m, exceeds the current debt plus estimated costs to complete these projects of $166m indicating headroom of $76m. Ensuring projects can be completed and that value on completion is greater than debt provides reassurance that the overall debt position is covered by the related assets (recycling capital). 31
Summary
Summary
Growth
Development delivery target ACHIEVED
Realised development margin target EXCEEDED
Commercial Intensity
Unit price growth ACHIEVED
Age of entry increased ACHIEVED
Competitive Positioning
Brand relaunched with increased recognition ACHIEVED
Care position strengthened
ACHIEVED
33Financial Performance
FY17 Disclosure
Reported NPAT incorporates the increase in the value of
investment properties which is derived from an
independent valuation of the future cash flow from
Metlifecare’s portfolio but is more variable in nature due
to property price movements.
Reported NPAT also encompasses the full development
impact including costs of common areas, excess cost of
care homes over valuation, future cash flows and
expenses related to new units.
Realised Development Margin is a measure of
development performance however the company’s view
is it should not be attributed to a profit because it
excludes offices, common areas and care home costs all
of which are required for retirement villages.
Realised Development Margin is included in the
audited financial statements and prepared on a
consistent and audited basis every period.
Period to period movements in realised
development margin reflect changes in
development performance and are an indicator of
development outcomes.
35Net profit $251.5m, up 10%
FY17 FY16
Profit & Loss
($m) ($m)
Total revenue 109.1 106.2
Fair value movement of investment property 258.8 237.2
Joint Venture share of profit 2.5 0.4
Expenses (90.2) (92.7)
Resident share of capital gains (9.3) (4.8)
Depreciation, amortisation & impairments (9.2) (2.5)
Finance costs (0.2) (0.1)
Net profit before tax 261.5 243.7
Tax expense (10.0) (15.0)
Net profit after tax 251.5 228.7
Fair value movement driven by increases in portfolio unit prices of 15% across the portfolio.
Support office costs for FY17 were $15.6m with an additional $2.1m capitalised during the period
(FY16 support office costs $16.6m and $1.2m capitalised).
36Underlying profit up 24%
FY17 FY16
Underlying Profit before tax
($m) ($m)
Reported net profit after tax 251.5 228.7
Fair value movement of investment
(258.8) (237.2)
property
Other Income – gain on sale (1.1) -
Loss on Sale – Wairarapa village - 3.0
Impairment on care homes 6.2 -
Tax expense 10.0 15.0
Realised resale gains 55.3 46.5
Realised development margin 19.0 10.1
Underlying profit before tax 82.1 66.1
37Operating cash flows
FY17 FY16
Operating Cash Flow ($m) ($m)
Resident receipts 83.0 87.8
Development sales 82.5 79.5
Resales 163.2 176.9
Resale repurchases (107.9) (130.4)
Payments to suppliers (88.1) (84.1)
GST 1.2 0.3
Interest received 0.2 0.1
Interest paid (0.3) (0.1)
Net operating cash per cash flow
statement 133.8 130.0
Operating cash flow with development
sales & resales split
Realised resale gains 55.3 46.5
Other operating activities (3.7) 4.1
Interest paid (0.3) (0.1)
Underlying operating cash flow 51.3 50.5
Development sales 82.5 79.5
Net operating cash 133.8 130.0
Realised DMF cash for FY17 of $23.9m (FY16 realised cash DMF was $27.5m) included in
Resident receipts above.
38 Maintenance Capex included in investing activities of $14.9m during the year (FY16
$14.3m).NTA per share $6.43, up 21%
FY17 FY16
Balance Sheet ($m) ($m)
Cash & other assets 23.0 25.2
Property plant & equipment 48.2 36.4
Investment properties 2,889.4 2,524.8
Total assets 2,960.6 2,586.4
Payables & other liabilities 49.9 31.3
Bank loans 72.6 80.8
Deferred membership fees 104.6 93.5
Refundable occupation right agreements 1,260.2 1,154.1
Deferred tax liability 103.1 93.7
Total liabilities 1,590.4 1,453.4
Total equity 1,370.2 1,133.0
Net assets per share ($) 6.43 5.32
Total assets and NTA per share increases were driven by the revaluation of investment properties
which are primarily driven by unit price movements, resales activity and completion of retirement
village units.
Refundable occupation right agreements’ liability increased through the resale and development
sales activity.
39Value of investment properties, up 14%
1H17 FY16
Investment Properties ($m) ($m) Movements
Development land 84.5 47.1 37.4
Investment properties under development 36.9 46.3 (9.4)
Completed investment properties 1,398.9 1,181.0 217.9
Total valuation 1,520.3 1,274.4 245.9
Plus: Refundable occupation right agreement
1,577.1 1,437.4 139.7
amounts
Plus: Residents’ share of capital gains 35.2 30.6 4.6
Plus: Deferred Membership Fee 104.6 93.5 11.1
Less: Membership fee receivables (344.4) (307.8) (36.6)
Less: Occupation right agreement receivables (3.4) (3.3) (0.1)
Total investment properties 2,889.4 2,524.8 364.6
Total value of investment properties increased by $364.6m in the current year with 60% of the
uplift relating to the movement in the completed value of investment properties as determined by
the CBRE valuation.
40Portfolio Summary, Definitions, Disclaimer & Glossary
Portfolio summary

42
                         Metlifecare Portfolio: 30 June 2017
Portfolio summary
43
Metlifecare Portfolio: 30 June 2017Definitions
• Underlying operating cash flow excluding development sales removes the cash flows derived from the first time sale of
occupation right agreements (as per page 38) of $82.5m from net cash flow from statutory operating activities in the
financial statements. Development sales cash flows are utilised to repay debt so underlying operating cash flows excluding
development sales is a measure of the free cash flows available.
• Underlying profit removes the impact of unrealised fair value movements on investment properties, impairment of property,
plant & equipment and excludes one-off gains & losses and taxation. It is a non-GAAP financial measure and is not
prepared in accordance with NZ IFRS. Note 2.2 of the Financial Statements has additional detail.
• Realised development margin is the margin obtained on cash settlement of an occupation right agreement following the
development of the unit. The calculation includes construction costs, non-recoverable GST, capitalised interest to the date of
completion, land apportionment at cost, and infrastructure costs but excludes construction costs associated with offices,
common areas and amenities. Margins are calculated based on when a stage is completed. Margins presented above are on
the basis of the settled units during the period. Note 2.2 of the Financial Statements has additional detail.
• Total settlement figures include resale settlements for Metlifecare Palmerston North which under the changes to NZ IFRS 11
in relation to joint venture accounting are excluded when calculating average settlement values in the operational section.
In FY17 resale settlements for Metlifecare Palmerston North were ILU’s 8 and CA’s 19 (FY16 ILU’s 5 and CA’s 7). DMF and
realised resale gains figures exclude resale settlements for Metlifecare Palmerston North when calculating average
settlements.
• Embedded value is calculated by taking the sum of the CBRE unit prices of units across our portfolio, deducting the resident
refundable loan liability as per the balance sheet and company-owned stock items. The embedded value is a combination of
Resale Gains and Deferred Membership Fee receivable. The value of the Deferred Membership Fee receivable is as per note
3.1 of the Financial Statements and the balance is Embedded Resale Gains. The per unit calculations have been adjusted for
the Palmerston North joint venture accounting changes. Embedded value assists readers to understand the potential future
cash flows from Realised Resale Gains & Deferred Membership Fee Receivables.
• Percentages changes refer to movements to the pcp.
44Disclaimer
• The presentation includes non-GAAP financial measures for topics including development sales, resales and occupancy
which assist the reader with issues such as understanding the volumes of units settled during the period and the impact
that development sales and resales during the period had on occupancy as at the end of the period.
• Percentage movements may differ due to rounding.
• The information in this presentation is an overview and does not contain all information necessary to make an
investment decision. It is intended to constitute a summary of certain information relating to the performance of
Metlifecare Limited (“Metlifecare”) for the year ended 30 June 2017. Please refer to the Financial Statements for the year
ended 30 June 2017 that have been simultaneously released with this presentation.
• The information in this presentation does not purport to be a complete description of Metlifecare. In making an
investment decision, investors must rely on their own examination of Metlifecare, including the merits and risks involved.
Investors should consult with their own legal, tax, business and/or financial advisors in connection with any acquisition
of financial products.
• The information contained in this presentation has been prepared in good faith by Metlifecare. No representation or
warranty, expressed or implied, is made as to the accuracy, adequacy or reliability of any statements, estimates or
opinions or other information contained in this presentation, any of which may change without notice. To the maximum
extent permitted by law, Metlifecare, its directors, officers, employees and agents disclaim all liability and responsibility
(including without limitation any liability arising from fault or negligence on the part of Metlifecare, its directors, officers,
employees and agents) for any direct or indirect loss or damage which may be suffered by any person through use of or
reliance on anything contained in, or omitted from, this presentation.
• This presentation is not a product disclosure statement, prospectus, investment statement or disclosure document, or an
offer of shares for subscription, or sale, in any jurisdiction.
45Glossary of terms • Development Sale(s): The first time sale of an ORA (new stock) • Resale: The sale of an ORA where a sale has previously been completed • Realised Resale Gain: The difference between the resale and repurchase of occupation right agreements • ORA: Occupation Right Agreement including ILU’s, ILA’s and Care Apartments/Serviced Apartments • ILU: Independent Living Unit • ILA: Independent Living Apartment • CA: Care Apartment or Serviced Apartment • pcp: Prior Comparable Period • Unit: Independent Living Units, Independent Living Apartments and Care Apartments • DMF: Deferred Membership Fees • CPS: Cents Per Share. 46
You can also read