Fourth Quarter 2016 Earnings Call - February 8, 2017 Genesee & Wyoming Inc - Genesee & Wyoming
←
→
Page content transcription
If your browser does not render page correctly, please read the page content below
Fourth Quarter 2016
Earnings Call
February 8, 2017

Genesee & Wyoming Inc.   1
Forward-Looking Statements
This presentation contains “forward-looking statements” regarding future events and the future performance of

Genesee & Wyoming Inc. that involve risks and uncertainties that could cause actual results to differ materially

from those expressed or forecasted, including, but not limited to, risks related to the operation of our railroads,

severe weather conditions and other natural occurrences, economic, political and market conditions (including

employee strikes or work stoppages), the credit risk of customers and counterparties, customer demand, railroad

network congestion, derailments, currency fluctuations, changes in commodity prices, increased competition in

the relevant market, and others, many of which are beyond our control. The Company refers you to the

documents that it files from time to time with the Securities and Exchange Commission, such as the Company’s

Forms 10-Q and 10-K, which contain additional important factors that could cause its actual results to differ from

its current expectations and from the forward-looking statements discussed during this presentation. Forward-

looking statements speak only as of the date of this presentation or the date they were made. Genesee &

Wyoming Inc. does not undertake, and expressly disclaims, any duty to update any forward-looking statement

contained in this presentation whether as a result of new information, future events or otherwise, except as

required by law.

 Genesee & Wyoming Inc.                                                                                               2
G&W Safety Performance – 2016
•      Industry-leading safety performance for eighth consecutive year
•      50% improvement at Freightliner

Injury Frequency Rate per 200,000 man-hours
G&W and Freightliner through December; others through November
      2.89
                  2.72

                              1.57

                                         1.23
                                                     1.06           1.06        1.02   0.99
                                                                                              0.78      0.73
                                                                                                                     0.57

 FRA Group 2 FRA Group 3      KCS         NS       Class I Avg   Freightliner   CSX    BNSF   UP        G&W         G&W (b)
                                                                     (a)                             Consolidated

    a) Includes Freightliner operations in U.K., Europe and Australia
    b) Excludes Freightliner operations

      Genesee & Wyoming Inc.                                                                                                  3
Transactions and Key Developments
Q4 2016 and Early 2017

1.    Closed Providence & Worcester acquisition (US$126 million)
      in North America
      – Closed on November 1 and shares held in voting trust in Nov./Dec.
      – Consent for control received from Surface Transportation Board in Dec.
      – P&W out of trust on December 31 and start-up in January 2017 consistent
        with acquisition plan

2.    Closed Glencore Rail acquisition (A$1.14 billion) in Australia;
      Concurrent formation of 51.1%-48.9% partnership with Macquarie for
      GWA
      – Closed on December 1 and business performing as expected

3.    Announced acquisition of Pentalver Transport (£87 million)
      from APM Terminals in the United Kingdom
      – Expected to close in April 2017, with competition review pending

Genesee & Wyoming Inc.                                                            4
Transactions and Key Developments
Q4 2016 and Early 2017 (continued)
4.    Write Down of European Assets in Q4 2016 (US$32 million)
      – Includes charge for US$10 million of idle coal wagon leases in the U.K. and US$22
        million impairment of intangible assets from Continental European Intermodal (ERS)
      – For ERS, proposed closure of two offices and discontinuation of open train intermodal
        services from the Netherlands in Q1 2017; subject to mandatory consultation with
        Works Councils in the Netherlands and Germany
      – Continental European intermodal business expected to be reduced to a small,
        sustainable core of Rotterdam Rail Feeding, service from north German deep sea ports,
        and dedicated customer trains

5.    Announced agreement to acquire Heart of Georgia Railroad (HOG)
      in the Southeast United States (terms not disclosed)
      – Tuck-in acquisition that is contiguous with two G&W railroads in Georgia
      – Expect 10,000 carloads and enhanced connection for containers from the Port of
        Savannah, GA to an inland terminal on the HOG

6.    Retirement of G&W Chairman Mort Fuller
      – After 40 years as Chairman of the Board of G&W, Mr. Fuller will retire at the annual
        meeting of shareholders in May 2017

Genesee & Wyoming Inc.                                                                          5
Q4 2016 EPS Results Versus Guidance
• Adjusted Diluted Earnings Per Share (EPS) consistent with guidance,
  excluding take-or-pay benefit

($ in millions, except per share             Q4 2016            Q4 2016        Variance to
amounts)                                      Actual            Guidance        Mid-Point                   Comments
Net Income Attributable to G&W           $          8.9     $         51.0     $      (42.1)
 ERS Impairment and Related                                                                    Restructuring & writedown of
 Costs                                             21.5                                        Continental Europe
 U.K. Coal Railcar Lease                                                                       Excess coal railcars under lease
 Writedown                                          8.6                                        in U.K.
 Corporate Development and
 Related Costs                                     16.2                                        Primarily Australia/GRail
 Restructuring Costs                                1.4                                        Primarily U.K.
 Net Loss on Sale of Assets                         0.8
  Write-off Debt Issuance Costs                     0.8                                        GRail related
Adjusted Net Income Attributable
to G&W (a)                       $                 58.3     $         51.0     $        7.3

Diluted EPS                              $         0.15     $0.85 - $0.90      $      (0.73)
                                                                                               • $0.10 from take-or-pay
                                                                                               • ($0.01) from equity offering
Adjusted Diluted EPS(a)                  $         0.99     $0.85 - $0.90      $      0.12     • $0.02 from acquisitions
(a)   Adjusted Net Income Attributable to G&W and Adjusted Diluted Earnings Per Share (EPS) are non-GAAP financial measures.
      Reconciliations of non-GAAP financial measures accompany this presentation.

      Genesee & Wyoming Inc.                                                                                                      6
Q4 2016 Operating Results Versus Guidance
Operating Income
Q4 2016
Adjusted
Q4 2016 Q4 2016 Q4 2016 Versus
(a)
($ millions) Actual Adjusted Guidance Guidance Comments
• $10 million take-or-pay
North America $83.4 $88.1 ~$76 ~$12
• P&W acquired November 1, 2016
• GRail impact with 51.1% ownership in December
Australia $2.8 $13.9 ~$6 ~$8
• Good cost control
• Continental Europe Intermodal
U.K./Europe ($32.6) $2.5 ~$6 ($3.5)
• U.K. Port Congestion
(a) Adjusted
Operating Income is a non-GAAP financial measure. Reconciliations of non-GAAP financial measures accompany this
presentation.
Genesee & Wyoming Inc. 7North American Operations
Operating Revenues: Q4 2016 vs. Q4 2015
($ millions)
$340
7.9%
$320 $5.2
$2.1 $23.6
$1.3
$5.0
$10.0
$300
$322.2
$280 $298.6
$260
Q4 2015 Take-or-Pay Port Switching Freight Other Providence & Q4 2016
(a) Worcester
(a) Includes change in presentation of revenues from certain port terminal railroad operations that were previously presented net of the
related costs incurred.
Genesee & Wyoming Inc. 8North American Operations Same Railroad Carloads: Q4 2016 vs. Q4 2015 Commodity Change % Comment Agricultural Products 4,000 7.5% Grain Autos & Auto Parts 1,501 24.7% Midwest Chemicals & Plastics (539) (1.2%) Coal & Coke 10,054 19.0% Utility Coal Food & Kindred Products 548 3.6% Lumber & Forest Products (1,332) (3.8%) Truck Competition Metallic Ores (1,228) (20.3%) Alumina Plant Idling and Copper Concentrate Metals 4,146 14.0% Scrap Steel and Slabs Minerals & Stone (3,020) (6.1%) Rock Salt, Frac Sand and Aggregates Petroleum Products (624) (2.3%) Lower NGLs/LPGs Pulp & Paper (3,843) (8.9%) Truck Competition Waste 1,570 15.8% New Contract Other (2,911) (17.2%) Overhead Traffic Total Carloads 8,322 2.1% Genesee & Wyoming Inc. 9
North American Operations
Freight Revenues
Same Railroad Average Revenues Per Carload

                                                               Q4 2016       Q4 2015         Change
 Average Revenues Per Carload                                  $    574     $      583        (1.5%)
                             (a)
 Changes in Commodity Mix                                                                     (0.9%)
 Fuel Surcharge                                                                               (0.8%)
                                                      (b)(c)
 Average Revenues Per Carload (excl. Mix, Fuel, FX)                                           0.2%

(a) Changes in Commodity Mix illustrates changes between commodity groups, not within a commodity group
(b) Average Revenues per Carload impacted by changes in customer mix within Agricultural Products, Coal,
    Metals and Minerals and Stone commodity groups
(c) North American core pricing increased approximately 2%

    Genesee & Wyoming Inc.                                                                                 10
Australian Operations
Operating Revenues: Q4 2016 vs. Q4 2015
($ millions)
$70
11.2%
$60 $1.9
$6.2
$7.0
($5.0)
$2.3
$50
$61.4
$55.2
$40
$30
Q4 2015 Australia FX GRail Other Q4 2016
Mining
Genesee & Wyoming Inc. 11U.K./European Operations
Operating Revenues: Q4 2016 vs. Q4 2015
($ millions)
$180
$160
($21.7)
($28.0)
$140
(17.4%)
($9.4)
$1.7
$161.0 $3.9
($2.5)
$120
$133.0
$100
Q4 2015 FX ERS U.K. Coal New U.K. Other Q4 2016
Business
Genesee & Wyoming Inc. 12Operating Ratio by Geographic Segment
Q4 2016
Adj. vs. Q4
Q4 2016 Q4 2015 Q4 2016 Q4 2015 2015 Adj.
Actual Actual Adjusted(a) Adjusted(a) Variance Comments
• $10 million take-or-pay
North America 74.1% 75.5% 72.7% 75.2% 250 bps
• Expect 73% - 74% in 2017
• GRail benefit with 51.1%
ownership in December
Australia 95.4% 81.0% 77.4% 80.1% 270 bps • Loss of SI Fixed Fee
• Expect ~76% in 2017 with
full year GRail
• U.K. Port Congestion
• Continental Europe
U.K./Europe NM 93.2% 98.1% 94.3% (380 bps)
Intermodal
• Expect ~95% in 2017
(a) Adjusted
Operating Ratio is a non-GAAP financial measure. Reconciliations of non-GAAP financial measures accompany this
presentation.
Genesee & Wyoming Inc. 13Introduction to 2017 Guidance
1. Consolidated G&W Guidance
– Pre-tax income growth of 8% - 10% in 2017 (selected metric excludes Short Line Tax
Credit which expired Dec. 31, 2016)
– Free cash flow expected to be US$278 million in 2017(a)
– US$500 million of capacity under revolving credit facility and projected Net Adjusted
debt/Adjusted EBITDA(a) of 2.5x at G&W parent level at year-end 2017 (assuming no
acquisitions)
2. North America
– Cautious customer outlook, but growing confidence in improving macro-economic
environment in the United States
– Potential U.S. tax and infrastructure policies important to G&W in 2017: corporate tax
reform as well as public-private partnerships for infrastructure investment (such as
Short Line Tax Credit)
(a) Free
Cash Flow, Net Adjusted Debt and Adjusted EBITDA are non-GAAP financial measures. Reconciliations of non-GAAP financial
measures accompany this presentation.
Genesee & Wyoming Inc. 14Introduction to 2017 Guidance (continued)
3. Australia
– Improving commodity prices, strong grain harvest in South Australia and
expanded presence in New South Wales underpin improving outlook
– Sale process for Australian customer, Arrium, still underway
4. U.K./Europe
– United Kingdom: improving outlook due to: i) intermodal: working with ports
and shipping lines to improve container flows, ii) heavy haul: new customers
and positioning for infrastructure project growth, iii) further cost reductions
beyond coal business and iv) Pentalver integration
– Poland: Aggregate shipments returning to normal with road construction
projects underway
– ERS/Continental Europe: Subject to consultation with Works Councils,
expected restructuring to sustainable core by mid-2017
Genesee & Wyoming Inc. 15Priorities for 2017 1. Safety 2. Commercial Development (all three geographic segments) 3. Acquisition Integration (P&W, GRail, Pentalver, HOG) 4. U.K./Europe Turnaround 5. U.S. Public Policy - Tax and Infrastructure 6. Active Evaluation of Acquisitions and Investments Genesee & Wyoming Inc. 16
Accounting Impact of GRail Transaction
•    G&W consolidates 100% of Australian Operations and reports a noncontrolling interest for
     MIRA’s 48.9% equity ownership
•    Free Cash Flow Attributable to G&W reflects a reduction for distributions to MIRA (i.e., in
     guidance these are estimates only)(a)

                                                   Example (Illustrative Purposes)
                               Income Statement                                            Free Cash Flow

               Operating Revenues                    $    290                Net Income                       $     10
                                                                             D&A                                    62
               Operating Expenses                         220                Deferred Income taxes                   5
               Operating Income                            70                Working Capital
                                                                             Cashflows from Operations        $     77
               Net Interest Expense*                      (55)
               Income Before Taxes                         15
               Provision for Taxes                         (5)
               Net Income                            $     10                Less: Sustaining Capital              (22)
               Less: Net Income
               Attributable to                                               Free Cash Flow Before New
               Noncontrolling Interest                      (5)              Business Investments             $     55
                                                                             New Business Investments                (9)
               Net Income Available to
               Common Stockholders                   $      5                Free Cash Flow                   $     46

               Diluted EPS                           $   0.08                                                                See Slide 26
               Diluted Shares (millions)                 63.2           Free Cash Flow Attributable to G&W    $     24
                                                                        Free Cash Flow Attributable to MIRA   $     22
               *Includes Shareholder Loans

(a) Free   Cash Flow is a non-GAAP financial measure. Reconciliations of non-GAAP financial measures accompany this presentation.

    Genesee & Wyoming Inc.                                                                                                                  17
2008 Guidance
2017 Guidance(a)
• Revenues: $2,120 - $2,180 million
• Operating Ratio(b): ~80%
• Net Interest Expense: ~$105 million
• Depreciation and Amortization: ~$267 million
(incl. Equity Comp. Amortization)
• Tax Rate (no Short Line Tax Credit): ~38%
• MIRA Noncontrolling Interest: $4 - $6 million
• Diluted EPS(b): $3.10 - $3.30
• Diluted Shares: 63.2 million
• Free Cash Flow ~$278 million
Attributable to G&W(b)(c):
(a) Australia is 51.1% owned, but fully consolidated in G&W financial statements, with noncontrolling interest recorded for 48.9%
of Australia not owned.
(b) Does not reflect impact of integration, restructuring and related expenses.
(c) Free Cash Flow Attributable to G&W is a non-GAAP financial measure. Reconciliations of non-GAAP financial measures
accompany this presentation.
Genesee & Wyoming Inc. 18North American Operations
Operating Revenues: 2017 Guidance vs. 2016
($ millions)
$1,300
$1,275
$30
$1,250
$5
$10 $1,280
($7)
$10
$1,225 ($5)
$1,237
$1,200
2016 Net Take-or- Coal Minerals & Agricultural Other Providence & 2017
Pay Benefit Stone Products Worcester Guidance (a)
2016
(a) Reflects mid-point of 2017 guidance.
Genesee & Wyoming Inc. 19North American Operations
Operating Income: 2017 Guidance vs. 2016
($ millions)
$350
$8
$325
($7)
$18
$338
($8)
$327
$300
Adjusted 2016 (a) Net Take-or-Pay Net Fuel (b) Freight Providence & 2017 Guidance (c)
Benefit 2016 Growth/Other Worcester
(a) Adjusted Operating Income is a non-GAAP financial measure. Reconciliations of non-GAAP financial measures accompany this
presentation.
(b) Net impact of higher fuel prices net of higher fuel surcharges. 2017 Guidance assumes DOE diesel price of $2.59 per gallon.
Threshold of core G&W fuel surcharge program is DOE diesel of $2.60 per gallon (i.e., recovery commences at $2.60).
(c) Reflects mid-point of 2017 guidance. Does not reflect approximately $2 - $3 million of expected integration and related expenses.
Genesee & Wyoming Inc. 20Australian Operations (2017 = 51.1% owned; 2016 = 100% owned)
Operating Revenues: 2017 Guidance vs. 2016
($ millions)
$300
$275
$67
$250
$290
$225 $2
($12) $5
$5
$223
$200
2016 FX Mining(a) Intermodal Agricultural GRail/Other 2017 Guidance
Products (b)
(a) Includes Southern Iron (SI) Fixed Fee payment in Q1 2016 and customer one-time stockpile move in Q2 2016.
(b) Reflects mid-point of 2017 guidance.
Genesee & Wyoming Inc. 21Australian Operations (2017 = 51.1% owned; 2016 = 100% owned)
Operating Income: 2017 Guidance vs. 2016
($ millions)
$75
$65
$55
$35
$70
$45
($7)
$35
$42
$25
Adjusted 2016 (a) Same Railroad GWA, net GRail/Other 2017 Guidance (b)
(a) Adjusted Operating Income is a non-GAAP financial measure. Reconciliations of non-GAAP financial measures accompany this
presentation.
(b) Reflects mid-point of 2017 guidance. Does not reflect approximately $2 - $3 million of expected integration and related expense.
Note: Arrium remains under control of Administrators and sale process continues.
Genesee & Wyoming Inc. 22U.K./European Operations
Operating Revenues: 2017 Guidance vs. 2016
($ millions)
$600
$550
$100
($45)
$500
$580
($30)
$10
$542
($7) $10
$450
$400
2016 FX Continental Coal U.K. Aggregates Pentalver 2017
Europe Intermodal (9 mos) Guidance (a)
(a) Reflects mid-point of 2017 guidance.
Genesee & Wyoming Inc. 23U.K./European Operations
Operating Income: 2017 Guidance vs. 2016
($ millions)
$30
$5
($6)
$8
$20
$5 ($3)
$25
$10
$10
$2
($1)
$5
$0
Adjusted FX U.K. Coal Continental U.K. Aggregates D&A Other Pentalver 2017
2016 (a) Post Restr., Europe Intermodal (9 mos) Guidance (b)
net Intermodal
(a) Adjusted Operating Income is a non-GAAP financial measure. Reconciliations of non-GAAP financial measures accompany this
presentation.
(b) Reflects mid-point of 2017 guidance. Does not reflect approximately $3 - $4 million of expected restructuring expense, primarily
related to ERS Continental Europe. Currently exploring opportunities to redistribute leased locomotives and railcars.
Genesee & Wyoming Inc. 242017 Capital Expenditures
2017 Same
Same Railroad
(in millions) 2017 Railroad 2016 Change Comments
Major Renewals &
Improvements Capital
Track and Bridge Upgrade (Central
and Northeast), Erosion Control
Track and Structure $124 $119 $109 ($10) Program (Australia)
Equipment Overhauls (U.K. and
Equipment 57 53 39 (14) Australia), PTC (North America)
Other 14 12 10 (2)
Subtotal - Core $195 $184 $158 ($26)
Grant Matching 18 15 9 (6)
Subtotal - Core + Grant Matching $213 $199 $167 ($32)
$9 million Track Upgrade for new
business (late 2017) and $11 million
Lease Buyouts in North America (late
2017), $8 million for U.K.
New Business and Investments 39 34 25 (9) Maintenance Facilities in 2016
(a)
Total Capital Expenditures $252 $233 $192 ($41)
(a) 2017 Capital is net of $61 million of funding from government grants (requiring match of $18 million).
2016 Capital was net of $21 million of funding from government grants (requiring match of $9 million).
Genesee & Wyoming Inc. 252017 Free Cash Flow(a)
Guidance
(in millions) 2017
Net Income $ 207
Plus:
Depreciation and Amortization 249
Option and Restricted Stock Amortization 18
Deferred Taxes 78
Changes in Working Capital/Other TBD
Operating Cash Flow $ 552
Less: Capital Expenditures (213)
Plus: Asset Sales TBD
Plus: Prior Year Grant Payments TBD
Less: Current Year Grant Delays TBD
Investing Cash Flows Before New Bus. Investments $ (213)
Free Cash Flow Before New Bus. Investments $ 339
Less: New Business Investments (b) (39)
Free Cash Flow $ 300
Estimated Distributions to noncontrolling interest (MIRA 48.9% of GWA) (22)
Free Cash Flow Attributable to G&W $ 278
(a) Free Cash Flow is a non-GAAP financial measure. Reconciliations of non-GAAP financial measures accompany this presentation.
(b) New Business Investments includes approximately $9 million of Australian operations investments.
Genesee & Wyoming Inc. 26Guidance – First Quarter 2017
(February 8, 2017)
Consolidated
Q1 2017
(in millions, except per share amounts) North America Australia U.K./Europe Guidance
Operating Revenues ~$320 ~$72 ~$123 ~$515
(a)
Operating Ratio ~76% ~78% ~99% ~82%
(a)
Operating Income ~$78 ~$16 ~$1 ~$95
Net Interest Expense ~$27
(b)
Depreciation and Amortization $42 $16 $7 $65
Effective Tax Rate ~40%
Diluted EPS Attributable to G&W(c) ~$0.65
Diluted Shares 63.0
(a) Does not reflect impact of integration, restructuring and related expenses.
(b) Includes amortization of non-cash equity compensation expense of $4 million and D&A of $61 million.
(c) Reflects approximately $1.0 million from 48.9% MIRA noncontrolling interest in GWA.
FX: A$1.00 = US$0.75, C$1.00 = US$0.75, €1.00 = US$1.06, £1.00 = US$1.23, PLN1.00 = US$0.24
Genesee & Wyoming Inc. 27Balance Sheet
• Net Debt(a) of $2.3 billion and Net Adjusted Debt(b) of $2.4 billion at December 31, 2016
• 3.1x Net Adjusted Debt/Adjusted EBITDA(b)(c) at December 31, 2016
• Leverage metrics reflect G&W Debt and EBITDA from North America and U.K./Europe Only
($ in millions) 12/31/2016
Cash & Equivalents $ 32
Debt:
G&W Senior Secured Credit Facility, due March 2020 $ 1,635
Australian Senior Secured Credit Facility, due December 2021 (d) 499
Australian Subordinated Shareholder Loan, due December 2026 (d)(e) 172
Other Debt 53
TOTAL DEBT $ 2,359
Total Equity $ 3,187
TOTAL CAPITALIZATION $ 5,546
Debt/Total Capitalization 43%
Net Debt/Total Capitalization 42%
(a) Net Debt is calculated as Total Debt less Cash and Equivalents.
(b) Net Adjusted Debt and Adjusted EBITDA are non-GAAP financial measures. Reconciliations of non-GAAP financial measures
accompany this presentation.
(c) Based on G&W credit facility covenant requirements which includes debt and EBITDA attributable to North American and
U.K./European operations only, as well as any cash distributions received from Genesee and Wyoming Australia (GWA).
(d) The Australian Operations have a standalone credit agreement non-recourse to G&W and MIRA. Expected leverage as of
12/31/2017 of 3.8x Debt/EBITDA.
(e) Shareholder loan from MIRA used to fund a portion of its initial contribution to GWA. G&W has matching shareholder loan that is
eliminated in consolidation.
Genesee & Wyoming Inc. 28Genesee & Wyoming Inc. 29
Supporting Information for 2017 Guidance
  (February 8, 2017)
                                                                                                                Consolidated
($ millions)                                 North America                  Australia        U.K./Europe           G&W

Revenues                                      $1,270 - $1,290              $280 - $300        $570 - $590       $2,120 - $2,180

Operating Ratio(a)                               73% - 74%                        ~76%           ~95%               ~80%

Operating Income(a)                             $325 - $350                  $65 - $75          $20 - $30        $410 - $455

Depreciation and Amoritzation(b)                    $172                          $62             $33               $267

2017 Carload Volume                                   3%                          NM               4%                17%

2017 Same Railroad Volumes                            1%                          8%               4%              2% - 3%

Freight Pricing                                 2.0% - 2.5%                fixed/variable         Flat
                                                                                            £1.00 = US$1.23
FX                                           C$1.00 = US$0.75          A$1.00 = US$ 0.75    €1.00 = US$1.06

Q1 2017 Carload Volumes                      405,000 - 420,000          150,000 - 155,000   270,000 - 280,000
Same RR % Change versus prior
year                                              3% - 7%                    8% - 19%          7% - 11%

(a) Does not reflect impact of integration, restructuring and related expenses.
(b) Includes $18 million of non-cash equity compensation expense.

      Genesee & Wyoming Inc.                                                                                                      30
2017 G&W Diluted Earnings per Share Profile
($ per share)
$4.00
$3.65
$0.50
$3.00
Short Line
$2.00 Tax Credit
impact in
$3.20 2016
$3.15
$1.00
$0.80 $0.90 $0.85
$0.65
$0.00
Q1 2017 Q2 2017 Q3 2017 Q4 2017 2017E (a) 2016 (b)
- Seasonally Weak Pentalver Seasonal Strengthening
- ERS Loss
(a) Reflects mid-point of 2017 guidance.
(b) Adjusted Diluted EPS is a non-GAAP financial measure. Reconciliations of non-GAAP financial measures accompany this presentation.
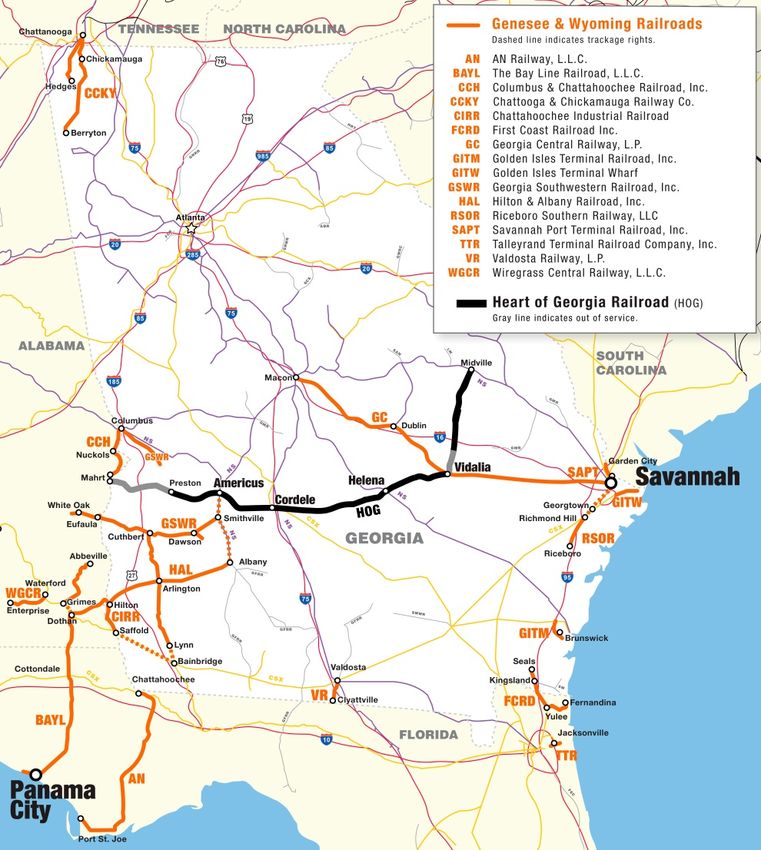
Genesee & Wyoming Inc. 31Heart of Georgia Acquisition (HOG)
• Contiguous to two G&W railroads in South
Georgia: Georgia Central (GC) and Georgia
Southwestern
• 219 total miles, leased from Georgia
Department of Transportation
• Approximately 10,000 total carloads including
daily service between the Port of Savannah
and an inland intermodal terminal in Cordele,
GA for auto parts imports and agricultural
products exports with GC, as well as lumber,
agricultural products and fertilizer customers
• Expected to close in 2nd quarter of 2017
following STB approval
Genesee & Wyoming Inc. 32Genesee & Wyoming Inc. 33
Reconciliation of Non-GAAP Financial Measures

 Genesee & Wyoming Inc.                         34
Non-GAAP Financial Measures
This presentation contains references to Adjusted Net Income Attributable to G&W, Adjusted Diluted Earnings
Per Common Share Attributable to G&W (EPS), Adjusted Operating Income, Adjusted Operating Ratio, Free
Cash Flow, and Net Adjusted Debt to Adjusted Earnings Before Interest, Taxes, Depreciation and Amortization
(EBITDA, which are “non-GAAP financial measures” as this term is defined in Item 10(e) of Regulation S-K
under the Securities Act of 1933 and the Securities Exchange Act of 1934 and Regulation G under the Securities
Exchange Act of 1934. In accordance with these rules, G&W has reconciled these non-GAAP financial measures
to their most directly comparable U.S. GAAP measures.

Management views these non-GAAP financial measures as important measures of G&W’s operating
performance or, in the case of Free Cash Flow, an important financial measure of how well G&W is managing its
assets and a useful indicator of cash flow that may be available for discretionary use by G&W. Management also
views these non-GAAP financial measures as a way to assess comparability between periods. Key limitations of
the Free Cash Flow measure include the assumptions that G&W will be able to refinance its existing debt when it
matures and meet other cash flow obligations from financing activities, such as principal payments on debt.

These non-GAAP financial measures are not intended to represent, and should not be considered more
meaningful than, or as an alternative to, their most directly comparable GAAP measures. These non-GAAP
financial measures may be different from similarly-titled non-GAAP financial measures used by other companies.

The following tables set forth reconciliations of each of these non-GAAP financial measures to their most directly
comparable GAAP measure (in millions, except percentages and per share amounts).

       Genesee & Wyoming Inc.                                                                                        35
Adjusted Net Income and Adjusted Diluted EPS
Net Income Diluted EPS
Income Before Provision for Attributable to Attributable to
Three Months Ended December 31, 2016 Income Taxes Income Taxes G&W G&W
As reported $ 28.7 $ 19.8 $ 8.9 $ 0.15
Add back certain items:
ERS impairment and related costs 21.5 - 21.5 0.37
U.K. coal railcar leases 10.5 1.9 8.6 0.15
Corporate development and related costs 19.2 3.0 16.2 0.28
Restructuring costs 1.9 0.4 1.4 0.02
Net loss on sale of assets 1.1 0.3 0.8 0.01
Write-off debt issuance costs 2.2 0.7 0.8 0.01
As adjusted $ 85.1 $ 26.1 $ 58.3 $ 0.99
Genesee & Wyoming Inc. 36Adjusted Net Income and Adjusted Diluted EPS
Net Income Diluted EPS
Income Before Provision for Attributable to Attributable to
Twelve Months Ended December 31, 2016 Income Taxes Income Taxes G&W G&W
As reported $ 215.5 $ 74.4 $ 141.1 $ 2.42
Add back certain items:
Corporate development and related costs 26.6 5.2 21.4 0.37
Net loss on sale of assets 0.1 - - -
Australia impairment and related costs 21.1 4.4 16.8 0.29
ERS impairment and related costs 21.5 - 21.5 0.37
U.K. coal railcar leases 10.5 1.9 8.6 0.15
Restructuring costs 8.2 1.7 6.5 0.11
Write-off debt issuance costs 2.2 0.7 0.8 0.01
Net loss on sale of assets 0.1 - - -
Impact of reduction in U.K. effective tax rate - 4.3 (4.3) (0.07)
As adjusted $ 305.7 $ 92.5 $ 212.4 $ 3.65
2016 Short line tax credit - 28.8 (28.8) (0.50)
As adjusted excluding the 2016 short line tax credit $ 305.7 $ 121.4 $ 183.6 $ 3.15
Genesee & Wyoming Inc. 37Adjusted Operating Income and Adjusted
Operating Ratio – by Segment
North American Australian U.K./European
Three Months Ended December 31, 2016 Operations Operations Operations Total
Operating revenues $ 322.2 $ 61.4 $ 133.0 $ 516.5
Operating expenses 238.8 58.5 165.6 463.0
Operating income/(loss) (a) $ 83.4 $ 2.8 $ (32.6) $ 53.6
(b)
Operating ratio 74.1% 95.4% 124.5% 89.6%
Operating expenses $ 238.8 $ 58.5 $ 165.6 $ 463.0
ERS impairment and related costs - - (21.5) (21.5)
U.K. coal railcar leases - - (10.5) (10.5)
Corporate development and related costs (4.0) (10.7) (1.3) (16.0)
Restructuring costs (0.1) - (1.8) (1.9)
Net loss on sale of assets (0.6) (0.3) (0.1) (1.1)
Adjusted operating expenses 234.1 47.5 130.5 412.1
Adjusted operating income $ 88.1 $ 13.9 $ 2.5 $ 104.5
Adjusted operating ratio 72.7% 77.4% 98.1% 79.8%
(a) Operating income/(loss) is calculated as operating revenues less operating expenses.
(b) Operating ratio is calculated as operating expenses divided by operating revenues.
Genesee & Wyoming Inc. 38Adjusted Operating Income and Adjusted
Operating Ratio – by Segment
North American Australian U.K./European
Twelve Months Ended December 31, 2016 Operations Operations Operations Total
Operating revenues $ 1,236.8 $ 222.6 $ 542.2 $ 2,001.5
Operating expenses 917.2 217.8 576.9 1,711.9
(a)
Operating income/(loss) $ 319.6 $ 4.8 $ (34.7) $ 289.6
(b)
Operating ratio 74.2% 97.8% 106.4% 85.5%
Operating expenses $ 917.2 $ 217.8 $ 576.9 $ 1,711.9
ERS impairment and related costs - - (21.5) (21.5)
U.K. coal railcar leases - - (10.5) (10.5)
Australia impairment and related costs - (21.1) - (21.1)
Corporate development and related costs (7.2) (14.7) (1.5) (23.3)
Restructuring costs (0.9) (0.8) (6.5) (8.2)
Net loss on sale of assets 0.2 (0.3) 0.1 (0.1)
Adjusted operating expenses 909.3 180.8 537.0 1,627.2
Adjusted operating income $ 327.4 $ 41.8 $ 5.1 $ 374.3
Adjusted operating ratio 73.5% 81.2% 99.1% 81.3%
(a) Operating income/(loss) is calculated as operating revenues less operating expenses.
(b) Operating ratio is calculated as operating expenses divided by operating revenues.
Genesee & Wyoming Inc. 39Adjusted Operating Income and Adjusted
Operating Ratio – by Segment (cont.)
North American Australian U.K./European
Three Months Ended December 31, 2015 Operations Operations Operations Total
Operating revenues $ 298.6 $ 55.2 $ 161.0 $ 514.9
Operating expenses 225.4 44.7 150.1 420.2
(a)
Operating income $ 73.2 $ 10.5 $ 10.9 $ 94.6
(b)
Operating ratio 75.5% 81.0% 93.2% 81.6%
Operating expenses $ 225.4 $ 44.7 $ 150.1 $ 420.2
Corporate development and related costs (1.2) (0.5) (0.9) (2.5)
Net gain on sale of assets 0.3 - - 0.3
Out of period benefit of final allocation of fair
values to Freightliner's assets & liabilities - - 2.6 2.6
Adjusted operating expenses $ 224.6 $ 44.2 $ 151.9 $ 420.6
Adjusted operating income $ 74.1 $ 11.0 $ 9.1 $ 94.2
(c)
FX 0.1 0.4 (2.0) (1.5)
Adjusted operating income excluding FX $ 74.2 $ 11.4 $ 7.2 $ 92.7
Adjusted operating ratio 75.2% 80.1% 94.3% 81.7%
(a) Operating income is calculated as operating revenues less operating expenses.
(b) Operating ratio is calculated as operating expenses divided by operating revenues.
(c) Foreign Exchange (FX) impact is calculated by comparing the prior period results translated from local currency to
U.S. dollars using current period exchange rates to the prior period results in U.S. dollars as reported.
Genesee & Wyoming Inc. 40Free Cash Flow
2017
Twelve Months Ended December 31, (Guidance)
Net cash provided by operating activities $ 552
Net cash used in investing activities (252)
Free cash flow 300
Distributions to noncontrolling interest (22)
Free cash flow attributable to G&W $ 278
Genesee & Wyoming Inc. 41Free Cash Flow – Australian Operations
2017
Twelve Months Ended December 31, (Guidance)
Net cash provided by operating activities $ 77
Net cash used in investing activities (31)
Free cash flow 46
Distributions to noncontrolling interest (22)
Free cash flow attributable to G&W $ 24
Genesee & Wyoming Inc. 42Net Adjusted Debt/Adjusted EBITDA
Less: Australian
Twelve Months Ended December 31, 2016 Total G&W Operations (a) Adjustments (b) Acquisitions (c) Adjusted
Net income attributable to G&W $ 141.1 $ (10.8) $ - $ 151.9
Add back:
Provision for income taxes 74.4 1.0 - 73.4
Interest expense 75.6 14.2 1.0 62.5
Depreciation and amortization expense 205.2 30.9 - 174.3
EBITDA $ 496.4 $ 35.3 $ 1.0 $ 26.2 $ 488.3
Add back certain items
Non-cash compensation cost related to
equity awards 17.9 0.6 - 17.2
Impairment and related costs 53.1 21.1 (2.6) 29.3
Corporate development and related costs 23.3 14.7 (6.3) 2.3
Restructuring costs 8.2 0.8 - 7.4
Net loss/(gain) on sale of assets 0.1 0.3 - (0.3)
Adjusted EBITDA $ 544.3
Total debt $ 2,359 $ 659 $ 5 $ 1,705
Less: Cash 32 9 - 23
Net debt $ 2,327 $ 650 $ 5 $ 1,682
Add back: Deferred financing fees 33 14 - 19
Net adjusted debt $ 2,360 $ 664 $ 5 $ 1,701
Net adjusted debt/Adjusted EBITDA ratio 3.1 : 1.0
(a) Australia Operations are excluded from G&W's Senior Secured Syndicated Credit Facility Agreement.
(b) Adjustments based on Credit Facility Agreement.
(c) Includes P&W for 1/1/16 - 10/31/16 and GRail for 1/1/16 - 11/30/16.
Genesee & Wyoming Inc. 43Net Adjusted Debt/Adjusted EBITDA
Twelve Months Ended December 31, 2017 Less: Australian Acquisitions/
(Guidance) Total G&W Operations (a) Adjustments (b) Adjusted
Net income attributable to G&W $ 202 $ 6 $ - $ 196
Add back:
Provision for income taxes 127 5 - 122
Interest expense 105 55 - 50
Depreciation and amortization expense 249 61 - 188
EBITDA $ 683 $ 127 $ 38 $ 594
Add back certain items
Non-cash compensation cost related to equity awards 18 1 - 17
Adjusted EBITDA $ 611
Total debt $ 2,184 $ 674 $ 5 $ 1,515
Less: Cash 25 5 - 20
Net debt $ 2,159 $ 669 $ 5 $ 1,495
Add back: Deferred financing fees 24 11 - 13
Net adjusted debt $ 2,183 $ 680 $ 5 $ 1,508
Net adjusted debt/Adjusted EBITDA ratio 2.5 : 1.0
(a) Australia Operations are excluded from G&W's Senior Secured Syndicated Credit Facility Agreement.
(b) Adjustments based on Credit Facility Agreement.
Genesee & Wyoming Inc. 44Net Adjusted Debt/Adjusted EBITDA
Twelve Months Ended December 31, 2017 Australian
(Guidance) Operations
Net income $ 10
Add back:
Provision for income taxes 5
Interest expense 55
Depreciation and amortization expense 61
EBITDA $ 131
Add back certain items
Non-cash compensation cost related to equity awards 1
Adjusted EBITDA $ 132
Total debt $ 674
Less: Cash 5
Net debt $ 669
Less: Shareholder loan 179
Add back: Deferred financing fees 11
Net adjusted debt $ 501
Net adjusted debt/Adjusted EBITDA ratio 3.8 : 1.0
Genesee & Wyoming Inc. 45Genesee & Wyoming Inc. 46
You can also read