2020 Half Year Results Presentation - TI Fluid Systems plc 18 August 2020 - TI Fluid Systems ...
←
→
Page content transcription
If your browser does not render page correctly, please read the page content below

2020 Half Year Results Presentation
TI Fluid Systems plc
18 August 2020

Disclaimer
This presentation contains certain forward-looking statements with respect to
the financial condition, results of operations and business of TI Fluid Systems
plc (the “Company”). The words “believe”, “expect”, “anticipate”, “intend”,
“estimate”, “forecast”, “project”, “will”, “may”, “should” and similar expressions
identify forward-looking statements. Others can be identified from the context
in which they are made. By their nature, forward-looking statements involve
risks and uncertainties, and such forward-looking statements are made only
as of the date of this presentation. Accordingly, no assurance can be given
that the forward-looking statements will prove to be accurate and you are
cautioned not to place undue reliance on forward-looking statements due to
the inherent uncertainty therein. Past performance of the Company cannot be
relied on as a guide to future performance. Nothing in this presentation should
be construed as a profit forecast.
The financial information in this presentation does not contain sufficient detail
to allow a full understanding of the results of the Company. For more detailed
information, please see the half year results announcement for the six months
ended 30 June 2020.

                                                                                     2
Agenda

         1   Key Highlights for H1 2020 – Bill Kozyra

         2   Financial Performance – Ron Hundzinski

         3   Q&A

                                                        3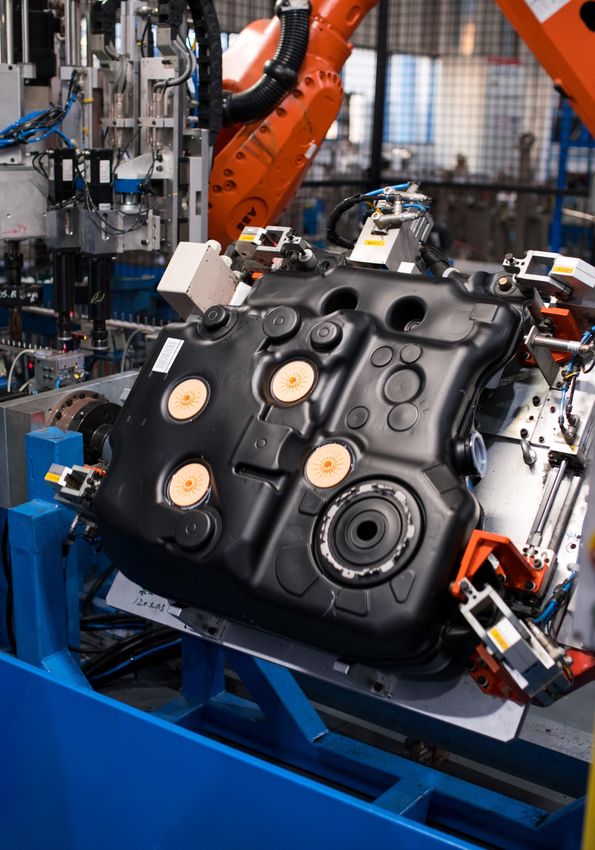
Key Highlights – Bill Kozyra

                               4
Key Investment Propositions

 Experienced management           Demonstrated above-            Significant growth         Strong revenue growth,
  team with proven track       market growth with leading     opportunities aligned with   superior margins and free
record of strong growth and   technologies, strong market      electrification and TI’s      cash flow generation
   financial performance        positions, global low cost       strength in thermal
                                footprint (including China          management
                              strength) and diversification

                   Sustainable business model – ‘doing what we said we would do’

                                                                                                                       5
Key Highlights – 2020 Half Year Results
First half results remained solid despite impact of significantly lowered global light vehicle production environment as a result of the COVID-19
pandemic
Revenue continuing to outperform underlying global light vehicle production
• 2.5% outperformance above global light vehicle production volume decline of 33.2% versus prior year
Flexible cost structure with cost savings and cash preservation measures offsets adverse market – maintaining positive EBIT margin
(a)
• 2.3% Adj. EBIT margin
Steady and positive Adj. Free Cash Flow
(b)
• €35 million in H1 2020
Initiated major restructuring of the Group’s manufacturing capacity and fixed cost base – positioning for new volume reality
An asset impairment charge of €304.6 million taken to address likelihood of a prolonged reduction of global light vehicle production volumes – non-
cash charge to goodwill, intangible and tangible fixed assets impacting PPA of 2015 Bain purchase of TI Automotive
Focus on highly engineered fluid storage, carrying and delivery systems for light vehicles
• Continuing to win thermal products and systems with key customers for global and regional BEV
• Collaborating with key OEMs on advanced lightweight and integrated fluid modules and systems
• Leading technology in pressure resistant fuel tanks leading to new HEV business awards
a) Adj. EBIT defined as Adj. EBITDA less depreciation (including PP&E impairment) amortisation (including intangible impairment) arising on tangible and intangible assets before
adjusting for any purchase price adjustments to fair values arising on acquisitions
b) Adj. Free Cash Flow defined as cash generated from operating activities, less cash used by investing activities, adjusted for acquisitions, movements in financial assets at fair value
through the profit or loss, cash payments related to IPO costs and cash received on settlement of derivatives and restructuring cash spend
Presentation subject to rounding
6
London Stock Exchange Green Economy Mark Award

         •   TI Fluid Systems is pleased to be awarded the London Stock Exchange’s Green Economy Mark,
             recognizing the scale of environmental benefit TI Fluid Systems products provide to the global
             automotive market
         •   The Green Economy Mark:
              •   Recognises companies that generate over 50% of revenue from environmentally positive goods,
                  products and services
              •   Is developed and managed by FTSE Russell for its global investor clients
         •   As a leading global manufacturer of highly engineered fluid and thermal management systems, TI Fluid
             Systems enables vehicle manufacturers to sustainably reduce CO2 emissions and improve fuel economy
             across all vehicle types, especially hybrid and battery electric vehicles

     Lightweight nylon fluid lines ● Thermal fluid products & Systems ● Zero emission fuel tanks ●
                                      Pressure resistant fuel tanks

        Helping the world transition to a greener, cleaner and better place to live

                                                                                                                    7
BEV Wins Continue

        Continuing awards in thermal products and
 launch of 2018 awarded Battery Electric Vehicles (“BEVs”)

  • Production of thermal products underway for 2018 global OEM BEV
    wins with models expected to be on the road late summer/ fall 2020

       • Remaining variants expected to follow late fall through 2021

  • Continuing to win additional regional BEV content on North
    American, Chinese and Korean OEM platforms

       • Refrigerant, coolant, nylon lines, connectors and sub-systems

  • Group continues to collaborate on integrated thermal products and
    systems with key global customers for BEVs

                                                                         8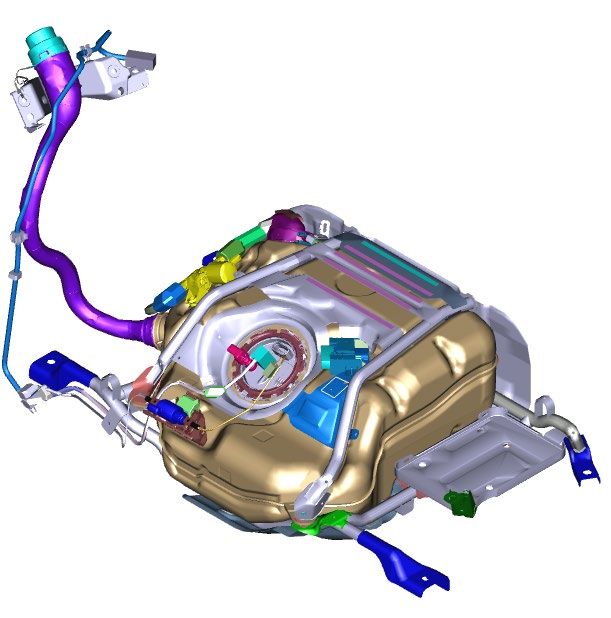
BEV Presence Solid

Key BEV’s Entering Market
      2020 - 2022

    46
                                                                                                                             • 46 key BEV platforms have been identified to come to
                           31                                                                                                      market in Europe and North America between 2020 and
                                                                                                                                   2022

                                                                                                                             • TIFS estimated to have product content on more than

                                                                                    67%                                            two-thirds of the 46 BEVs including ~ 50% with thermal
                                                                                                                                   product content -- leading product representation

                                                                                                                             • Additional evidence of TIFS electrification strategy
                                                                                                                                   progressing well

  Key BEV(a)           TIFS (b)
 Platforms           Content

           Significant leading representation of product content on key BEV launches
               a)   JP Morgan Europe Equity Research: EV Deep Dive: European Focus 10 July 2020                                                                                             9
               b)   Content identified as having at least one TIFS product on specific key BEV platforms won and targeted to win (2022 only)
HEV Fuel Tank Share Continues
                      Technology strengths continue to
             drive share gain in HEV pressure resistant fuel tanks
  • Continue to be awarded advanced technology
       products required to reduce emissions and
       improve fuel economy in hybrid electric vehicles

  • Award of high volume pressure resistant fuel
       tanks for a German OEM in Europe with SOP
       expected in 2021
                                               (a)
             • Lifetime volume of ~ 420k units for hybrid
                  electric vehicles (“HEVs”)

             • Integrated Transfer System (“ITS”) process
                  technology used to support robustness,
                  reduce slosh and integrate components

   • Customer relationships, global footprint and reputation as a leading fluid
        systems provider contribute to securing new business awards and
        support continued organic growth

                                                                                  10
a) Based on customer planning volumes
H1 2020 vs H1 2019 Revenue and Vehicle Production
Revenue Outperformance Continues
North America Asia-Pacific Global
(a)
Europe
Region
~ 250 bps above
auto production
H1 2019 – (b)
(b)
2020 Vehicle TI
Vehicle TI
Vehicle TI Production Revenue
Vehicle TI Production Revenue
Production Revenue (units)
Production Revenue (units)
(units) (units)
• Europe revenue (35.6)% lower • North America revenue • Asia Pacific revenue (13.7)% • Group revenue (30.7)% lower
(or +3.2% above vehicle (39.5)% lower (or +0.4% lower (or +12.6% above (or +2.5% above vehicle
production) above vehicle production) vehicle production) production)
• Aligned with customers and • Although revenue impacted
• Business launches and • Business model continuing to
closed factories to minimize risk by extended OEM factory
growth in FTDS segment in demonstrate consistent
closures, favorable impact
• Successful launch of new China driving outperformance outperformance
of new business launches
business and favorable mix a) Europe vehicle production units include Africa and the Middle East
and mix offset decline b) Revenue at constant currency
11
Source: July 2020 IHS Markit and company estimatesCOVID-19 (Coronavirus) Update
• Significant impact to overall economic activity and global light vehicle production as pandemic spread from east to west
• H1 2020 light vehicle production decline of 33.2% YoY
• Asia Pacific -26.3% | China -19.7% | Europe -38.8% | North America -39.9% | Latin America -51.0%
• Lowest month was April with a decline of 61.4% YoY
• TI Fluid Systems acted early utilizing the strengths of an experienced management team
• Travel banned globally, transition to remote work for staff functions, production facilities closed in alignment with OEM plant
closures
• Significant return to work protocols established to protect returning workers health and safety including temperature screening,
revised production process for proximity distancing, face masks, enhanced personal and equipment sanitation
• Initiated a major cost saving and cash preservation focus program to ensure financial health through unprecedented downturn
• Collaborated with Ford Motor Co. and 3M to prototype, develop and produce within just two weeks air flex tube assemblies for
powered air-purifying respiratory systems (PAPR) for use by front line health workers battling the COVID-19 pandemic
Early response to protect our employees, health workers and company resilience
Source: July 2020 IHS Markit and company estimates 12Fixed Cost Restructuring Actions
• Structural changes now necessary given the likelihood of a prolonged period of light vehicle production recovery
• Restructuring focus targeting to reduce Fixed Cost by 16.2%
• Workforce reduction:
• We expect the reduction in workforce of at least ~ 1,000 associates from our global workforce of 27,300
• Cash expenditures and savings
• We expect cash expenditures of ~ €17m 2020 and ~ €30m in 2021, totaling ~ €47m
• Savings in 2022 of ~ €74m and cumulative savings through 2022 of ~ €94m
• 6 Plant closures and 2 partial closures
• 4 in Europe | 2 in North America
• Plant equipment and development cost asset impairments recorded
Preparing for a prolonged period of light vehicle production recovery
13Financial Performance – Ron Hundzinski
14Revenue Outperformance Continues
Continued outperformance of global vehicle production in the first half of 2020
Group Revenue (€m) Key Comments
YoY change -30.7% at reported rates
• Revenue declined by 30.7% at constant currency and also at
reported rates
• Global light vehicle production decline of 33.2%
• Revenue outperformance of + 2.5%
• Europe and Asia Pacific revenue continued to outperform
regional vehicle production
• Europe – 39% of the Group’s revenue with European
market weakness offset by launch activity
• North America – 25% of the Group’s revenue; regional
revenue decline broadly in line with market trend
Global Auto Production (YoY) -33.2%
• Asia Pacific – 35% of the Group’s revenue benefiting
from new business for FTDS in China
Source: July 2020 IHS Markit and company estimates 15Adj. EBIT and Adj. EBITDA Margins Remain Positive
Margins adversely affected by customer shutdowns due to COVID-19
Adj. EBIT (€m) (a) Key Comments
10.1%
(a)
• Adj. EBIT of €28m or 2.3% margin
• Adj. EBIT 145m lower -- 28% decremental impact
2.3% • Global vehicle production volumes remain challenging
(b)
• Adj. EBITDA of €110m or 9.3% margin
• Strength of business model with ability to flex costs in
Adj. EBITDA (€m) (b) different volume environments
14.4%
• Maintaining commitment to financial resilience through all
9.3% economic cycles
• Global approach taken in early March to reduce costs
and conserve cash
a) Adjusted EBIT is defined as Adjusted EBITDA less depreciation (including PP&E impairment) and amortisation (including intangibles impairment) arising on tangible and intangible assets before adjusting for any purchase
price adjustments to fair values arising on acquisitions 16
b) Adjusted EBITDA defined as profit for the period before exceptional items, income tax expense, net finance expense, depreciation, amortisation and impairment of PP&E and intangible assets, net foreign exchange gains/
losses, restructuring costs and adjustment for associate incomeSegment Revenue and Adj. EBIT Margins
Both FCS and FTDS impacted by conversion on sharply lower revenue
FCS Revenue (€m) FTDS Revenue (€m)
Adj. EBIT Margin 10.4% 2.2% Adj. EBIT Margin 9.8% 2.5%
• Revenue decline of 32.3% at constant currency • Revenue decline of 28.5% at constant currency
• At reported rates, YoY change of (32.5)% • At reported rates, YoY change of (28.5)%
• Adj. EBIT margin 820 basis points lower • Adj. EBIT margin 730 basis points lower
• YoY margin reduction driven by the market volume • Decrease in margin reflects the conversion of the
reductions particularly in Europe and North America significant reduction in revenues as a result of COVID-19,
• Asia Pacific recovering quickly particularly in Europe and North America
• Asia Pacific continues to benefit from new launches
17Adj. Net Income, Adj. Basic EPS
Adj. Basic EPS of (7.61) € cents
Adj. Net Income Reconciliation (€m) Adj. Net Income (€m)
H1 2019 H1 2020
YoY change (162)%
Profit / (Loss) for the Period 60 (321)
Non Controlling Interests (1) (1)
Net FX Gains (1) (1)
Exceptional Asset Impairment - 305
Exceptional Deferred Tax credit - (29)
Other Reconciling Items 7 7
(a)
Adj. Net Income 65 (40)
Dividend
• Adj. Basic EPS of (7.61) € cents
(b)
Adj. Basic EPS 12.4 euro cents (7.61) euro cents
• No preliminary dividend payout planned in 2020 due to
H1 results and ongoing exceptional circumstances
a) Adjusted Net Income defined as Adjusted EBITDA less net finance expense before exceptional items, income tax expense before exceptional items, depreciation and amortisation (including PP&E and intangible impairments)
and non-controlling interests share of profit 18
b) Adjusted Basic EPS defined as Adjusted Net Income divided by the number of shares in issue at the current balance sheet dateAdj. Free Cash Flow Growth – Solid Business Model
Steady Adj. Free Cash Flow generation
Adj. EBITDA to Adj. Free Cash Flow Reconciliation (€m) Adj. Free Cash Flow (€m) (a)
1 H1 2019 H1 2020 35
Adj. EBITDA 246 110
19
Cash Interest (31) (28)
Cash Tax (46) (21)
Working Capital, Provisions and Other (59) 42
PP&E and Intangibles (88) (51) H1 2019 H1 2020
Cash Received on Settlement of Derivatives (3) (17)
• Able to maintain positive adjusted free cash flow
Adj. Free Cash Flow 19 35 generation through careful management of working
capital, tax and treatment of PP&E and intangibles
a) Adj. Free Cash Flow defined as cash generated from operating activities, less cash used by Investing activities, adjusted for acquisitions, movements in financial assets at fair value through the profit or loss, cash payments related
to IPO costs and cash received on settlement of derivatives and restructuring cash spend
19Exceptional Asset Impairment
• Exceptional asset impairment charge of €304.6 million made in H1 2020
• Non-cash charge
• Impacts goodwill, intangible and tangible fixed assets
• Includes adjustment to purchase price accounting attributable to the 2015 Bain purchase of TI Automotive
• Charge relates to the likelihood of business performance in the medium term given the context of a prolonged
period of light vehicle production recovery
Prolonged market recovery requiring non-cash impairment
20Major Savings Initiative – Cost and Cash Focus
Maintaining commitment to financial resilience though all economic cycles
Manufacturing operations and variable cost • Global approach taken early March 2020
• Senior management ‘Champions’ for each
Staff Labour Initiatives functional area
• Every cost / cash financial item targeted
Purchasing Initiatives
• Significant savings and cash benefits expected
• Supplements historic base of double digit
Fixed Cost & Other Initiatives margin, strong 2020 opening cash position and
liquidity
Corporate Cost Savings • Shared sacrifice – across all stakeholders
21Strong Capital Structure and Liquidity
Capital Structure Evolution Key Comments
€m Interest Rate Dec 2019 Jun 2020
Financial Liabilities • Capital allocation priority remains on deleveraging
US LIBOR+ 2.5%
Secured Term Loan Euribor + 2.75%
1,168 1,164 through free cash flow generation in the medium term
Revolver US LIBOR+ 3.25% - 111
Unamortised Fees (17) (13)
• Decision to fully draw the revolving facility in
Total 1,151 1,262 March 2020 as a pre-emptive action to minimize
Cash and Cash Equivalents
(a)
(413) (544) the risk that the funds would not be available due
Net Debt 738 718
to risk of banking liquidity
Net Debt / Adj. EBITDA LTM 1.5x 2.0x
• Revolving facility drawings repaid in July 2020
Leverage (Net Debt / Adj. EBITDA)
a) Cash and cash equivalents includes financial assets at Fair Value Through Profit or Loss (“FVTPL”)
22H1 2020 Summary
TI Fluid Systems continuing to do what we say we will do
• Early actions put in place to protect employees and sustainable business model
• Continued revenue outperformance of 2.5%
• Positive EBIT of 2.3%
• Positive Free Cash Flow of €35m
• Solid balance sheet and strong cash position
• Electrification strategy continuing to progress
Well positioned for 2020 and future opportunities
23Q&A
24Appendix
25High Level Income Statement
Adjustments to EBITDA and EBIT – non cash and non operational
Income Statement Summary Key Comments
€m H1 2019 H1 2020
Revenue 1,708 1,183 • Adjustments primarily relate to certain non cash and non
Adj. EBIT 173 28 operational expenses
Adj. EBIT % 10.1% 2.3%
PPA (44) (28) • Purchase Price Accounting (“PPA”) - depreciation and
D&A 116 110 amortisation arising on the fair value uplifts related to the
Adj. EBITDA 246 110 Bain Capital and Millennium acquisitions
Adj. EBITDA % 14.4% 9.3% • Net FX gains / losses - primarily FX impact from US to UK
D&A (116) (110)
inter-company loans in USD
Net FX (Losses)/ Gains 1 1
Exceptional Cost of Sales - (305) • Net Loss for the period impacted by the €305m
Other Reconciling Items (8) (8) Exceptional Impairment charge and €29m exceptional credit
(a)
Operating Profit 123 (312) for deferred taxes
Net finance expense (30) (41)
Tax (34) 3
Exceptional Deferred Tax Credit - 29
Profit / (Loss) for the Period 60 (321)
a) Other reconciling items include non-exceptional restructuring charges and adjustments for associate income 26Adj. Effective Tax Rate
Adj. Effective Tax Rate ~ 40%
Effective Tax Rate Adjustments (a) Key Comments
€m H1 2019 H1 2020 • Adjusted effective tax rate - approximately 40%
Profit / (Loss) before Income Tax 93 (48) • Adjustments to reported profit before tax – primarily
relate to expenses in the UK that are either not deductible
UK losses 25 43 or not tax effected because of the UK loss position including
interest, financing and operating costs
Adj. Profit / (Loss) before Income Tax 118 (5)
• Adjustments to income tax – relate to changes arising in
Income tax 33 (3)
the year affecting items originally provided for in prior
Prior year tax provisions / adjustments 3 1
periods
Adj. Income Tax 36 (2)
Adj. Effective Tax Rate 31% 40%
a) Amounts shown exclude exceptional items
27You can also read