Half year results for 26 weeks ended 29 September 2018 13 November 2018

Page created by Mike Sandoval
 
CONTINUE READING
Half year results for 26 weeks ended 29 September 2018 13 November 2018
Half year results
for 26 weeks ended 29 September 2018
13 November 2018
Half year results for 26 weeks ended 29 September 2018 13 November 2018
INTRODUCTION
Good financial performance and innovation continuing to deliver

                Financial results                     Strategic & Operational Headlines

       +1.3%                     +6.2%

  H1 Revenue growth           H1 Trading profit   Mr Kipling relaunch          Batchelors

                                 £510m
      +13.8%
                               ↓£26m*

    H1 Adjusted eps                 Net debt      Strong H2 pipeline      Logistics challenges

                                                                           * - Compared to FY17/18 H1
                                                                                                        2
Half year results for 26 weeks ended 29 September 2018 13 November 2018
Alastair Murray
Chief Financial Officer

                          3
Half year results for 26 weeks ended 29 September 2018 13 November 2018
GROUP HEADLINE RESULTS
5th consecutive quarter of revenue growth and Trading profit up +6.2%

 £m                                       FY18/19 H1       FY17/18 H1       Change (%)         Q2 Change (%)

Branded revenue                               297              295              +0.5%               0.0%
Non-branded revenue                            61               58              +5.5%               +6.5%
Total revenue                                 358              353              +1.3%               +1.0%

Divisional contribution                        68               63              +8.4%
Group & corporate costs                       (17)             (15)            (16.1%)
Trading profit                                 51               48              6.2%
Trading profit %                             14.2%            13.6%            +0.6ppts
EBITDA                                         59               56              5.9%
EBITDA %                                     16.6%            15.9%            +0.7ppts

 ▪    Resilient revenue performance especially in Quarter 2 following hot summer in the UK
 ▪    Gross margin % up +1.8ppt ahead of prior year as full effect of recovery of input cost inflation comes through
 ▪    Consumer marketing flat in H1; expect FY to be in line with prior year
 ▪    Higher distribution costs in first half due to challenges faced in final phase of logistics transformation programme
 ▪    Group & corporate costs higher due to change in phasing of bonus provision
                                                                                                                             4
Half year results for 26 weeks ended 29 September 2018 13 November 2018
GROCERY
Flat revenue and growth in Divisional contribution

 £m                             FY18/19 H1           FY17/18 H1           Change (%)            Q2 Change (%)

Branded revenue                     210                  215                 (2.1%)                  (2.7%)
Non-branded revenue                  46                   40                 +13.6%                 +17.8%
Total revenue                       256                  255                 +0.4%                   +0.6%

Divisional contribution              57                   51                 +10.9%
Divisional contribution %          22.3%                20.2%               +2.1ppts

▪ Branded revenue: good Batchelors, Sharwood’s and Angel Delight performances offset by lower Bisto sales
  in July and August and lower sales of Loyd Grossman cooking sauces
▪ International sales down (9%) in the period as growth in Sharwood’s and Mr Kipling offset by phasing of
  Cadbury cake shipments to Australia and pricing alignment of export wholesalers
▪ Non-branded revenue grew due to progress at Knighton Foods, B2B phasing benefits and contract wins in
  Stuffing and Noodles
▪ Divisional contribution and margin % returned to FY16/17 levels following recovery of input cost inflation
  and also benefitted from lower promotional activity on Ambrosia
▪ Knighton Foods and International also delivered improved Divisional contribution performances

                                                                                                                5
Half year results for 26 weeks ended 29 September 2018 13 November 2018
SWEET TREATS
Mr Kipling revenue growth of +13%

 £m                               FY18/19 H1           FY17/18 H1           Change (%)            Q2 Change (%)

 Branded sales                        87                    81                 +7.4%                  +7.3%
 Non-branded sales                    15                    17                (13.1%)                 (19.0%)
 Total sales                          102                   98                 +3.8%                  +2.1%

 Divisional contribution              11                    12                 (1.7%)
 Divisional contribution %           11.1%                11.7%               (0.6ppts)

 ▪    Excellent performance by Mr Kipling following major brand relaunch
 ▪    Cadbury cake core range in growth, offset by removal of tail SKUs
 ▪    Non-branded sales declined following the exit of some value contract ranges
 ▪    Divisional contribution slightly lower as revenue benefits from Mr Kipling branded relaunch offset by
      higher logistics costs and increased consumer marketing investment

                                                                                                                  6
Half year results for 26 weeks ended 29 September 2018 13 November 2018
OPERATING PROFIT
25.7% ahead of prior year

 £m                                                  FY18/19 H1        FY17/18 H1          Change (%)
 Trading profit                                                 51              48                6.2%
 Amortisation of intangible assets                             (18)            (18)               1.1%
 Foreign exchange fair value movements                           1               1             (11.1%)
 Restructuring costs                                            (5)             (3)            (64.5%)
 Net interest on pension and administration
 expenses                                                       (1)             (1)                  -

 Operating profit before impairment of
 goodwill and intangible assets                                 28              27                5.6%

 Impairment of goodwill and intangible assets                     -             (4)                  -
 Operating profit                                               28              23              25.7%

 ▪ Amortisation of intangible assets in line with prior year
 ▪ Restructuring costs higher than prior year due to final phase of logistics transformation programme
 ▪ Prior year impairment related to Knighton Foods

                                                                                                         7
Half year results for 26 weeks ended 29 September 2018 13 November 2018
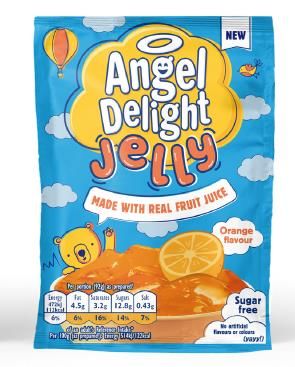
ADJUSTED EARNINGS PER SHARE
13.8% growth due to Trading profit and lower interest

£m                                                 FY18/19 H1         FY17/18 H1        Change (%)
Trading profit                                               51                 48          +6.2%
Net regular interest                                       (21)               (22)           +3.6%
Adjusted PBT                                                 30                 26         +14.3%

Notional tax @ 19%                                          (6)                (5)          +14.3%
Adjusted earnings                                            24                 21         +14.3%

Weighted average shares in issue (million)                840.8              834.2
Adjusted earnings per share (pence)                       2.91p              2.56p          13.8%

 ▪ Trading profit +6.2%
 ▪ Net regular interest slightly lower due to decreased margin following re-financing
 ▪ Notional tax rate in line with prior year

                                                                                                     8
Half year results for 26 weeks ended 29 September 2018 13 November 2018
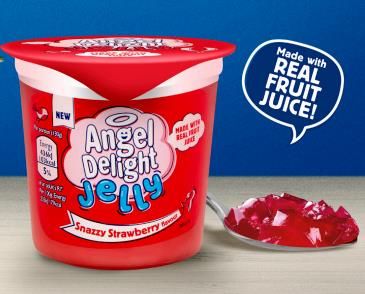
NET DEBT REDUCED BY £26m COMPARED TO A YEAR AGO
 £510m at the Half year

£m
600

550

                                                                                                         5               12            510
          496            51                                                            16
500                                                                     14
                                                                7
                                          8           19
450

400

350

300
         Net debt   Trading profit   Depreciation   Pensions   Capex   Interest   Working capital   Restructuring   Financing fees    Net debt
         FY17/18                                                                     / Other                                         FY18/19 H1

      ▪ Capital investment weighted to H2
      ▪ Working capital movement due to increased stock build in H1
      ▪ Interest also weighted to second half
      ▪ Financing fees split between redemption of old Fixed rate notes, issue of new notes and RCF extension
                                                                                                                                                  9
Half year results for 26 weeks ended 29 September 2018 13 November 2018
WE HAVE REDUCED YEAR END NET DEBT BY NEARLY £90m IN
LAST 3 YEARS

           £89m Organic Net debt reduction over last 3 years                       Investment over last 3 years

                                                                                                          More
  585         51                  ↓£89m
                                                                                  +£150m                  than
                                                                                                         doubled
                         534         11         523         27
                                                                       496        Consumer
                                                                                                          Innovation
                                                                                  marketing +
                                                                                                             rate
                                                                                    Capex

Net debt      Debt     Net debt     Debt      Net debt     Debt      Net debt         46
FY14/15    reduction   FY15/16    reduction   FY16/17    reduction   FY17/18
                                                                                   recruits                  47
            FY15/16                FY16/17                FY17/18
                                                                                                        Graduates
                                                                                      x2                recruited

           Premier Foods debt levels are the lowest since                       Sales & Marketing
                                                                                       and                Graduates
                   it became a public Company                                   Apprenticeships*

                                                                                                      * Over the last year
                                                                                                                             10
COMBINED PENSION SCHEMES – ACCOUNTING BASIS
Combined surplus £34m lower at £283m

                                                    29 September 2018                         31 March 2018
IAS19 Accounting valuation
(£m)                                                      Premier                                 Premier
                                               RHM                     Combined        RHM                     Combined
                                                           Foods                                   Foods
Assets                                           4,057          668         4,725        4,185          679         4,864

Liabilities                                     (3,341)      (1,101)       (4,442)      (3,431)      (1,116)      (4,547)

Surplus/(Deficit)                                  716         (433)          283          754         (437)          317

Surplus/(Deficit) net of deferred tax
(Tax @ 17.0%)                                      594         (359)          235          626         (363)          263

Discount rate                                    2.85%        2.85%        2.85%         2.70%        2.70%        2.70%

Inflation rate (RPI)                             3.25%        3.25%        3.25%         3.15%        3.15%        3.15%

 ▪ Assets reduced by £139m in the combined schemes due to Interest rate swaps valuations
 ▪ Combined liabilities £105m lower due to increase in discount rate, partly offset by an increase in the inflation rate
   assumption
 ▪ NPV of future pension deficit payments remains unchanged at £300-320m

                                                                                                                            11
PENSION SCHEMES VALUATION EVOLUTION
Position of principal schemes stable and improving

 Surplus/
 (Deficit)
   £m

1,000

  800
                                                        716
  600

  400

  200

     0

 (200)

 (400)                                                 (433)
 (600)

 (800)
             Dec          RHM    Premier Foods       Sept
             2013                                    2018

                                                               12
FY18/19 CASH GUIDANCE

FY18/19 guidance                                                           £m
Working capital                                                      Slightly negative
Depreciation                                                           £16-£18m
Capital expenditure                                                 Maximum £22m
Interest – cash                                                        £30-£34m
Interest – P&L                                                         £40-£43m
Tax – cash                                                                 Nil
Tax – notional P&L rate                                                   19.0%
Pension deficit contributions                                             £35m
Pension administrative & PPF levy cash costs                             £6-£8m
Cash restructuring costs                                                £10-12m
Financing fees                                                            £12m

 ▪ Interest lower due to phasing of £300m Fixed rate notes due October 2023 coupon payments
 ▪ Working capital movement dependent on Brexit deal

                                                                                              13
CAPITAL STRUCTURE
£300m Fixed rate note issued in H1 and RCF extension to December 2022

£m
350
                                                                 300
300

250                                       210

200                                                 177

150

100

 50

  0
      2018     2019     2020     2021     June      Dec        Oct 2023
                                          2022      2022

              Floating Notes   RCF committed     Fixed Notes

▪ Appropriate liquidity and a comfortable maturity profile
▪ First maturity in June 2022
▪ Total committed RCF £177m following refinancing
                                                                          14
Gavin Darby
Chief Executive Officer
 Operational review

                      15
THE BOARD’S STRATEGY: BUILDING BUSINESS,
DELEVERAGING AND ACCELERATING VALUE CREATION

        Drive revenue growth                           Cost control & efficiency

                                        £

                                 Cash generation

                                                              Overlay with actions to
       Keep building           Net debt/EBITDA below
                                                              accelerate shareholder
         business               3.0x by March 2020
                                                                  value creation

                                                                                        16
STRATEGY & POTENTIAL DISPOSAL
There is no certainty that a transaction will complete

                                       1. Accelerated investment of
                                        • Consumer marketing
                                        • Capital expenditure
                                       2. Meaningful debt reduction

           £

                                  Options to accelerate
       Core Plan                                                      Potential disposal
                                   shareholder value
                                                                                           17
INDUSTRY CONTEXT
UK food sales displaying consistent growth as purchasing power returns

                    Food sales vs Non-food sales                                    Average earnings ahead of inflation

                                                                       %
  %
                                                                       3.5
 6.0
                                                                       3.0
 5.0
                                                                       2.5
 4.0
                                                                       2.0
 3.0
                                                                       1.5
 2.0                                                                   1.0
 1.0                                                                   0.5
 0.0                                                                   0.0
                                                                         Jan 2016             Jan 2017                Jan 2018     Aug 2018
(1.0)

(2.0)
         Sep                                                     Sep
        2017                                                    2018
               Food sales    Food volumes      Non-food sales                               CPI          Average earnings

                                                                               Sources: British Retail Consortium, September 2018; ONS
                                                                                                                                         18
CONTINUED QUARTERLY REVENUE GROWTH
Q2 sales growth despite strong prior year comparative and hot summer

                  Quarterly Revenue growth
                   % movement year on year

                                   7.0%
            6.2%

                            4.0%

                                             1.7%
                                                          1.0%

   (3.1%)

     Q1      Q2             Q3     Q4        Q1               Q2

                  FY17/18                           FY18/19

                                                                       19
OUR BUSINESS IS MORE RESILIENT THAN 4 YEARS AGO
Innovation strategy insulating against weather fluctuations

          Temperature                                         Quarterly
                                   Average category decline
            change                                            revenue

March
              ↑4.7OC                                ↓8%        ↓6.2%
2014

 Sept                                                          ↓5.4%
              ↑3.2OC                                ↓9%
 2016

  July
              ↑2.3OC                                ↓6%        ↑1.0%
 2018

                                                              Sources: IRI, Met Office
                                                                                         20
LOGISTICS UPDATE
Final phase of logistics transformation programme experiencing challenges

                                           Logistics Transformation

  Programme stages and overview:
  • Phase 1 completed end of FY17/18
  • Phase 2 completed in Quarter 1
  • Phase 3 transition commenced in Quarter 2:
    – Ramp up to expected operational performance by third party provider behind original plan
    – Initial labour availability and retention issues now resolved
    – Customer service levels currently below normal high standards but improving
    – Additional contingency plans in place to mitigate any further impacts
    – Sweet Treats revenue expected to be impacted in Quarter 3
    – Grocery revenue expected to be unaffected in Quarter 3

                                                                                                 21
PRODUCT INNOVATION CONTINUES TO SUPPORT GROWTH
All our new product innovation is aligned to consumer trends

    Innovation as % UK branded sales*
                                                             % of NPD in market after 2 years
       Targeting 10% of UK branded sales

                                           10.0%
                                                                                        70%

                                  7.1%
                        6.4%
              5.1%

    3.6%                                                             25%

   FY15/16   FY16/17   FY17/18   FY18/19   Target                 Total market           PF
                                   F/C

   Health &                                         Snacking/On
                                 Convenience                                       Indulgence
   Nutrition                                           the go

                                                                                 * - For definitions, see appendix
                                                                                                                     22
SUCCESSFUL MR KIPLING RELAUNCH IN H1
The Group’s biggest brand delivered double-digit growth

       FY17/18                   Brand Relaunch Ingredients             FY18/19 H1

       ↓2%                                                               ↑13%
       Revenue                                                            Revenue

                              TV advertising             NPD

       ↓3%                                                                ↑5%
        Volume                                                            Volume

                           Packaging redesign       Instore execution
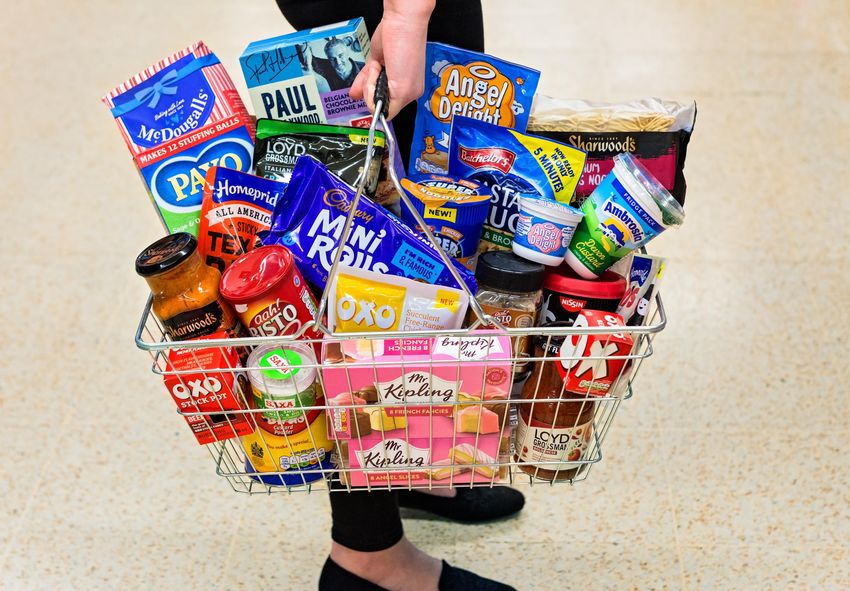
                                                                                     23
BATCHELORS & NISSIN RETAIN CATEGORY LEADERSHIP
Batchelors pots range revenues doubled in H1

              Batchelors                        Nissin

                +7%                            +63%
               H1 revenue                      H1 revenue
                 growth                          growth

                                                 Source: IRI, 52 w/e 29 September 2018
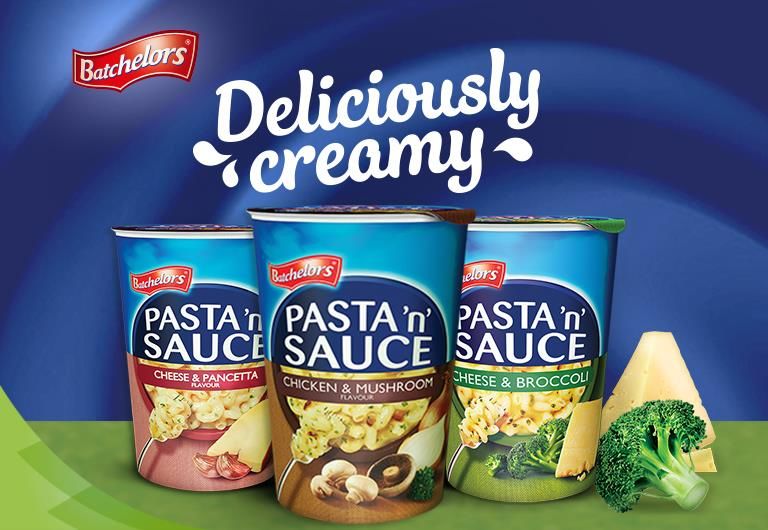
                                                                                         24
HEALTH & NUTRITION
Better for you choices across the portfolio

                                           Health & Nutrition range
                           Lower calories, Lower sugar, Green traffic lights, Gluten free

                                                                                            Front of
     30%         30%                 30%              Gluten                                pack IGD
   less sugar   less fat         less sodium           free                                   best
                                                                                            practice

                                                                                                       25
GREAT INNOVATION COMING FOR H2
Aligned to key consumer trends

               Loyd Grossman                                    Ambrosia               Oxo

‘Pasta Italia’ Sachets      ‘Pasta Italia’ Pots                Pot desserts       Premium stock

                         Angel Delight                         Sharwood’s       Cadbury

           Layers pots                            Jelly pots   Noodle pots    Baking mixes

                                                                                                  26
INTERNATIONAL HIGHLIGHTS
Australia Cadbury cake in market performance strong; highest ever in H1

                               Australia                                                  Sharwood’s
                                  Cake                                              Revenue growth +47%

                                 12.4%
     Market share
     progression        9.6%

                                                                                               ▪ Sharwood’s revenue
              4.3%                                                                               growth due to
                                                                                                 increased instore
    1.5%                                                                                         feature
                                                                                               ▪ Market share gains

   FY15/16   FY16/17   FY17/18 FY18/19 H1

 ▪ International quarterly growth pauses after 15 consecutive quarters                       ▪ Sharwood’s strong
   growth                                                                                      growth following price
 ▪ H1 Revenue down (9%) due to phasing of shipments of Cadbury cake to                         re-alignment
   Australian retailers                                                                      ▪ Targeted marketing
 ▪ However, further market share gains show consumer demand continues                          activity

                                                                         Source: Nielsen Australia, 26 w/e 7 October 2018
                                                                                                                            27
BREXIT
Scenario planning by cross-functional management committee

                  Scale & context                                      Scenario planning

                                                      1.   Scenario planning for several months

        €50m                    c.£550m               2.   Broad range of commodity expenditure, with
                                                           relatively low single exposure
                                                      3.   Close collaboration with suppliers &
 Net annual Euros spend     Annual 3rd party spend
                                                           customers to explore stock building
                                                      4.   Stock building of raw materials
                                                      5.   Short-term impact on working capital
                                                           movement in Q4 – up to £10m
         85%                        3.4%
                                                      6.   Focus on key, high selling SKUs

 Spend with UK suppliers    FY17/18 revenue to EU

       c.3.5%                       c.30%

 Seasonal EU employees     Raw materials EU sourced
                                                                                                        28
CORPORATE & SOCIAL RESPONSIBILITY
We are making good progress in a number of areas

                 Sugar                                        Plastics

    1,000        Remove 1,000 Tonnes of sugar
                                                            Recyclable plastics used in our
   Tonnes      from portfolio by end of FY18/19    70%                products

                                                    240    Tonnes of plastics removed over
                                                  Tonnes             last 3 years

             Calorie control
                                                    80      Further reduction commitment
                                                  Tonnes               in 2018

                                                           Plastics as proportion of our total
SUMMARY

              Financial results                     Strategic & Operational Headlines

     +1.3%                     +6.2%

 H1 Revenue growth          H1 Trading profit   Mr Kipling relaunch          Batchelors

                               £510m
     +13.8%
                             ↓£26m*

  H1 Adjusted eps                 Net debt      Strong H2 pipeline      Logistics challenges

                                                                         * - Compared to FY17/18 H1
                                                                                                      30
OUTLOOK

▪   Committed to reducing Net debt by £25m per annum
▪   Net debt/EBITDA target of below 3.0x expected by March 2020, excluding any M&A impact
▪   Working in parallel to identify other strategic opportunities to accelerate the Company’s turnaround
▪   Any transaction would aim to provide opportunity to accelerate investment in consumer marketing,
    capex and meaningful Net debt reduction
▪   Third party discussions regarding potential disposal of Ambrosia
▪   Strong innovation plan for H2
▪   Logistics transformation programme expected to adversely impact Sweet Treats Q3 revenue
▪   Full year profit expectations unchanged

                                                                                                           31
Q&A
  32
Appendix

           33
CAUTIONARY STATEMENT

Certain statements in this presentation are forward looking statements. By their nature,
forward looking statements involve a number of risks, uncertainties or assumptions that
could cause actual results or events to differ materially from those expressed or implied
by those statements. Forward looking statements regarding past trends or activities
should not be taken as representation that such trends or activities will continue in the
future. Accordingly, undue reliance should not be placed on forward looking statements.

Please note that any disclosures or statements referring to pro forma results provided in
this presentation have not been subject to audit or review by the Company’s auditors.

                                                                                            34
DEFINITIONS

▪ The period ‘FY18/19 H1’ refers to the 26 weeks ended 29 September 2018. The period ‘FY17/18 H1’ refers to
  the 26 weeks ended 30 September 2017.

▪ The period ‘Q2’ refers to the thirteen weeks ended 29 September 2018 and the comparative period, the
  thirteen weeks ended 30 September 2017.

▪ Trading profit is defined as Profit/(loss) before tax before net finance costs, amortisation of intangible assets,
  impairment, fair value movements on foreign exchange and other derivative contracts, restructuring costs, and
  net interest on pensions and administration expenses

▪ Adjusted profit before tax is defined as Trading profit less net regular interest. Net regular interest is defined as
  net finance cost after excluding write-off of financing costs, the early redemption fee paid in the period, fair
  value movements on interest rate financial instruments and other interest. Adjusted earnings per share is
  defined as Adjusted profit before tax less a notional tax charge of 19.0% divided by the weighted average of the
  number of shares of 840.8 million (26 weeks ended 30 September 2017: 834.2 million).

▪ Innovation as % sales defined as branded sales from the Grocery and Sweet Treats business units (excluding
  International & Knighton) from new product development and existing product development from product
  codes launched in the last 24 months

                                                                                                                          35
LEADING CATEGORY POSITIONS
Strong market shares and high household penetration

                                                         Categories
                                    Brands                                    Position                   Share                Penetration

  Flavourings &
   Seasonings
                                                                                  1                     43%                       74%

   Quick Meals,
  Snacks & Soups
                                                                                  1                     31%                       46%

     Ambient
     Desserts
                                                                                  1                     35%                       56%

 Cooking Sauces &
 Accompaniments                                                                   1                     16%                       52%

  Ambient Cakes                                                                   1                     22%                       63%

                    Sources: Category position & market share: IRI 52 w/e 29 September 2018; Penetration: Kantar Worldpanel 52 w/e 9 September 2018
                                                                                                                                                      36
RETAILER BRAND
Ambient grocery shows lowest prevalence of retailer brand in UK grocery

                                                                           18%
                   33%
                                                                     Chilled                                   Frozen    45%
                          Ambient
                                                                     & Fresh                       55%
                                      67%
                                                              82%

                   Branded      Non-branded                Branded      Non-branded                  Branded      Non-branded

 Market size                 £29bn                                   £41bn                                     £6bn

                     Flavourings &                                                        Ambient              Ambient
                                               QMS             Cooking Sauces
                      Seasonings                                                          Desserts              Cake
   Market size           £383m                £379m                  £816m               £300m                 £1,020m

    PF share             43.1%                31.2%                  15.6%                34.8%                 22.3%

 Own label share         13.0%                 5.7%                  25.6%                19.8%                 51.5%

                                  Sources: Kantar Worldpanel, 52 weeks ended 25 March 2018, IRI 52 weeks ended 29 September 2018
                                                                                                                                   37
CUSTOMER & CATEGORY REVIEW
Long term outperformance in range reviews and an agile business model

      Net category distribution points gain 2018 vs 2013            Why is PF a great partner to UK retailers?

120
115                       112                                                                   Brand,
                                                           108
                                                                     Manufacturing
110                                                                                           product &
          106                                                           scale &
105                                                                                            insights
                                           98                          capability
100                                                                                           expertise
 95
 90
                                                                                    Agile &
 85
                                                                               flexible business
 80
                                                                                  concept to
       Customer 1     Customer 2       Customer 3      Customer 4
                                                                                   store in 6
                                                                                    months
         Index 100 = Distribution points parity, 2018 vs 2013

  • Three out of four major customers gained
    distribution since 2013
  • Reflects a period of many range reviews by
    retailers

                                                                                                                 38
GROCERY NON-BRANDED GROWTH B2B AND CONTRACT
WINS

      Grocery H1 revenue commentary                      Non-branded revenue by type

 Grocery Non-branded up +13.6%
 • Knighton Foods growing and accounts       Knighton                                  B2B & flour
   for half of the growth
 • Retailer brand contract wins in
   Desserts, Flour, Stuffings and Noodles                                   20%
                                                         25%
 • Other B2B phasing benefits

    Sweet Treats H1 revenue commentary
                                                                                  15%            Grocery
 Sweet Treats Non-branded down (13.1%)                                                            other

 • Various retailer brand contract exits
                                                         22%
 • Some impact from logistics
   transformation project                                                18%
 • Reduction in shelf space to branded      Cake value                                 Mince Pies,
   products in one retailer                   ranges                                    Yule logs
                                                                                       Easter cake
                                                                                                           39
INTEREST & TAXATION

Interest

 £m                                                          FY18/19 H1                   FY17/18 H1

Senior secured notes interest                                         16                          16
Bank debt interest                                                     3                               4
                                                                      19                          20
Amortisation of debt issuance costs                                    2                               2
Net regular interest                                                  21                          22

Taxation

▪ Deferred tax liability £3m
▪ Capital allowances in excess of depreciation provide further shield against future taxable profits
▪ Notional corporation tax 19.0% in FY18/19; deferred tax rate 17.0%
▪ Cash tax expected to be nil for medium term

                                                                                                           40
PENSIONS – COMBINED SCHEMES

£m                         29 Sept 2018 31 March 2018     Scheme Assets (£m)       29 September 2018   31 March 2018
Assets                            4,725           4,864   Equities                             192             297
Liabilities                      (4,442)        (4,547)
                                                          Government bonds                    1,022           1,046
Surplus                             283            317
                                                          Corporate bonds                       20              21
Surplus net of deferred
                                    235            263    Property                             403             391
tax @ (17.0%)
                                                          Absolute/Target return              1,369           1,324
                                              31 March    Cash                                  49              32
Key IAS 19 assumptions     29 Sept 2018
                                                  2018
                                                          Infrastructure funds                 237             255
Discount rate                    2.85%           2.70%
                                                          Swaps                                593             715
Inflation rate (RPI/CPI)   3.25%/2.15%     3.15%/2.05%
                                                          Private equity                       415             344
Mortality assumptions         LTI +1.0%       LTI +1.0%
                                                          Other                                425             439
▪ Combined schemes deficit reflects RHM                   Total                               4,725           4,864
  schemes surplus of £716m partly offset by
  Premier schemes deficit of £433m

                                                                                                                       41
BALANCE SHEET

£m                               29 September 2018   31 March 2018
Property, plant & equipment                   184             185
Intangibles / Goodwill                       1,058           1,075
Retirement benefit assets                     716             754
Non-current Assets                           1,958           2,014
Working Capital - Stock                       100              76
                 - Debtors                     66              75
                 - Creditors                 (220)           (214)
Total Working Capital                         (54)            (63)
Net debt
   Gross borrowings                          (521)           (520)
   Cash                                        11              24
Total Net debt                               (510)           (496)
Retirement benefit obligations               (433)           (437)
Other net liabilities                         (54)            (69)
Net Assets                                    907             949
Share capital & premium                      1,492           1,492
Reserves                                     (585)           (543)
Total equity                                  907             949

                                                                     42
You can also read