FY16 RESULTS PRESENTATION - Cartrack

Page created by Anna Taylor
 
CONTINUE READING
FY16 RESULTS PRESENTATION - Cartrack
FY16 RESULTS PRESENTATION
FY16 RESULTS PRESENTATION - Cartrack
TABLE OF CONTENTS

     Overview
     Financial review
     Strategic review
     Outlook
     Annexures

2
FY16 RESULTS PRESENTATION - Cartrack
HIGHLIGHTS
                  A top global        Consistent
                   telematics         growth in
                    company          profitability

                 > R1 billion in   Annuity based
                    revenue          business

                   > 500 000        Highest cash
                  subscribers      generator in its
                                        class

3
FY16 RESULTS PRESENTATION - Cartrack
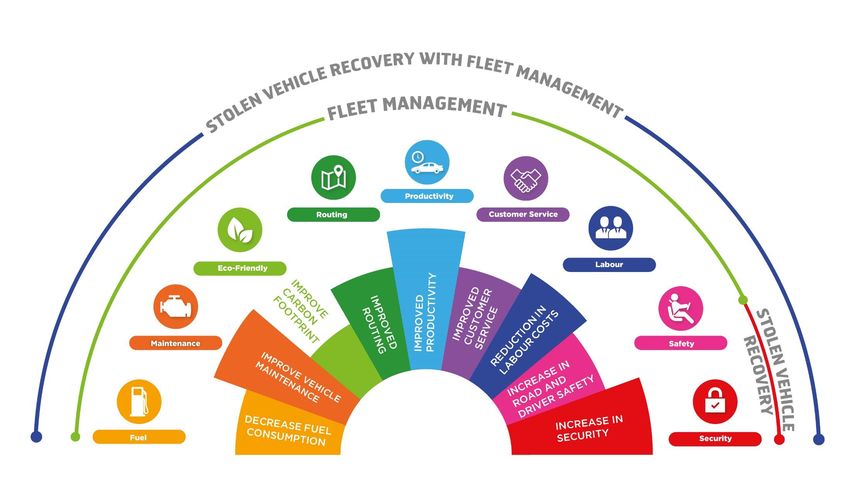
CARTRACK’S VALUE PROPOSITION TO CUSTOMERS
EVEN MORE BENEFICIAL IN
  CHALLENGING TIMES

                            Increase fleet    Increase workforce   Reduce operational
                             productivity          efficiency            costs

                          Increase customer      Increase safety
                                                                   Increase revenue
                               service             and security
      4
FY16 RESULTS PRESENTATION - Cartrack
c
                      OUR CUSTOMERS’ CHALLENGES

                        Wasteful         Timecard        Excessive         Excessive
    High Fuel Costs
                      Vehicle Idling    Falsification    Overtime      Maintenance Costs

Excessive Mileage      Poor Driver     Unproductive     Unauthorised     Vehicle Theft
                       Behaviour          Drivers       Vehicle Use

5
FY16 RESULTS PRESENTATION - Cartrack
CARTRACK CORE SOLUTIONS PER PRODUCT   c

6
FY16 RESULTS PRESENTATION - Cartrack
CARTRACK – SOUTH AFRICA ROI CUSTOMER CALCULATOR
               FLEET MANAGEMENT                 c

                     R575
                    575.42

                                          Expected
                     R191                 minimum
                    191.41
                                         ROI/month
                                            1066%
                                           1024.67%

    452.67
     R452            R391
                    391.67   Total Expected Saving = 1,759.76
                                                       R3 265

                                       Total Cost =   R280
                   1056.87
                    R1 056
    600.67
     R600

7
FY16 RESULTS PRESENTATION - Cartrack
KEY SECURITY SERVICES AND FEATURES

                                Lifetime
                                Warranty

8
FY16 RESULTS PRESENTATION - Cartrack
KEY CARTRACK FLEET MANAGEMENT REPORTS                                             c

          Trip Reports    Fuel Efficiency    Fuel Card           Geo-fence
                             Report         Management            Reports

Operating Hours       Toll road    Driver Scorecard   Speeding Report    Idling Report
                    Management

9
FY16 RESULTS PRESENTATION - Cartrack
STRONG MOMENTUM IN SUBSCRIBER GROWTH

                               TOTAL ACTIVE UNITS
600 000

                                                                        502 849
500 000

                                                              430 386

                                                    378 778
400 000

                                    144 224
300 000
                     246 366

           209 680
200 000

100 000

     0
            2011      2012           2013           2014       2015      2016

10
c
                              PLATFORM FOR GROWTH
                                                               EUROPE
                                                               • Slow economic recovery
                                                               • Telemetry communication costs
                                                                 significantly reduced
                                                               • Increased efficiencies have led to
                         EUROPE                                  reduced overhead expenses
                 Revenue     +12%
                                              ASIA & ME        AFRICA – OTHER
                 Subscribers +23%
                 Operating profit +53%   Revenue     +134%     • Commodity cycle and forex
                                         Subscribers +151%       issues provide short term
                                         Operating loss +70%     challenges
                                                               • Substantial growth opportunities
                                                                 remain in the longer term
                                                               • Significant churn in subscribers
                                                                 contracted to services in lower
                                                                 end of the price spectrum
                                                               • We believe the market remains
       AFRICA                                                    unpenetrated
Revenue     +22%
Subscribers +10%                                               SOUTH AFRICA
Operating profit +29%                                          • Significant investment in
                                                                 distribution yielding dividends
                                                               • We believe that growth in this
                                                                 market remains strong

                                                               ASIA AND MIDDLE EAST
                  SOUTH AFRICA
                                                               • We continue to invest in the
               Revenue     +19%
                                                                  brand and distribution
               Subscribers +16%
                                                               • Starting to see some traction
               Operating profit +16%
 11
A DIVERSIFIED SUBSCRIBER GROWTH

                   Fleet
                Management

                  +27%
                                                            International
                                                                   +16
                                                             Subscriber
                                                                Base
                                                                %
                             Subscriber                      +21%
                               Base 12.1K

                             +17%                 SA
                                               Subscriber
       Stolen                                    Base
                                            Item C
      Vehicle                                  +16%
     Recovery                               8.5K
      +6%
       +6

12
A HIGHLY SUSTAINABLE AND PREDICTABLE MODEL

                             Revenue growth                                                   Consistent ratios
            1 200                                                         90%                         84%                        84%
                                                                          80%   74%
            1 000
                                                                          70%
             800                                                          60%
R million

                                                                                      47%                                              46%
                                                                          50%                                   43%
             600
                                                                          40%
             400                                                          30%
                                                                          20%
             200
                                                                          10%
                 -                                                        0%
                      2012     2013            2014         2015   2016           2014                   2015                      2016

                             Annuity Revenue      Revenue                                   Annuity revenue %         EBITDA %

    Diversified base – present in 21 countries, fleet management as well as SVR product
     offerings
    Secure annuity-based model – 84% of revenue
    Longevity and predictability - average customer lifecycle approximately 62 months
    Scale – few companies globally have a subscriber base > 500 000 contracts
    Highest margins in its class

            13
Financial Review
STRONG YEAR-ON-YEAR GROWTH

                                  EBITDA

     Profit after tax             +28%

       +25%

                                             Profit before tax
                        Revenue                 +23%
                                                                 Operating Profit
                        +20%                                        +19%
                                    Item A

15
STRONG PROFITABILITY

                 1 200

                                                                                                    1 005
                 1 000

                                                                         835
                  800

                                           633
     R million

                  600

                                                                                              463
                                                                                        362
                                                                   362

                                                                                  345
                  400
                                     296

                                                             294
                                                       290
                               254
                         254

                  200

                    -
                                2014                          2015                       2016
                          Operating Profit       Profit before tax       EBITDA   Revenue

16
FOREIGN EXCHANGE IMPACTS ON FINANCIAL
                        RESULTS
     Despite the sharp decline in the South African Rand, the net effect of
     currency fluctuations on Cartrack’s global business over the past year
     has impacted positively on the consolidated profit before tax by an
     estimated R13 million. The main contributing factors are :

                                                              R millions

      non operating foreign exchange gain                    +15,5

      operating foreign exchange gain                        +11,5

      hardware costs in cost of sales                        - 11,0

      the fluctuation in the Rand against other Group
       trading currencies had a net negative impact on
       consolidation                                          - 3,0

                                                              R13,0
17
EARNING AND DIVIDENDS

                          +27%

                                                              Earnings and dividends
     +20%                                                90
                                                                                                        81
                                                         80
                                                         70               64
                                                                                            55

                                       Cents per share
                                                         60
                                                              46
     HEPS                                                50
                                                         40
                                                         30
                                                         20
                                                         10
                                                         -
                                                                   2015                          2016
                                                                               DPS   HEPS
         DPS
                           HEPS

        Final dividend of 35 cents per share
        Total dividend for FY16 of 55 cents per share
        Dividend cover of 1.45 times
        Dividend cover target - 1.25 to 1.55 times
18                                                                                                           18
STRONG BALANCE SHEET POSITIONED FOR GROWTH

     No gearing

     Clean debtors book – debtors days                33 days

     Adequate stock levels of 6 to 9 months trading

     Current ratio                                    1,4

     Quick ratio                                      0,9

19
A HIGH CASH GENERATOR

                                                                          Cash conversion
                                                        400
 Annuity business with strong revenue                  350
  visibility into FY17                                  300
                                                        250
 We have, since inception, financed

                                            R million
                                                        200
  our own growth in both existing and
                                                        150
  new markets
                                                        100

 Strong track record of returning excess                50

  cash to the shareholders                               -
                                                                   2012          2013      2014        2015        2016

 Cartrack senior management                                  Operating profit      Net cash from operating activities
  involved in all expansions to minimise
  risk

 20
Shareholder Value

                    Strategic Review
COMMERCIAL

       CONSUMER                        CRIME

                     TELEMATICS
                      DEMAND
                      DRIVERS
        ORIGINAL
       EQUIPMENT                     INSURANCE
     MANUFACTURERS                   TELEMATICS
         (OEM)

                       REGULATORY
                      REQUIREMENTS

22
MARKET DRIVERS INDICATE ABUNDANT GROWTH
                       POTENTIAL

Consistent with prior years:
    Increasing demand for big data using Software-as-a-Service (SaaS) to
     optimise both fleets and workforce
 Berg Insight states the global market size is 94 million vehicles with
  only a 14% penetration as at end of 2015
 Global commercial telematics market is expected to reach $41 billion
  by 2020 - compounded growth rate of 16% p.a. for the next five years
 Increase in demand for safety and security by governments, business
  and individuals due to the increase in crime rates, the need to
  improve road safety and the need to decrease pollution
 Strong increase in vehicle populations
 Large and underpenetrated markets

23
OUR STRATEGY – DRIVING SHAREHOLDER VALUE

                              Shareholder value

       Robust subscriber            Sustainable              Strong cash
             and                   profit margins        flow and disciplined
        revenue growth                                    capital allocations

                      Low penetration in high growth market

24
A WELL DEFINED AND ALIGNED OPERATIONAL STRATEGY

           Global brand                    Distribution              Quality service
      Strengthen brand             Tested expansion model      Staying ahead of
       awareness and market          with prudent organic         technological trends to
       share in existing markets     growth                       enhance customer
      Build brand and trust in     Conservative allocation      experience
       new markets                   of funds into new           Continuous
                                     geographies                  improvements of our
                                    Increased sales              internal systems and
                                     capabilities in existing     software to allow our
                                     and new markets              staff to make quicker
                                                                  and more informed
                                    Improved installation        decisions
                                     management and job
                                     scheduling

25
GROWTH STRATEGY
                     2016 STRATEGIC INITIATIVES

      Start to cross sell additional features and value added services to
       our existing customer base
      Continue to organically grow in the countries where we already
       established
      Deliver more software and services to our customers as to be the
       intimate technology partner – we will focus on increasing
       adoption and usage of the Cartrack applications
        Continue to enhance our already differentiated modus operandi

26
                                                                          26
USA OFFICE OPENING IMMINENT

  The USA market has a 15% to 30% penetration rate of fleets (few
   conflicting reports)
  With the mandatory requirement for commercial drivers to keep a
   Record of Duty Status (RODS) using Electronic Driver Logs by
   December 2017, there are still over 3.1 million vehicles that require
   vehicle telematics (Driscoll & Associates 2016)
  The unit monthly selling price of existing providers in the USA
   reflects a significant opportunity for Cartrack to enter the market
   and compete aggressively
  Cartrack’s software and hardware has highly competitive
   technological features, cost pricing and reliability.
  Cartrack’s strong sales and modus operandi track record, in highly
   competitive and diverse markets, is well suited for the USA market.
  Cartrack has a proven hands on track record in customer service
   which is fundamental pillar to a successful USA operation
27
SYSTEMS ARE BUILT ON THE MOST ADVANCED
                 TECHNOLOGIES AVAILABLE

 Considerable focus and effort was placed on technology development and upgrades in 2016
 Next generation Telematics units at an advanced stage of completion
 Will provide enhanced performance and additional features
 Substantially aligned the Cartrack technology to country specific mandatory requirements
 Will cater for connectivity to networks globally
 Additional products were added to Cartrack’s range
 A unit developed to allow continuous and cost effective global roaming ability for tracking
  assets that travel internationally
 New mobile applications are being developed for continuous connectivity and
  convenience
 Project initiated for data analytics and commercial uses of the vast volumes of Telematics
  data stored
 Supply of non-personalised data for traffic flow and navigation services
28
Outlook

                             1
          P 29 I Strictly private and confidential
OUR INVESTMENT CASE
                            A well-
                       Investment   case
                          established,
                        experienced
                         and stable
                        management
                           team
     Annuity based
                                               A large and
     business model
                                             geographically
     provides strong
                                              diverse active
       visibility of
                                             subscriber base
        earnings
                       A history of strong
                            cash flow
                        generation and
                       cash conversion,
                          low financial
                         leverage and
         A well-       strong dividends
      established                            A proven track
      and proven                                 record of
      platform for                           profitability and
      growth in a                            strong financial
      high growth                                 metrics
        industry           An industry
                         leader in terms
                          of profitability
                               and
                           competitive
                              power

30
A ROBUST OUTLOOK FOR 2017

     Strong profit and cash flow expected, consistent with our track record

        Substantial growth opportunities in the telematics industry remains

        Continued global economic and foreign exchange uncertainties expected

        Opportunities in our current footprint remain and are being actively pursued

        Continued sustainable growth in South Africa is expected despite the
         economic pressures

        Good growth expected in Asia and ME, coming off a low base

        Releasing complimentary application software lending to stronger demand for
         our services

31
THE NEXT GENERATION OF COMPLIMENTARY TECHNOLOGY

WORKFORCE
OPTIMISATION

    SALES
   FORCE
OPTIMISATION

                       1
Botswana      Poland
International Offices

                        Hong Kong     Portugal
                        Indonesia     Rwanda
                        Kenya         Singapore
                        Malaysia      South Africa
                        Malawi        Spain
                        Mozambique    Swaziland
                        Namibia       Thailand
                        New Zealand   Tanzania
                        Nigeria       UAE
                        Philippines   Zimbabwe
Annexures
CARTRACK AT A GLANCE

 A leading global provider of Fleet Management, Stolen Vehicle
  Recovery and Insurance Telematics

 A diversified subscriber base with 503 000 active subscribers as at FY16
  and offices in 21 countries

 Amongst the top telematics companies globally

 A leader in a very large and underpenetrated global market

 A trusted leader in the stolen vehicle and recovery industry with an
  audited recovery rate of 94%

 Recovered in excess of 18 000 stolen vehicles since inception

 Strong visibility of earnings due to the annuity based business model

 A benchmark and consistent leader in the global Telematics industry
c
         CARTRACK AT A GLANCE (continued)

 Free regular platform upgrades for all the customers

 Free data storage for up to 5 years

 Free on-site and on-line training provided with a 24/7 help
  desk

 Free routine unit health checks

 Mobile fitment teams – installation at location of your choice

 Audited recovery rate of over 94%; own recovery
  infrastructure; 24/7 control room

 First company in the world to provide a R150k recovery
  warranty in the unlikely event of a stolen vehicle not being
  recovered
OUR PROMISE TO CUSTOMERS                                                                                    c

                      Putting you in control
                                                         Unit health
                          Real time tracking with
                           sophisticated management
                                                         checks
                           reports                       Proactive
                          Use of both GSM and RF        monitoring of all
                           technologies as a platform    tracking devices
                                                                             Value added services
                                                                             Various Products and VAS        Life Time Warranty
                                                                             to meet your needs              Life time maintenance
                                                                                                             warranty offered on
                                                                                                             Hardware

Systems and                               Support
server uptime                             24/7/365
Systems built with the                    operation Access          Recovery
most advanced                             to Fleet onsite           Independently
technologies                              training and              audited 94% recovery     Technicians
Back up servers in South                  support centre            rate
Africa, Holland, UK and                                             Dedicated in-house       Dedicated in-house
Singapore                                                           recovery teams           technicians to install
                                                                                             at a location of your
                                                                                             choice
SEGMENTAL GROWTH FOR 2015 AND 2016
R’000                           2015             2016    % change

                                        Segmental growth for 2015 and 2016
Revenue
                                                                                     Revenue
                                                                                                          3%
South Africa                  628 547         748 600         19      10% 1%                       9%
Africa – other                114 002         139 198         22                                                        SOUTH AFRICA
                                                                    14%                           14%
                                                                                                                        AFRICA-OTHER
Europe                         80 422          90 037         12
                                                                                                                        EUROPE
Asia and Middle East           11 824          27 647        134                                                 74%
                                                                                   75%                                  ASIA & ME

Total                         834 795        1 005 481        20
                                                                          2015                           2016

Profit before tax                                                         5% -2%   Profit before tax
                                                                                                        5% -2%
South Africa                  238 358         274 711         15                                                       SOUTH AFRICA
                                                                    16%                           16%
Africa – other                 46 499          60 110         29                                                       AFRICA-OTHER

Europe                         15 835          23 477         45                                                       EUROPE

                                                                                                                       ASIA & ME
Asia and Middle East          (7 078)           6 968         n/a                  81%                           81%

Total                         293 614         362 266         25          2015                           2016

                                                                          7% -2%         EBITDA     9% 1%
EBITDA
                                                                    13%                                                SOUTH AFRICA
South Africa                  298 058         355 777         20                                  13%
                                                                                                                       AFRICA-OTHER
Africa – other                 45 710          59 168         30                                                       EUROPE

Europe                         24 420          42 212         71                   82%                                 ASIA & ME
                                                                                                                 77%
Asia and Middle East          (6 586)           5 977         n/a
                                                                          2015                           2016
Total                         361 602         463 134         29
STRONG FINANCIAL GROWTH
                                  2012   2013   2014   2015   2016
Revenue               R million   448    496    633    835    1005
Gross profit          R million   348    404    503    649    819
Operating profit      R million   162    211    254    290    345
EBITDA                R million    16    211    296    362    463
Headline earnings    R million    103    137    167    191    242
Headling earnings
per share             Cents        -      -      58     64     81
Earnings per share
excl non operational
forex losses/gains    Cents        -      -      58     64     75
Net cash from
operating activities R million    144    163    215    267    261

Margins and ratios
Gross profit margin      %        78%    82%    79%    78%    81%
Overheads as a % of
sales                    %        43%    40%    41%    44%    48%
Operating profit
margin                   %        36%    43%    40%    35%    34%
EBITDA margin            %         -      -     47%    43%    46%
Annuity revenue as
% of total revenue       %        73%    76%    74%    84%    84%
OUR VALUE TO CUSTOMERS
Fact 1
Cartrack has developed technology locally for the transport industry in Indonesia. Buses
                                          Fastreal
are fitted with a telematics unit that relays  factstime information to consumers. This
technology provides operators with full control over bus routes, as it alerts them to any
deviations on the route and most importantly optimises the service for the end user – the
customer. This information includes the estimated time of arrival of the next vehicle to bus
terminals throughout the country as well as stations of information located in malls
throughout the country.

Fact 2
Cartrack made its international debut of INTEGRATE - an end-to-end managed Electronic
Monitoring Services (EMS) solution at the INTERPOL WORLD 2015 exhibition in Singapore in
May 2015. INTEGRATE allows law enforcement agencies to effectively monitor persons-of-
interest, such as offenders on extended supervision, parole, home detention or
community detention. They can also be prison inmates going through halfway care and
who are in the process of reintegrating into society. INTEGRATE is already in use in
Singapore - one of the safest cities in the world according to The Economist’s Intelligence
Unit Report 2015.

Fact 3
Cartrack has recently been appointed the preferred telematics and stolen vehicle
recovery (SVR) provider for MAN Truck & Bus in South Africa. Cartrack has a long
association with MAN, initially selected as an exclusive supplier of SVR products and
services to MAN by virtue of Cartrack’s service record and consistently high recovery rate.
This relationship has now been extended to incorporate a full fleet telematics product
and service for use by MAN clients. The agreement includes the fitment of a Cartrack
Fleet Management product to all MAN TG trucks assembled daily at the Truck & Bus
Chassis Plant in Pinetown, KwaZulu-Natal.
You can also read