Sustainable development of - E3S Web of Conferences
←
→
Page content transcription
If your browser does not render page correctly, please read the page content below
E3S Web of Conferences 244, 10037 (2021)                                 https://doi.org/10.1051/e3sconf/202124410037
EMMFT-2020

      Factors of sustainable development                                                                        of
      electronic commerce in Russian retail
      Oksana Pirogova1,* and Boris Pivovar2
      1Peterthe Great St. Petersburg Polytechnic University, 195251, 29 Polytechnicheskaya str., St.
      Petersburg, Russia
      2The Russian Presidential Academy of National Economy and Public Administration, 119571,

      Prospect Vernadskogo, 84, bldg 2, Moscow, Russia

                    Abstract. Digitalization affects many industries, including the service
                    sector. In this area, under the influence of the "digitalization" of the
                    economy, there is a tendency to transfer consumer demand to the Internet.
                    The processes of digitalization of retail trade began several years ago, but
                    during the coronavirus pandemic, they accelerated several times, as
                    evidenced by the growth of turnover of Internet companies. The aim of the
                    study is to predict the share of e-commerce in the structure of retail trade.
                    Research methods: description, comparison, analogy, generalization and
                    analysis. In the course of the study, the dynamics of retail trade, including
                    Internet trade, was analysed, the impact of the pandemic on retail trade was
                    analysed, and factors affecting structural changes in retail trade were
                    identified. On the basis of linear regression, a model of the influence of the
                    growth rate of e-commerce volumes on the growth rate of offline turnover
                    is constructed. The forecast showed an increase in e-trade turnover,
                    therefore, an increase in its share in the overall structure of retail trade. The
                    pandemic accelerated the increase in the share of Internet trade in 2020 and
                    adjusted forecasts for the following periods. The significant growth of e-
                    commerce caused by the pandemic will slow down in the coming years,
                    but the trend of buyer and seller switching to the Internet will continue,
                    which will lead to structural changes in retail.

      1 Introduction
      In the past few years, many companies have appreciated the benefits of e-commerce and
      decided to move their delivery channels for their goods and services to the Internet. In this
      regard, there is a need for high-quality storage facilities. Despite the restrictive measures
      associated with the coronavirus pandemic, the warehouse segment suffered the least due to
      the increase in demand for warehouse space from retailers and e-commerce participants.
      The popularization of e-commerce (internet trade) in the past few years has led to an
      increase in demand for warehouse space from its participants. Often, an online retailer does
      not specialize in one type of product sold, and its assortment, in comparison with a classic
      retailer, can be much wider. Therefore, it requires special characteristics of an existing or

      *
          Corresponding author: kafedra17@rambler.ru

© The Authors, published by EDP Sciences. This is an open access article distributed under the terms of the Creative Commons
Attribution License 4.0 (http://creativecommons.org/licenses/by/4.0/).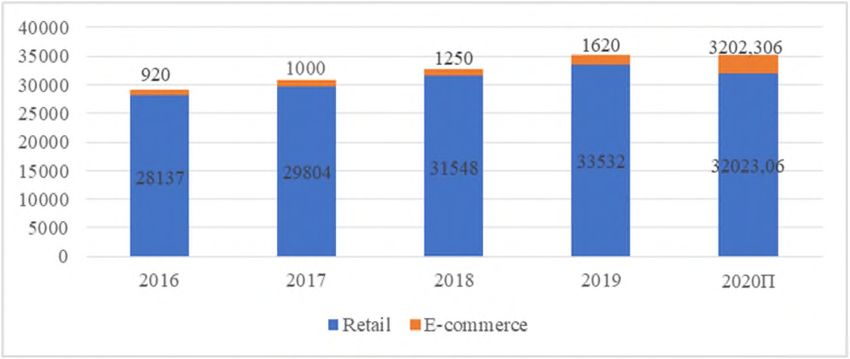
E3S Web of Conferences 244, 10037 (2021)                        https://doi.org/10.1051/e3sconf/202124410037
EMMFT-2020

      planned warehouse. The increasing complexity of the characteristics of a warehouse leads
      to an increase in the cost of its construction and maintenance; therefore, rental rates for
      such areas are higher than the market average [1]. Over the past few years, there has been
      an upward trend in the average rental rate for warehouse real estate.
          Throughout the studied period, there has been a decrease in the vacancy rate for
      warehouse space, with the exception of the first half of 2020 (Figure 1). Despite a
      significant increase in the commissioning of new space in Russia, the vacancy rate is
      decreasing, which indicates a high demand for this type of space [2].

      Fig. 1. Dynamics of the vacancy rate of warehouse premises in %, 2016-2020.
          The aim of the study is to predict changes in the dynamics of e-commerce in the
      structure of retail trade.

      2 Materials and methods
      The main trend in retail is considered to be the expansion of the presence of online retailers.
      Both new players and well-established companies that initially operated in the offline space
      go online. Online trading has a number of advantages and differences over traditional
      trading. Table 1 provides a comparative analysis of online and offline trading.
          Comparative analysis showed that online trading has a number of advantages over
      offline trading, but it is still inferior in terms of a number of factors. Given the intractable
      drawbacks of online trading, we can conclude that traditional retailers will remain in the
      market over the next decade, but the share of online trading will still increase as the quality
      of service improves [3].
          The growth driver of the presence of online retailers can be called restrictive measures
      associated with the coronavirus pandemic in 2020. The Covid-19 pandemic primarily
      affected the trade and services sector, where the fall occurred in almost all indicators. At the
      same time, companies engaged in retail trade turned out to be more prepared for the
      difficulties that arose: many by this time already had multichannel sales (through a point of
      sale, Internet platforms). Other companies in the service sector, requiring the personal
      presence of the client for the implementation of the service, almost or completely
      suspended their activities [4].
          This study used analytical methods such as description, data grouping, cause-effect
      analysis, correlation-regression analysis. The use of these methods allowed the authors to
      connect individual facts about the current state of the retail structure, thereby identifying
      the relevant realities, problems and trends in the development of this sector of the economy
      [5].

                                                     2
E3S Web of Conferences 244, 10037 (2021) https://doi.org/10.1051/e3sconf/202124410037
EMMFT-2020
Table 1. Comparative analysis of sales channels.
Criterion Offline trading Online trading
Merchandising Attraction of labor for the Use of various services of product
layout of goods in the sales recommendations; analysis of customer
area in accordance with the behavior in the network; personalized
standards; analysis of client search; responsive content, mailing lists
flows
Communications Personal communication Lack of personal communications; use
with the client; larger of chat bots, communication in
retailers use communication messengers; SMS notifications and calls
via SMS, email marketing
letters
Product A wide range of products, Mainly long-term storage goods;
categories including products for which distance selling of alcohol, cigarettes,
sale is possible only with a certain medicines, etc. is prohibited by
license law (exception: pre-order and self-
delivery of the order)
Online Using online checkouts; the Using online checkouts; cash payment
checkouts and possibility of cash upon receipt of the order, payment by
payment settlement, payment using a credit card, payment using payment
methods bank card systems
Warehouse Large networks require a For small online stores it is possible to
management wide supply chain: federal, work according to the "dropshipping"
regional, city distribution scheme - direct delivery of goods from
warehouse the supplier to the buyer, in which the
seller does not store the goods in his
warehouse, the goods are sent to the
customer from the manufacturer's
warehouse
Analysis of Analysis of the shopping The ability to analyze financial
consumer cart using loyalty cards, indicators, sales data, advertising
activity analysis of consumer flows performance and other parameters
in the store
Localization A retail facility should be Products from online stores can be
located in places where high delivered to almost anywhere in the
customer flows are world, the effectiveness of such a
concentrated in order for the business rather depends on advertising
investment to pay off and the uniqueness of the product.
Waiting time for Possibility to receive goods Delivery of goods from online stores
goods here and now, if available in most often takes from 1 day to several
the store months
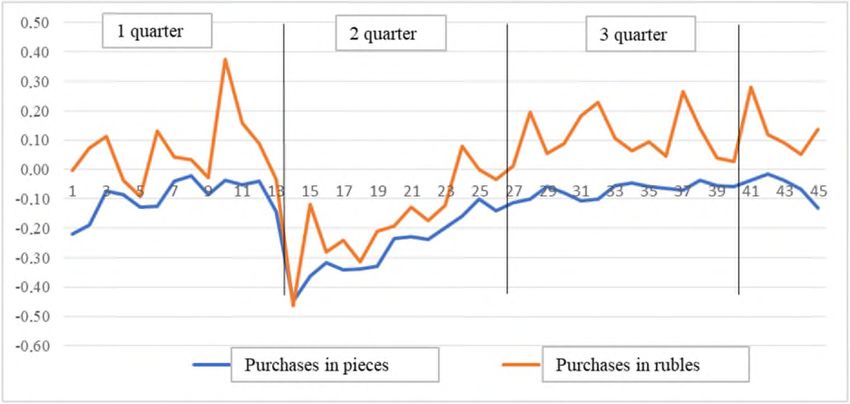
The dynamics of the index has been unstable throughout the year. At the end of the first
quarter, before the start of the restrictions, there was a significant increase in retail sales in
rubles. This is due to the unprecedented uncertainty in consumer sentiment in the coming
months. Many made purchases, fearing a shortage of goods and higher prices.
3 Results and discussion
During the second quarter, there was a decrease in consumer demand due to the
introduction of a general quarantine (Figure 2). Recovery was outlined only towards the
end of the second quarter [6, 7, 8].
As stated earlier, the retail business has proven to be more prepared for the pandemic as
it has developed multi-channel over the past few years. While few are abandoning physical
customer touchpoints, demand is still shifting to the Internet.
Online commerce in recent years has become a new driver of growth, and the
introduced quarantine restrictions have significantly accelerated the growth rates of online
3E3S Web of Conferences 244, 10037 (2021) https://doi.org/10.1051/e3sconf/202124410037
EMMFT-2020
sales both in the world and in Russia. The growth of online commerce is accompanied by
restrictions on cross-border travel, which also affects the increase in the volume of e-trade.
Figure 3 shows the dynamics of the volume of the e-commerce market in Russia from 2016
to 2020.
Fig. 2. Index of retail business activity, 2020 [1].
Figure 3 shows that the share of e-commerce turnover in the total turnover began to
grow in 2018 (from 4 to 5% in 2019) and, according to forecasts, from 5% in 2019 to 10%
by the results of 2020. The twofold increase in the share of e-turnover was influenced by
several factors [7, 9, 10, 11, 12]:
- the rise in popularity of online shopping in recent years;
- the closure of many shopping centers in Russian cities due to the pandemic, a
significant increase in online purchases;
- the appearance in recent years of delivery services in many supermarkets;
- the emergence of "dark-stores" and "dark-kitchen" (stores and services that do not
have a physical place to interact with the customer (delivery services for products
"Samokat", "Yandex-Shop", delivery of ready-made meals "Ready Kitchen SPb",
"GrowFood " etc.).
Fig. 3. The structure of trade in Russia, billion rubles [2].
According to the forecast of the consulting agency in the field of e-commerce and
digital markets "Data Insight", the average growth of e-commodity turnover from 2020 to
2024 will be 33.2% per year and by the end of the forecast period will reach 7,200 billion
rubles. Growth rates will gradually decline: 44% at the end of 2020 to 27% at the end of
4E3S Web of Conferences 244, 10037 (2021) https://doi.org/10.1051/e3sconf/202124410037
EMMFT-2020
2024. Along with the growth of e-turnover, the share of e-commerce in the total structure of
retail turnover will grow (19% in 2024 against 10% at the end of 2020). Figures 4-6 show
the predicted dynamics of the digital market in Russia [13].
Fig. 4. Volumes of e-trade in Russia, billion rubles.
Fig. 5. Growth rates of e-turnover, %.
Fig. 6. The share of e-turnover in the overall structure of turnover, %.
Since 2019, the growth rate of the market has accelerated relative to previous years due
to large-scale advertising events of Internet giants, and the arrival of new customers who
have not made online purchases before [9]. The 2020 pandemic has only accelerated this
pace and, according to the results of the five-year period, according to the Data Insight
forecast, will bring about 1.6 trillion rubles in addition. The natural growth of e-commerce
without taking into account the impact of the corona crisis (but taking into account
investments in Internet trade by the largest players) would have amounted to 26.6% over
the same period, that is, the market in 2024 would have amounted to 5.6 trillion rubles.
5E3S Web of Conferences 244, 10037 (2021) https://doi.org/10.1051/e3sconf/202124410037
EMMFT-2020
Thus, the crisis factors additionally bring 1.6 trillion rubles to online sales over five years
[13, 14].
The frequency of shopping is predicted to increase even after the end of the pandemic,
consumers in many cases will prefer online shopping instead of going to crowded shops
and malls, this factor will matter in 20 and 21 years.
Most of all, according to experts, among retail formats, hypermarkets will suffer, which
in recent years have been losing their customer flow. Customers in traditional retail are
increasingly switching from large purchases of goods for one to two weeks in a large
hypermarket to purchases several times a week, but in a supermarket “near the house”. At
the same time, long-term storage goods - the main product of hypermarkets - began to be
bought more often using delivery services to save time and effort. However, perishable
goods (vegetables, fruits, meat products) are purchased at smaller retail outlets, which will
be popular for a long time, given the particulars of delivery of goods.
In 2019, a trend emerged for the fast delivery of groceries and ready-to-eat meals.
According to research by the agency Havas Russia and Mail.ru Group, the target audience
of this segment is young people. For example, Perekrestok (X5 Retail Group) launched
Perekrestok.Bystro and Perekrestok.Vprok services, which allow you to receive ready-
made food and groceries within an hour. VkusVill also launched food delivery from 29
minutes in partnership with Gett Delivery, a food delivery service in 15 minutes, Samokat,
Yandex.Lavka. In the segment "Household appliances" there was a service of fast delivery
of goods from "M.Video" [9, 10, 11].
Table 2. Input data for analysis.
Offline
Offline E-
Retail Volume of trade
Share of trade turnover
turnover, e- turnover
e- volume, change,%
Period RUB turnover, change,%
turnover, RUB over half
billion RUB over half a
% billion, a year
[10] billion year
[2] (х)
(у)
2016 28 300 3% 27 451 849 -6% +58.4%
2017 30 749 3% 29 826 922 +8.7% +8.65%
2018 31 548 5% 30 248 1 300 +1.4% +40.9%
2019 33 532 6% 31 832 1 700 +5.2% +30.8%
2020 31 788 9% 29 288 2 500 -8.0% +47.1%
2021 22 060 11% 29 760 3 300 +1.6% +32.0%
forecast
2022 34 118 13% 29 718 4 400 -0.1% +33.3%
forecast
2023 35 073 16% 29 373 5 700 -1.2% +29.55%
forecast
2024 35 950 19% 28 750 7 200 -2.1% +26.3%
forecast
The removal of bans on distance selling of medicines, alcohol and other goods that are
currently on the “stop list” can increase the turnover of Internet commerce.
From the above facts, it follows that an active growth in the share of e-commerce in
Russia, an increase in the frequency of online purchases will lead to a decrease in the
growth rate of turnover of offline operators, and a change in trade formats. With the help of
correlation-regression analysis, we will reveal how strongly the volume of Internet trade
growth influences the change in retail trade in offline format.
The analysis was carried out in MS Office Excel using data on the volume of turnover
of offline companies and the volume of turnover of Internet commerce for 2016-2024, and
for 2H 2020-2024, forecast values were taken.
6E3S Web of Conferences 244, 10037 (2021) https://doi.org/10.1051/e3sconf/202124410037
EMMFT-2020
Correlation analysis was carried out to determine the relationship between the indicators
of the volume of offline retail trade and the volume of e-commerce. In addition, a
regression analysis was carried out using the data in Table 2 [15, 16].
To build the model, the equation of the resulting indicator was used:
y = b0 + b1x, (1)
where, у – resulting indicator (Growth rate of offline turnover, %); b0, b1 – regression
coefficients; х – factor that determines the resulting indicator (growth rate of the volume of
e-turnover, %). The results of the regression analysis performed graphically are shown in
Figure 7.
Fig. 7. Regression model of the influence of the growth rate of e-commerce volumes on the
growth rate of offline goods turnover, 2016-24.
The regression analysis performed graphically showed that the models of the influence
of factors (growth rates of e-commerce volume) on the resulting indicator (growth rates of
offline goods turnover) make sense.
The equation of the resulting indicator, built on retrospective and forecast indicators, is
as follows:
y = -0.2975x + 0.1008, (2)
where R2 = 0.642. R2 – an indicator characterizing the reliability of the constructed
regression model, which tends from 0 to 1, the closer to 1, the higher the reliability of the
model - the influence of the factor on the resulting indicator is higher. R2 for the
constructed model, it turned out to be 0.642, which indicates a normal level of dependence
of the indicators of the growth rate of offline goods turnover and the growth rate of the
volume of e-goods turnover.
The regression model is considered unreliable if the R2 score isE3S Web of Conferences 244, 10037 (2021) https://doi.org/10.1051/e3sconf/202124410037
EMMFT-2020
- changing the formats of interaction with the buyer (focus on online sales, where you
can more effectively analyze the behavior of the buyer, offering him the most advantageous
offers);
- a decrease in demand for retail real estate and an increase in demand for warehouse
(due to the fact that sales of long-term storage goods through the Internet are growing, the
need for large retail space is decreasing, but at the same time, the need for warehouse space
is growing);
- expanding the range of goods available for sale online (removal of legal restrictions on
the sale of certain goods will increase the volume of online trading and bring new players to
the market who will need additional storage space);
- it is possible to change the formats of existing retail space (for example, dividing the
total area into zones for direct sale and zones for forming online orders).
Offline trading will always be relevant, but every year its share will decrease due to an
increase in the volume of e-commerce.
The article analyzes the dynamics of retail trade: an increase in e-trade, therefore, an
increase in its share in the overall structure of retail trade; the impact of the pandemic on
retail trade is characterized: the pandemic accelerated the increase in the share of Internet
trade in 2020 and adjusted the forecasts for the following periods; the factors influencing
structural changes in retail trade are identified.
References
1. A. Ajupov, A. Sherstobitova, S. Syrotiuk, A. Karataev, International Science
Conference SPbWOSCE-2018 “Business Technologies for Sustainable Urban
Development” 110, 02040 (2019) DOI 10.1051/e3sconf/201911002040
2. A. Sergeev, L. Akhmetshina, K. Grabovyy, International Science Conference
SPbWOSCE-2018 “Business Technologies for Sustainable Urban Development” 110,
02153 (2019) DOI 10.1051/e3sconf/201911002153
3. A. Mecke, I. Lee, J.R. Baker jr., M.M. Banaszak Holl, B.G. Orr, Eur. Phys. J. E 14, 7
(2004)
4. O. Kravchenko, M. Leshchenko, D. Marushchak, Y. Vdovychenko, S. Boguslavska,
The 8th International Conference on Monitoring, Modeling & Management of
Emergent Economy 65, 07004, (2019) DOI 10.1051/shsconf/20196507004
5. E. Voskresenskaya, L.Vorona-Slivinskaya, L. Achba, Environmental and Resource
Economics 164, 09016, (2020) DOI 10.1051/e3sconf/202016409016
6. O. Pirogova, E. Gorin, V. Plotnikov, The algorithms for the environmental finance
based on adjusted present value models, E3S Web of Conferences 91, 08021 (2019)
7. V. Plotnikov, O. Pirogova, Key Competencies as an Enterprise Value Management
Tool, IBIMA 2018, 1716-1721 (2018)
8. J. Yoshida, The economic depreciation of real estate: Cross-sectional variations and
their return implications, Pacific-Basin Finance Journal 61, 101290 (2020)
https://doi.org/10.1016/j.pacfin.2020.101290
9. M. Martín-Peña, J. Sánchez-López, E. Díaz-Garrido, Servitization and digitalization in
manufacturing: the influence on firm performance, Journal of Business & Industrial
Marketing 35(3), 564–574 (2018) https://doi.org/10.1108/JBIM-12-2018-0400
10. E. Fang, W.R. Palmatier, J.-B.E. Steenkamp, Effect of Service Transition Strategy on
Firm Value, Journal of Marketing 72, 1-14 (2008) https://doi.org/10.1509/jmkg.72.5.1
8E3S Web of Conferences 244, 10037 (2021) https://doi.org/10.1051/e3sconf/202124410037
EMMFT-2020
11. M.M. Hasan, Corporate life cycle, organizational financial resources and corporate
social responsibility, Journal of Contemporary Accounting & Economics 13, 20-36
(2017) DOI: 10.1016/j.jcae.2017.01.002
12. K.M. Bakarich, M. Hossain, J. Weintrop, Different time, different tone: Company life
cycle, Journal of Contemporary Accounting and Economics 15(1), 69-86 (2019)
https://doi.org/10.1016/j.jcae.2018.12.002
13. O. Pirogova, V. Plotnikov, Z. Popovic, et al. The Multi-level Model of the Service
Enterprises Human Capital Value. (Eds.): TransSiberia 2019, AISC 1116, 738–747
(2020) https://doi.org/10.1007/978-3-030-37919-3_73M.
14. A.A. Salisu, I.D. Raheem, U.B. Ndako, The inflation hedging properties of gold, stocks
and real estate: A comparative analysis, Resources Policy 66, 101605 (2020)
https://doi.org/10.1016/j.resourpol.2020.101605
15. Ya. Li, D. Zhu, J. Zhao, X. Zheng, L. Zhang, Effect of the housing purchase restriction
policy on the Real Estate Market: Evidence from a typical suburb of Beijing, China,
Land Use Policy 94, 104528 (2020) https://doi.org/10.1016/j.landusepol.2020.104528
16. V. Skribans, M. Jurušs, M. Demianchuk, N. Maslii, D. Pastory, Real estate
announcements monitoring dataset for Latvia 2018, Data in Brief. 28, 105064 (2020)
https://doi.org/10.1016/j.dib.2019.105064
9You can also read