RESEARCH Retail Trends Report - South African Property ...
←
→
Page content transcription
If your browser does not render page correctly, please read the page content below

RESEARCH Retail Trends Report

RESULTS FOR THE QUARTER
ENDED DECEMBER 2019.
MARCH 2020

Key Research Findings
South African shopping centre trading performance as measured by the MSCI South Africa Quarterly Retail
Trading Density Index, recorded another quarter of positive growth notwithstanding the uniquely challenging
operating environment.

Trading density growth (sales per square meter; annualised), came in at +6.1% year on year (y/y) to
December 2019 in current price termsÐ stable on the revised +6.1% recorded for the year to September
2019.

The 6.1% y/y increase in trading density was a function of a positive 6.9% sales growth & a 0.8% increase
in the amount of reported trading area (i.e. a dilutionary impact).

The sales growth figure of 6.9% was higher than StatsSAÕs nominal retail sales growth of 3.8% y/y for the
year ending December 2019, highlighting the relative defensiveness of malls, especially in a recessionary
environment.

The trade in large format centres has stagnated while the smaller retail formatsÊ have accelerated. The
positive performance of the Neighbourhood retail segment in particular has been noteworthy.

However, this outperformance needs to be viewed in context as the neighbourhood retail segment
underperformed the other segments from 2013 to mid-2016 . The recent growth has brought the neighbourhood
centre segment back in line with the other retail segments rather than outpacing them.

Close to half of the segmentÕs recent growth has been driven by the Food category (7.1% out of 15.2%).

RetailerÕs cost of occupancy, defined as the ratio of gross rental to sales, continued its upward trend. An
increase of 10bp y/yÊ to December 2019 brings the ratio to 8.0% across the 100+ measured centres.

On a segment level, Super Regional centreÕs cost of occupancy is currently at an all-time high and significantly
higher than the other segments.

The average vacancy rate of the 100+ shopping centres forming part of the MSCI Retail Trading Density
Index was recorded at 4.6% at December 2019, 20bps up on the previous quarter.

On a segment level, the lowest rate of vacancy is in the Regional shopping centre segment at 3.2%. This
may seem surprising, bearing in mind that this segment has see the lowest level of ATD growth. However,
keeping the vacancy rate down has come at a cost as gross rental has only increased by 3.5% suggesting
negative reversions on renewal and re-letting.

                             T: (011) 883 0679 F: (011) 883 0684
                             Email: marketingmanager@sapoa.org.za                                              02
                             Web: www.sapoa.org.za
RESULTS FOR THE QUARTER
ENDED DECEMBER 2019.
MARCH 2020

 Headline Performance
South African shopping centre trading performance as measured by the MSCI South Africa Quarterly Retail
Trading Density Index, recorded another quarter of positive growth notwithstanding the uniquely challenging
operating environment.

Trading density growth (sales per square meter; annualised), came in at +6.1% year on year (y/y) to December
2019 in current price termsÐ stable on the revised +6.1% recorded for the year to September 2019 (Fig 1).

The index is based on data collected by MSCI Real EstateÕs Retail Performance Benchmarking Service which
quantifies sales performance as well as other key retail performance metrics across 24 merchandise categories
in more than 100 retail centres, covering just shy of 5 million square meters.
The 6.1% y/y increase in trading density was a function of a positive 6.9% sales growth & a 0.8% increase
in the amount of reported trading area (i.e. a dilutionary impact).
The sales growth figure of 6.9% was higher than StatsSAÕs nominal retail sales growth of 3.8% y/y for the year
ending December 2019 (annual growth of Jan-Dec Ô19 on the same period a year before). This continues the
trend of mall-based retailers outperforming the broader market and highlights the relative defensiveness of
malls, especially in a recessionary environment.

                             T: (011) 883 0679 F: (011) 883 0684
                             Email: marketingmanager@sapoa.org.za                                           03
                             Web: www.sapoa.org.za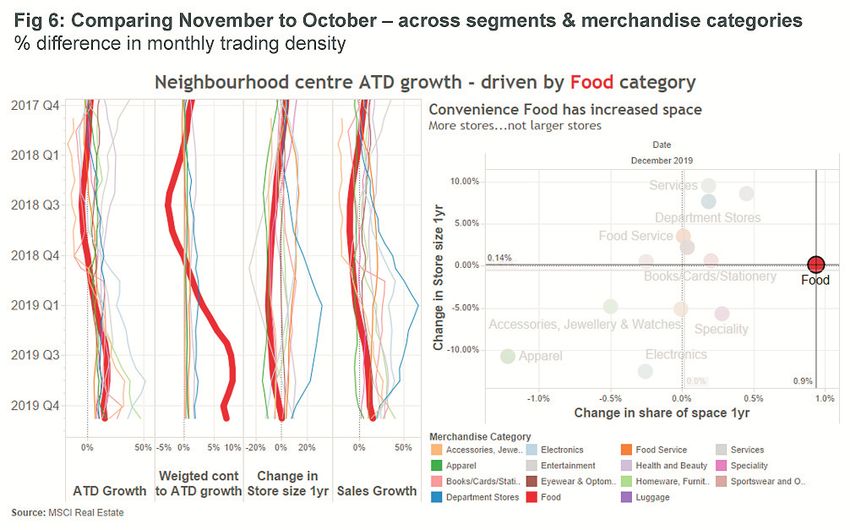
RESULTS FOR THE QUARTER
ENDED DECEMBER 2019.
MARCH 2020

Key economic drivers for the retail sector

               T: (011) 883 0679 F: (011) 883 0684
               Email: marketingmanager@sapoa.org.za   04
               Web: www.sapoa.org.za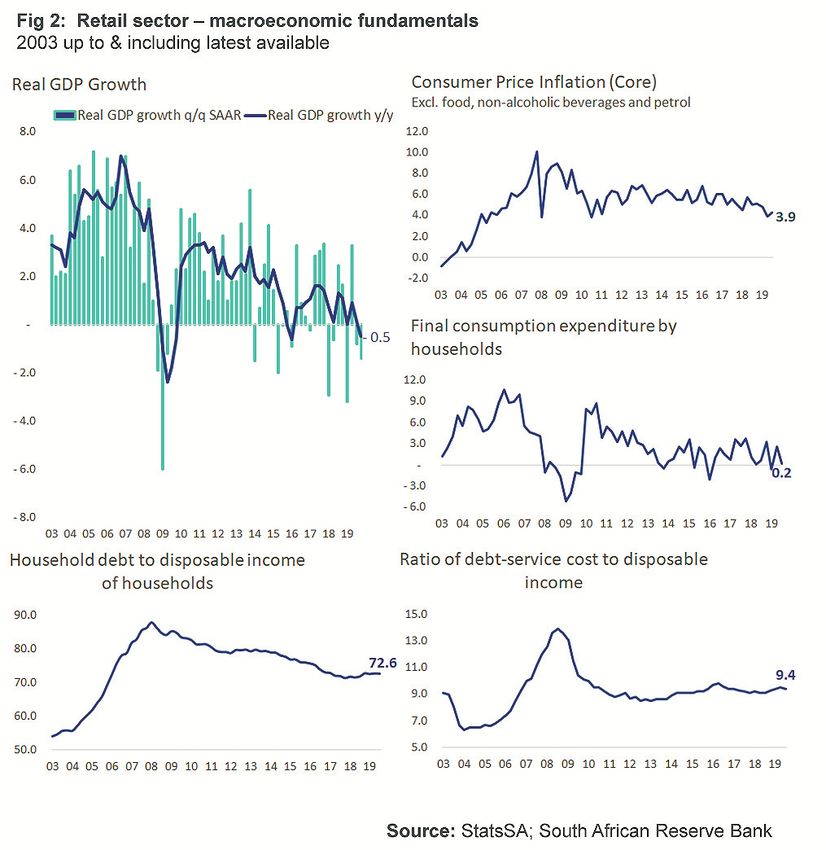
RESULTS FOR THE QUARTER
ENDED DECEMBER 2019.
MARCH 2020

 Drivers of trading density growth
As alluded to earlier in the report, trading density growth of +6.1% comprised a 6.9% growth in sales while
reported trading area was up 0.8% (i.e. a dilutionary impact). Looking at it from another perspective, trading
density growth was a function of spend per head increasing by 1.5% while aggregate footcount/sqm grew by
4.5% (Fig 3)

Footcount Ð expressed per square meter Ðhas now ticked up every month since April 2019 and encouragingly,
grew at its fastest rate since December 2012 (Fig 4). Of concern though will be the fact that Spend per Head
growth dipped into the low single digits at 1.5% y/y. So, shoppers are starting to visit malls more frequently
but critically are not maintaining their spend per visit - possibly spreading out roughly the same level of spend
over more trips.

Over the long term, the growth in the amount spent per visitor has been the primary driver of trading density
growth and a further decline in this figure may see overall trading density decline impacting tenantÕs cost of
occupancy and consequently landlordÕs net income growth.

                             T: (011) 883 0679 F: (011) 883 0684
                             Email: marketingmanager@sapoa.org.za                                             05
                             Web: www.sapoa.org.za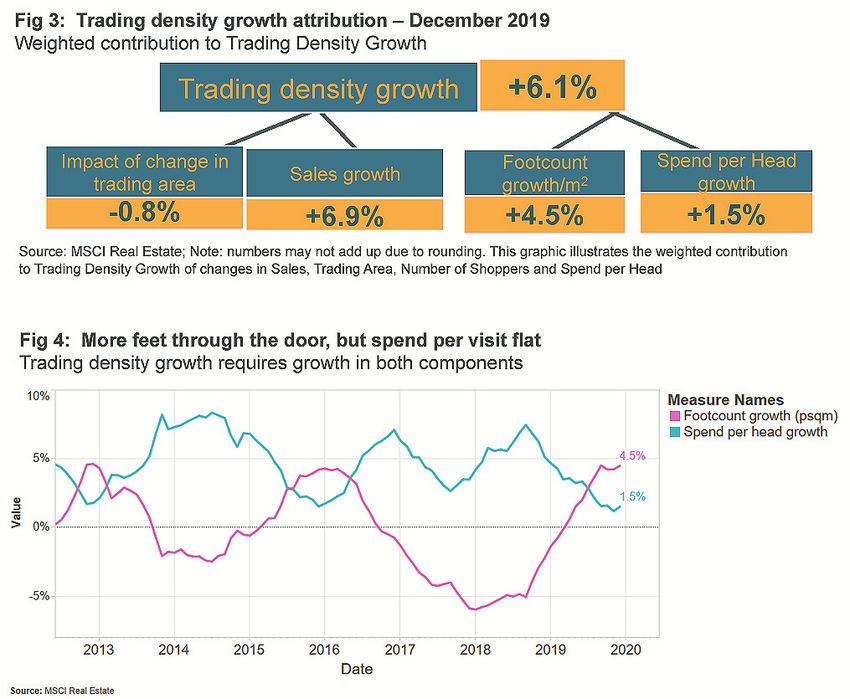
RESULTS FOR THE QUARTER
ENDED DECEMBER 2019.
MARCH 2020

  Sales Performance
The South African economy remains in a perilous state. Business confidence plunged to its lowest level in more
than two decades in the first quarter of 2020 and could weaken even further as the full effect of the coronavirus
and oil price crash filters through to the domestic and global economy. Retail sales growth is weighed down by
weak consumer confidence, muted demand, high rates of unemploymentÊ and load-shedding.

Despite these headwinds, annualised trading density growth as measured by the MSCI South Africa Quarterly
Retail Trading Density Index, has now been positive since the second quarter of 2018. Overall, the trading
density for December 2019 increased by 6.1% versus December of 2018 which translates to a 2% growth when
adjusted for inflation.
However, looking only at the headline figures in isolation can be deceiving. At an aggregate level, annualised
trading density growth has been mainly driven by the smaller retail formats (Fig 5) which have benefitted as
shoppers favour convenience centres for an increasing proportion of their spend.

Excluding Community and Neighbourhood centres drops the overall growth to 2.1% which is about half of the
current consumer price inflation rate.Ê The three larger retail formats havenÕt seen their sales per square meter
grow faster than inflation since 2016. Regional shopping centres, in particular, are still having a tough time of it
and only grinded out a 0.8% growth (-3% after inflation). Regional centres (GLA of 50-100k sqm) rarely dominate
their catchment areas anymore (especially those in metro areas) and compete against smaller, convenience
centres and larger malls with more tenants and longer trading hours.

Among the five largest merchandise categories, Electronics stores continue to perform well with an annualised
trading density growth of 9.3% for the year ended December 2019. The Food Service category (comprising
restaurants, fast food and the like) and Department Stores also reported ATD growths in excess of 6.5% y/y.

                              T: (011) 883 0679 F: (011) 883 0684
                              Email: marketingmanager@sapoa.org.za                                             06
                              Web: www.sapoa.org.za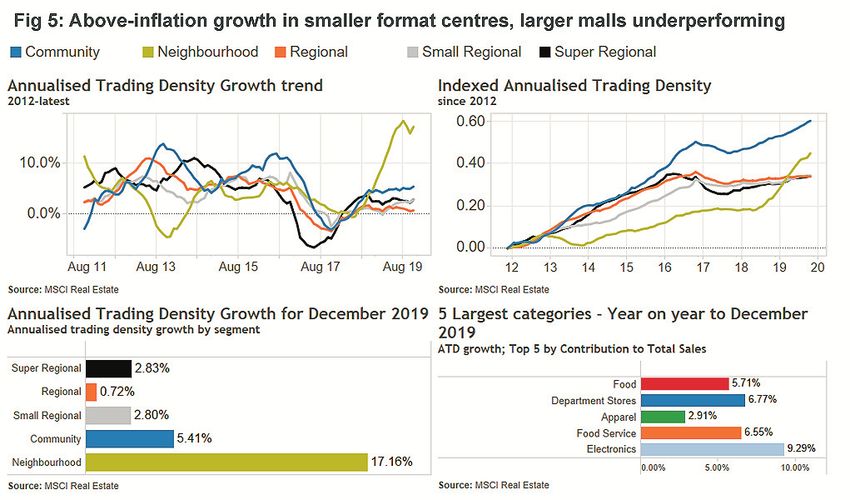
RESULTS FOR THE QUARTER
ENDED DECEMBER 2019.
MARCH 2020

 Food has driven neighbourhood
 centre performance
As illustrated in Figure 5, the trade in large format centres has stagnated while the smaller retail formatsÊ
have accelerated. The positive performance of the Neighborhood retail segment in particular has been
noteworthy. For the year ended December 2019, the segment recorded a year on year growth of 17.2%.

However, this outperformance needs to be viewed in context as the neighborhood retail segment underperformed
the other segments from 2013 to mid-2016 . The recent growth has brought the neighborhood centre segment
back in line with the other retail segments rather than outpacing them.

A deeper analysis of the neighbourhood retail segment reveals that close to half of the segmentÕs recent
growth has been driven by the Food category (7.1% out of 17.2%). As at December 2019, the Food category
contributes 48.2% of Neighbourhood centresÕ total sales underlining its importance to the segmentÕs fortunes
Ð especially considering that it occupies ÔonlyÕ 30.8% of GLA while paying 22.7% of total gross rental.

An important point to make is that the improved trading density growth of Food retailers has been mainly
landlord-driven via active management and right-sizing, rather than consumer driven via an increased spend.

From late 2012 to the end of 2019, the average Food RetailerÕs store area declined by 17.8%, while the
average turnover per store declined by a lower 6.3%.

                            T: (011) 883 0679 F: (011) 883 0684
                            Email: marketingmanager@sapoa.org.za                                            07
                            Web: www.sapoa.org.za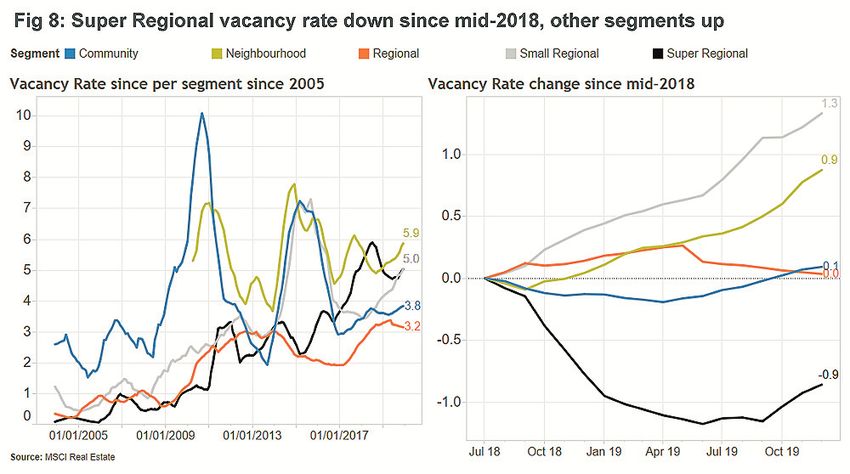
RESULTS FOR THE QUARTER
ENDED DECEMBER 2019.
MARCH 2020

 Retailer cost of Occupancy
RetailerÕs cost of occupancy, defined as the ratio of gross rental to sales, continued its upward trend as rental
growth marginally outpaced sales growth. An increase of 10bp y/yÊ to December 2019 brings the ratio to 8.0%
across the 100+ measured centres.
On a segment level, Super Regional centreÕs cost of occupancy is currently at an all-time high and significantly
higher than the other segments. While Super Regional centres attract more shoppers and spend, its current
cost of occupancy may see retailers becoming more selective in their approach to the segment. Should they
be present in all Super Regional centres? If so, should they be more flexible about their store size and trading
model? Does the increased costs of occupancy necessitate greater investment in their online capability to
complement their physical footprint?

As at December 2019, Super Regional tenants pay R11.57 towards their gross rental for every R100 in sales,
followed by the Regional and Small Regional segments at R9.11 and R8.66 respectively (Fig 7).

The Super Regional and Small Regional segments in particular has seen a significant increase in tenant
occupancy costs since 2016.

Neighbourhood retail was the only segment that saw its cost of occupancy improve on a year over year basis
Ð a 20bp improvement to 5.3%. Cost of occupancy in the smaller retail formats remain significantly lower than
that of larger malls and are now well below 2016 levels as a result of an improved occupancy rate and inflation-
plus sales growth.

                             T: (011) 883 0679 F: (011) 883 0684
                             Email: marketingmanager@sapoa.org.za                                            08
                             Web: www.sapoa.org.za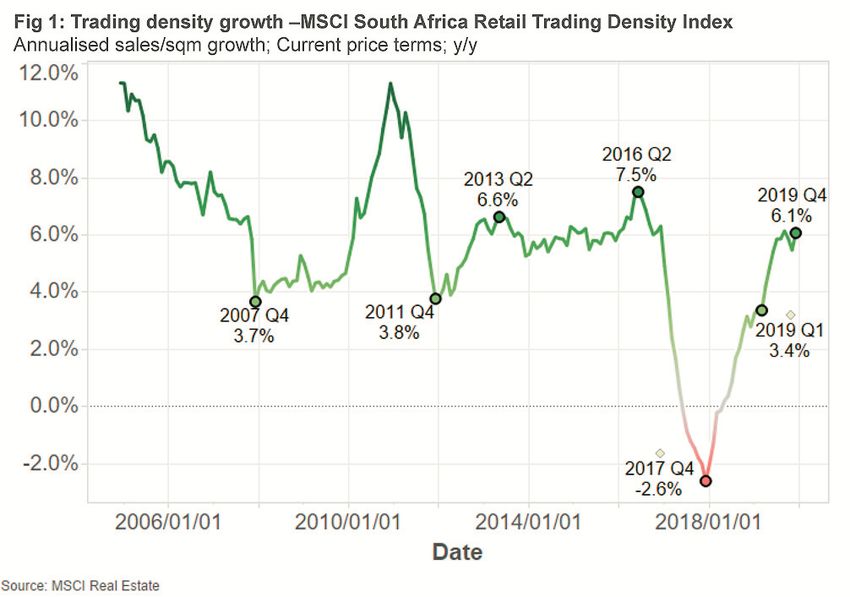
RESULTS FOR THE QUARTER
ENDED DECEMBER 2019.
MARCH 2020

  Retail Vacancy Rates
The average vacancy rate of the 100+ shopping centres forming part of the MSCI Retail Trading Density Index
was recorded at 4.6% at December 2019, 20bps up on the previous quarter.
On a segment level, the lowest rate of vacancy is in the Regional shopping centre segment at 3.2%. This may
seem surprising, bearing in mind that this segment has see the lowest level of ATD growth. However, keeping
the vacancy rate down has come at a cost as gross rental has only increased by 3.5% suggesting negative
reversions on renewal and re-letting.

The Community centre segment is next lowest at 3.8%, although vacancy in the segment has slowly trended
higher (Fig 8)

ItÕs important to maintain a sense of scale when comparing the different retail segments. A vacancy rate of 5%
in a typical Super Regional Centre equates to around 6,000sqm of empty store space while 5% for a Neighbourhood
centre means a not insignificant, but possibly more manageable 500sqm.

Given the challenging operating environment, filling 6,000sqm of Super Regional space is no small order Ð
given that most major retailers will already command a presence in malls of that size as well as heightened
cautiousness relating to store expansion and a declining pool of smaller-format tenants.
Since mid-2018, the vacancy rate of the Super Regional segments is down 90bps while that of the Small
Regional segment is up 130bps.
In the context of a 40,000sqm Small Regional centre, 110bps works out to 520sqm of additional vacancy
compared to a year ago, resulting in additional costs relating to reinstatement and TI, letting and administration
as well as lost rental within, and possibly beyond the initial beneficial occupation periods.

                              T: (011) 883 0679 F: (011) 883 0684
                              Email: marketingmanager@sapoa.org.za                                             09
                              Web: www.sapoa.org.za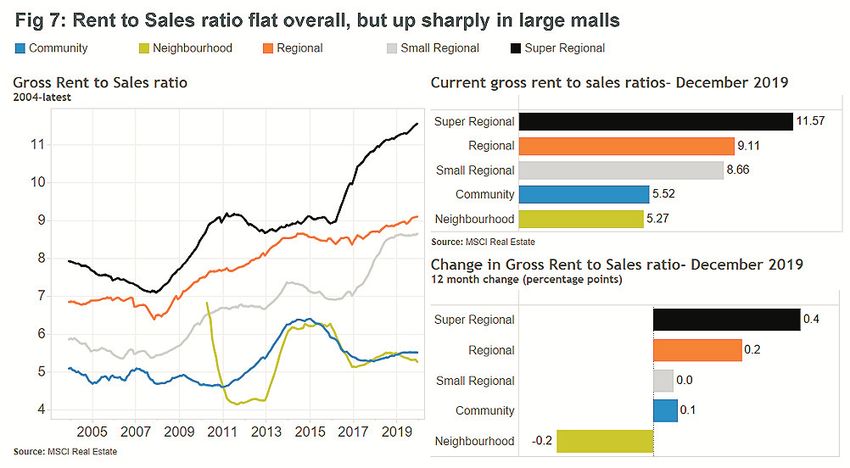
RESULTS FOR THE QUARTER
ENDED DECEMBER 2019.
MARCH 2020

 About the Sample
The IPD Retail sample consists of around 100 shopping centres across all geographies & centre types owned
by listed real estate investment trusts, life & pension funds as well as private property funds.

The full quarterly results from 2003 onwards are available for 24 merchandise categories across 5 retail formats
Ð from super regional down to neighbourhood centres. To subscribe to this quarterly publication
please contact realestate@msci.com

  SHOPPING CENTRE DEFINITION TYPES
  Super Regional shopping centreÊ            > 100,000sqm
  Regional shopping centreÊ                  50,000-100,000sqm
  Small Regional shopping centreÊ            25,000-50,000sqm
  Community shopping centreÊ                 12,000-25,000sqm
  Neighbourhood shopping centreÊ Ê           5,000-12,000sqm

                              T: (011) 883 0679 F: (011) 883 0684
                              Email: marketingmanager@sapoa.org.za                                         10
                              Web: www.sapoa.org.za
RESULTS FOR THE QUARTER
ENDED DECEMBER 2019.
MARCH 2020
NOTICE AND DISCLAIMER
This document and all of the information contained in it, including without limitation all text, data, graphs, charts (collectively, the ÒInformationÓ) is
the property of MSCI Inc. or its subsidiaries (collectively, ÒMSCIÓ), or MSCIÕs licensors, direct or indirect suppliers or any third party involved in making
or compiling any Information (collectively, with MSCI, the ÒInformation ProvidersÓ) and is provided for informational purposes only.Ê The Information
may not be modified, reverse-engineered, reproduced or redisseminated in whole or in part without prior written permission from MSCI.
The Information may not be used to create derivative works or to verify or correct other data or information.ÊÊ For example (but without limitation),
the Information may not be used to create indexes, databases, risk models, analytics, software, or in connection with the issuing, offering, sponsoring,
managing or marketing of any securities, portfolios, financial products or other investment vehicles utilizing or based on, linked to, tracking or otherwise
derived from the Information or any other MSCI data, information, products or services.Ê
The user of the Information assumes the entire risk of any use it may make or permit to be made of the Information.Ê NONE OF THE INFORMATION
PROVIDERS MAKES ANY EXPRESS OR IMPLIED WARRANTIES OR REPRESENTATIONS WITH RESPECT TO THE INFORMATION (OR THE
RESULTS TO BE OBTAINED BY THE USE THEREOF), AND TO THE MAXIMUM EXTENT PERMITTED BY APPLICABLE LAW, EACH INFORMATION
PROVIDER EXPRESSLY DISCLAIMS ALL IMPLIED WARRANTIES (INCLUDING, WITHOUT LIMITATION, ANY IMPLIED WARRANTIES OF
ORIGINALITY, ACCURACY, TIMELINESS, NON-INFRINGEMENT, COMPLETENESS, MERCHANTABILITY AND FITNESS FOR A PARTICULAR
PURPOSE) WITH RESPECT TO ANY OF THE INFORMATION.
Without limiting any of the foregoing and to the maximum extent permitted by applicable law, in no event shall any Information Provider have any
liability regarding any of the Information for any direct, indirect, special, punitive, consequential (including lost profits) or any other damages even if
notified of the possibility of such damages. The foregoing shall not exclude or limit any liability that may not by applicable law be excluded or limited,
including without limitation (as applicable), any liability for death or personal injury to the extent that such injury results from the negligence or willful
default of itself, its servants, agents or sub-contractors.Ê
Information containing any historical information, data or analysis should not be taken as an indication or guarantee of any future performance,
analysis, forecast or prediction.Ê Past performance does not guarantee future results.Ê
The Information should not be relied on and is not a substitute for the skill, judgment and experience of the user, its management, employees,
advisors and/or clients when making investment and other business decisions.Ê All Information is impersonal and not tailored to the needs of any
person, entity or group of persons.
None of the Information constitutes an offer to sell (or a solicitation of an offer to buy), any security, financial product or other investment vehicle or
any trading strategy.
It is not possible to invest directly in an index.Ê Exposure to an asset class or trading strategy or other category represented by an index is only
available through third party investable instruments (if any) based on that index.ÊÊ MSCI does not issue, sponsor, endorse, market, offer, review or
otherwise express any opinion regarding any fund, ETF, derivative or other security, investment, financial product or trading strategy that is based
on, linked to or seeks to provide an investment return related to the performance of any MSCI index (collectively, ÒIndex Linked InvestmentsÓ). MSCI
makes no assurance that any Index Linked Investments will accurately track index performance or provide positive investment returns.Ê MSCI Inc.
is not an investment adviser or fiduciary and MSCI makes no representation regarding the advisability of investing in any Index Linked Investments.
Index returns do not represent the results of actual trading of investible assets/securities. MSCI maintains and calculates indexes, but does not
manage actual assets.
Index returns do not reflect payment of any sales charges or fees an investor may pay to purchase the securities underlying the index or Index Linked
Investments. The imposition of these fees and charges would cause the performance of an Index Linked Investment to be different than the MSCI
index performance.
The Information may contain back tested data.Ê Back-tested performance is not actual performance, but is hypothetical.Ê There are frequently material
differences between back tested performance results and actual results subsequently achieved by any investment strategy.Ê
Constituents of MSCI equity indexes are listed companies, which are included in or excluded from the indexes according to the application of the
relevant index methodologies. Accordingly, constituents in MSCI equity indexes may include MSCI Inc., clients of MSCI or suppliers to MSCI.Ê
Inclusion of a security within an MSCI index is not a recommendation by MSCI to buy, sell, or hold such security, nor is it considered to be investment
advice.
Data and information produced by various affiliates of MSCI Inc., including MSCI ESG Research Inc. and Barra LLC, may be used in calculating
certain MSCI indexes.Ê More information can be found in the relevant index methodologies on www.msci.com.
MSCI receives compensation in connection with licensing its indexes to third parties.Ê MSCI Inc.Õs revenue includes fees based on assets in Index
Linked Investments. Information can be found in MSCI Inc.Õs company filings on the Investor Relations section of www.msci.com.
MSCI ESG Research Inc. is a Registered Investment Adviser under the Investment Advisers Act of 1940 and a subsidiary of MSCI Inc.Ê Except with
respect to any applicable products or services from MSCI ESG Research, neither MSCI nor any of its products or services recommends, endorses,
approves or otherwise expresses any opinion regarding any issuer, securities, financial products or instruments or trading strategies and MSCIÕs
products or services are not intended to constitute investment advice or a recommendation to make (or refrain from making) any kind of investment
decision and may not be relied on as such. Issuers mentioned or included in any MSCI ESG Research materials may include MSCI Inc., clients of
MSCI or suppliers to MSCI, and may also purchase research or other products or services from MSCI ESG Research.Ê MSCI ESG Research materials,
including materials utilized in any MSCI ESG Indexes or other products, have not been submitted to, nor received approval from, the United States
Securities and Exchange Commission or any other regulatory body.
Any use of or access to products, services or information of MSCI requires a license from MSCI.Ê MSCI, Barra, RiskMetrics, IPD, FEA, InvestorForce,
and other MSCI brands and product names are the trademarks, service marks, or registered trademarks of MSCI or its subsidiaries in the United
States and other jurisdictions.Ê The Global Industry Classification Standard (GICS) was developed by and is the exclusive property of MSCI and
Standard & PoorÕs.Ê ÒGlobal Industry Classification Standard (GICS)Ó is a service mark of MSCI and Standard & PoorÕs.
T: (011) 883 0679 F: (011) 883 0684
Email: marketingmanager@sapoa.org.za 11
Web: www.sapoa.org.zaSAPOA - South African Property Owners Association T: (011) 883 0679 - F: (011) 883 0684 Email: marketingmanager@sapoa.org.za Web: www.sapoa.org.za Physical: Paddock View, Hunt's End Office Park, 36 Wierda Road West, Wierda Valley, Sandton Postal: P O Box 78544, Sandton 2146 Report compiled by:
You can also read