Uncovering Retailers' Thoughts and Sentiment - RETAIL RESEARCH - KNIGHT FRANK SINGAPORE RETAILERS' SENTIMENT SURVEY 2018
←
→
Page content transcription
If your browser does not render page correctly, please read the page content below

RETAIL RESEARCH

KNIGHT FRANK SINGAPORE
RETAILERS’ SENTIMENT SURVEY 2018

Uncovering Retailers’
Thoughts and Sentiment

                                   Knight Frank Research   1
A RESPITE FOR
                                      SINGAPORE’S RETAIL
                                         SECTOR IN 2017
                            Singapore’s retail scene has been under the spotlight as structural
                            shifts in consumer demand, competition and mode of retailing has
                            evolved faster than before. The health of Singapore retail also hinges
                            on consumer sentiments and economic performance, which saw
                            improvements in 2017. After witnessing negative retail sales growth
                            since 2014, the retail landscape finally saw a modest respite, recording
                            a 1.3% overall yearly increase in Retail Sales Index (RSI) for 2017.

                            The uptick in retail sales is a reprieve for retailers, as they contend
                            with stronger headwinds in a competitive landscape which has yet to
                            lift demand for retail space. According to the Urban Redevelopment
                            Authority (URA), the average annual occupancy for island-wide retail
                            slipped from the high of 94.9% in 2013 to 92.2% in 2017. Retail
                            rents in the Central Region also fell for the third consecutive year and
                            recorded negative growth of 15.9% between Q1 2015 and Q4 2017.
                            Despite the sharp decline in retail rents, island-wide prime retail rents
                            tracked by Knight Frank Research held relatively firm, falling only 1.3%
                            per cent y-o-y to S$30.70 per square foot per month (psf pm) in 2017.
                            Compared to its last peak in 2013 ($32.60 psf pm), island-wide prime
                            retail rents declined by 5.9%. Average yearly rents across different areas
                            in Singapore for 2017 saw varying extents of annual decline, with the
                            Marina Centre, City Hall and Bugis areas facing the greatest downward
                            pressure (-5.0%), followed by the suburban areas (-1.7%).

                            Come 2018, an estimated 2.1 million square feet (Nett Lettable Area)
                            of potential new retail space will come onstream, bringing total island-
                            wide retail space to 67.4 million square feet for the entire year ahead.
                            This onslaught of retail space could further exert downward pressure
                            on retail rents and occupancy.

                            Faced with a mixed bag of performance indicators and the wave of
                            structural change in consumer demand that is to come, what are some
                            of the key business considerations and strategies that local retailers are
                            likely to adopt in 2018?

2   Knight Frank Research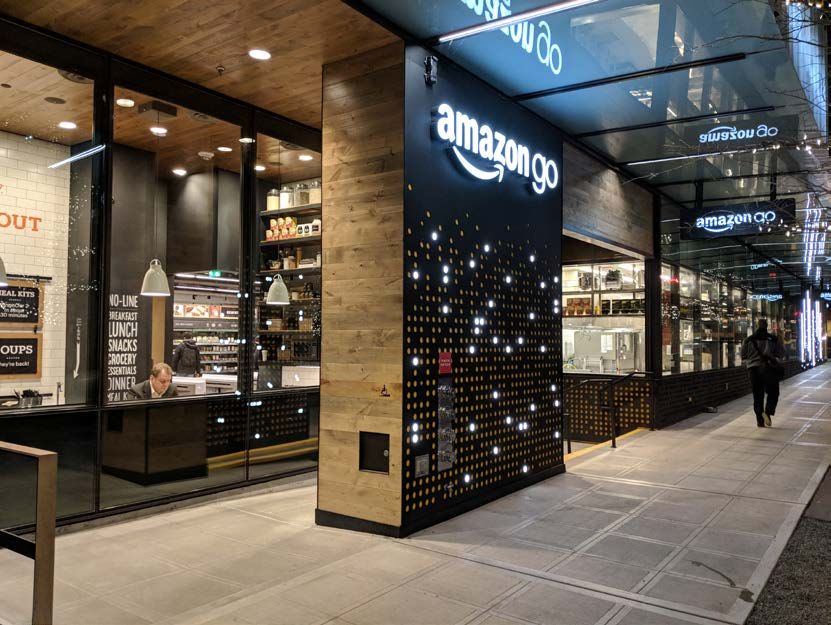
Knight Frank Retailers’ Sentiment Survey 2018

     Uncovering retailers’
   thoughts and sentiment
 While many retailers have jumped on the bandwagon and
  developed an online presence alongside physical stores,
    retailers are gradually recognising the importance of
seamless integration between the physical and online realm.

01.                            02.
Business outlook               The importance of
improves; Challenges           physical store presence
continue to stem from
cost and labour
03.                            04.
Strengthening                  Relevance of bricks to
the physical store             stay and evolve to new
experience                     experience

                                                          Knight Frank Research   3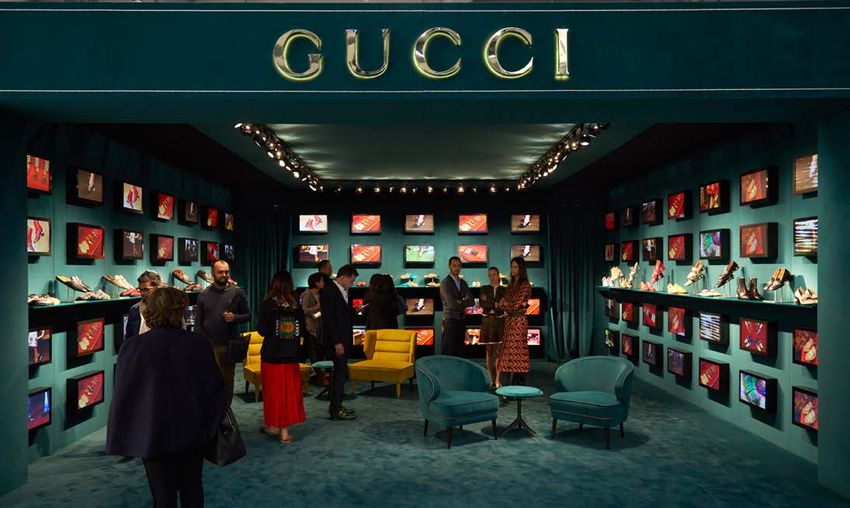
01.
                                      BUSINESS OUTLOOK IMPROVES;
                                        CHALLENGES CONTINUE TO
                                      STEM FROM COST AND LABOUR

      Knight Frank Singapore carried out its annual Retailers’         EXHIBIT 2
      Sentiment Survey in 2018, its third instalment since 2015,       SENTIMENT ON BUSINESS PROFITABILITY
      with 55 Singapore-based retailers with an Asia-Pacific
      (APAC) presence.
                                                                       25.5%                                                    54.5%
      The top three countries outside of Singapore which               Expect a                                                 Anticipate
                                                                       scale-back                                                 Positive
      retailers have handpicked to establish a retail presence                                                                    Growth
      within APAC are Malaysia, Indonesia and Australia.

      EXHIBIT 1
      TOP THREE OVERSEAS MARKETS WITH RETAIL
      OUTLET PRESENCE

                                                                       20.0%
                                                         Malaysia      Predict similar
             1ST                                         62 stores
                                                                       levels of profit as
                                                                       previous year

                                                                       Source : Knight Frank Retailers’ Sentiment Survey 2018

                                                                       similar sentiments last year and were the most optimistic,
                                                         Indonesia
             2  ND
                                                         31 stores
                                                                       with 35.3% envisaging at least a 10% growth margin in
                                                                       business profitability in 2018. The other key trades of
                                                                       Education and Enrichment, Fashion and Accessories, and
                                                                       Health, Fitness and Wellness saw a mixed-bag of growth
                                                                       expectations. This optimism by retailers dovetails with
                                                          Australia    improving consumer confidence levels seen in the region.
             3RD                                         10 stores     The Mastercard Index of Consumer Confidence showed
                                                                       that consumers in Singapore, Malaysia, Indonesia
                                                                       and Australia reported an upward shift in their levels of
      Source : Knight Frank Retailers’ Sentiment Survey 2018           optimism in H1 2017.

      54.5% of respondents anticipated positive growth in              Notwithstanding the improved sentiment, retailers have
      business profitability in 2018, while 25.5% expect a scale-      to grapple with key issues of business cost and labour.
      back. The remaining 20.0% predict similar levels of profits      The survey revealed the key business challenges for
      as the year before. In contrast, business sentiments were        retailers (Exhibit 3). Cost of rental, in particular, remains
      bleaker in 2017, where only 48.1% of retailers anticipated       the chief challenge for the respondents. Notably, retailers
      a positive growth in business profitability, while a higher      demonstrated growing concerns over consumers’ online-
      proportion of 36.5% expected a dip in the same year.             buying behaviour over the last three years, though it is still
      Retailers from the Food and Beverage service-line (i.e.          ranked as the business challenge they are least concerned
      restaurants, cafes, kiosks, bar, pubs, etc.) reflected           about for now.

4   Knight Frank Research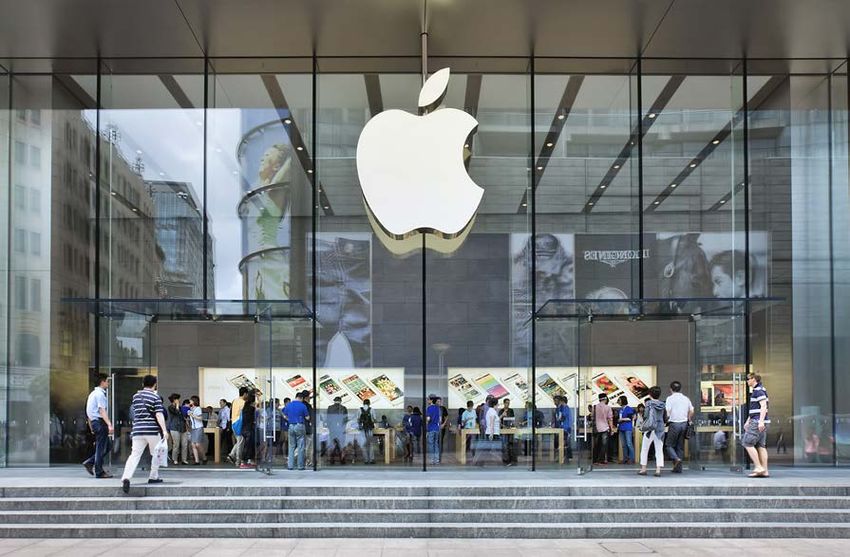
EXHIBIT 3
KEY BUSINESS CHALLENGES FOR RETAILERS, 2016 TO 2018

   2018        2017       2016

                                                                                                                                               5.24
                   Cost of Rental

                                                                                                                                               4.64
       Hiring & Retaining Staff

                                                                                                                                               4.49
             Sales Performance

             Competition and                                                                                                                   4.07
     maintaining market share

       Cost of goods, logistics                                                                                                                3.98
       and other running costs

  Declining overall satisfaction                                                                                                               3.71
   with customer service level

       Increasing online-buying                                                                                                                3.47
                      behaviour

                                        0.0               1.0               2.0               3.0               4.0               5.0              6.0

                                                                                      Weighted Average Score
Source : Knight Frank Retailers’ Sentiment Survey 2018
1: Sample size of survey was 55 retail operators, some of which may operate more than one line of retail business and/or brands.
2: A score of 1 indicates a low level of concern, while a score of 6 indicates the highest level of concern. The higher the average score, the higher the
retailers’ level of concern towards the particular business challenge.

                                                                                                                                      Knight Frank Research   5
02.
      THE
      IMPORTANCE
      OF PHYSICAL
      STORE
      PRESENCE

                                                                                     EXHIBIT 4
                                                                                     STRATEGY ON PHYSICAL
                                                                                     STORE DEVELOPMENT
                                                                                                                           100 %

                                                                                                                             80%
                                                                                       78.2%
                                                                                      LOOKING TO OPEN
                                                                                      MORE OUTLETS

                                                                                                                             60%

      In terms of their strategies with regards to physical store development in
      2018, 78.2% of respondents indicated that they were looking to open more
      outlets both locally and overseas. In the same vein, 92.7% of respondents                78.2%
      indicated the importance of developing and maintaining a physical store                                                40%
      presence. Creating physical spaces is increasingly evident amongst
      global e-commerce giants such as Alibaba and Amazon, where their
      aggressive entry into the brick-and-mortar realm included the setting up
      of Hema and Amazon GO supermarkets with sizable footprint. Back at
      home, local fashion retailer, Love Bonito, set up their first physical store
                                                                                                                             20%
      right in the heart of Singapore’s shopping belt, Orchard Road. Local online
      luxury e-tailer, Reebonz, followed suit, setting up pop-up stores in malls
      such as Suntec and VivoCity. They subsequently set up a showroom within
      their eight-storey e-commerce hub in Tampines in May 2017 , with the hub
      established to ramp up its cross border operations and meet the evolving
      demands of their customers.                                                                                             0%
                                                                                     Source : Knight Frank Retailers’ Sentiment Survey 2018

6   Knight Frank Research
Clearly, the value proposition of having physical
                                                                                 shops remains a key consideration for local
                                                                                 retailers in their business strategy.

                                                                                 First
                                                                                 Physical stores allow e-commerce players
                                                                                 to capture walk-in patrons, and double up
                                                                                 as warehouse and fulfilment stations for the
                                                                                 delivery of online purchases.

                                                                                 Second
                                                                                 E-commerce players have also realised the
                                                                                 expansive value of occupying a physical space,
                                                                                 as evidenced by the 2017 survey results from
                                                                                 the International Council of Shopping Centres.
                                                                                 The findings revealed that 81.0% of consumers
                                                                                 who shopped online and visited the physical
                                                                                 store to pick up their orders were likely
                                                                                 to purchase additional items, during the
                                                                                 collection of their online purchases.

EXHIBIT 5
ATTRIBUTES OF SHOPPING EXPERIENCES AND PRODUCTS VALUED BY CUSTOMERS, 2017 vs 2018

   2018       2017

    65.5%

                            60.0%

                                             41.8%

                                                              29.1%
                                                                               27.3%
                                                                                                 21.8%

                                                                                                                   7.3%

       Value-for-             Good             High Quality        Wider        Products with   Strong product        Delivery
     money products         customer            products        selection of       strong       knowledge from        services
                             service                             goods &          branding        service staff      availability
                                                                 services

Source : Knight Frank Retailers’ Sentiment Survey 2018

                                                                                                                  Knight Frank Research   7
03. STRENGTHENING THE
PHYSICAL STORE
EXPERIENCE
When surveyed on the attributes of shopping in their physical shops to showcase products
experiences and products that customers under thematic formats that reflect the trends of
value, respondents picked value-for-money, the season, allowing customers to touch, feel,
good customer service and quality products as and experience their current range of items.
the top three values deemed most important for Amid the flurry of online retailing, the survey
their customers. While these Major retailers like Hermes, revealed the emerging
values and experiences Gucci and Apple have also trends of leveraging on
can be addressed by an developed ‘showrooms’ in their incumbents, while moving
e-commerce platform, physical shops to showcase away from the usual
the ‘human touch’ aspect products under thematic social media strategy.
remains the crucial formats that reflect the trends of Interestingly, 20.0% of
differentiating factor which is the season, allowing customers respondents now choose
now fulfilled at the physical to touch, feel, and experience to market their products
store. their current range of items. on established, multi-
Rather than have both online and offline brand e-commerce platforms such as Lazada,
platforms running independently, how can Tmall and Qoo10, over developing their own
retailers drive a more seamless transition online platforms to reach out to customers.
between both platforms? Respondents Only 5.5% of respondents in the 2018 survey
believe that showrooming, exclusive in-store indicated an interest in building an interactive
advertising and promotions and the adoption smartphone app, compared to 11.5% in the
of social spaces in-store were strategies that 2017 survey. Likewise, a lower proportion of
could help drive traffic back to brick stores 50.9% of retailers surveyed are keen to engage
(Exhibit 3). Major retailers like Hermes, Gucci customers via social media portals in 2018,
and Apple have also developed ‘showrooms’ compared to 61.5% in 2017.
8 Knight Frank ResearchEXHIBIT 6
RETAILING STRATEGIES TO REACH OUT TO CUSTOMERS
Proportion of Respondents (%)
43.6%
1 Showrooming
36.4%
2 Exclusive in-store Advertising & Promotions
30.9%
3 Social spaces in store
Cafe-in-store
Interactive in-shop classes
AR provision
Others
Interactive Games-in-store
Virtual fitting rooms
Source : Knight Frank Retailers’ Sentiment Survey 2018
EXHIBIT 7
RESPONDENTS BY TRADE CATEGORIES
A Books & Stationery 2%
B Department Store 2%
O P A B
N C Education & Enrichment 11%
M C
L D Electronics & Technology 4%
K E Fashion & Accessories 13%
D
F Food & Beverage Services 31%
J Food & Beverage Retail (takeways)
G 4%
H Supermarket 2%
E
I Hair, Beauty & Cosmetics 9%
I J Health, Fitness & Wellness 7%
K Household & Furnishing 4%
H L Kids Fashion, Toys & kids Specialty 2%
G M Leisure & Entertainment 2%
N Sporting Goods & Apparels 4%
O Sundry & Services 4%
F
P Others 2%
Source : Knight Frank Retailers’ Sentiment Survey 2018
Knight Frank Research 9EXHIBIT 8
WHAT IS YOUR STRATEGY WITH REGARDS TO PHYSICAL STORE
DEVELOPMENT FOR YOUR BUSINESS IN 2018?
Open more outlets within Singapore 80.0%
Open more outlets overseas
To maintain status quo
60.0%
Proportion of Responses
Closing of some outlets within
Singapore
Downsizing of some outlets within
Singapore
40.0%
Upsizing of some outlets within
Singapore
Closing some outlets overseas
20.0%
Change retail outlet sizes and
add ancillary spaces (e.g.
warehousing) to introduce new
ways of merchandising such as
e-commerce shops
0.0%
2016 2017 2018
Source : Knight Frank Retailers’ Sentiment Survey 2018
EXHIBIT 9
WHAT WILL BE YOUR TOP CONSIDERATION WHEN PICKING A LOCATION FOR A NEW OUTLET?
2018 2017
Must be within area with a 34.5%
large captive catchment 50.0%
Established retail malls tagged with proactive 20.0%
mall support initiatives to increase footfall traffic 9.6%
20.0%
Near major transport nodes
15.4%
16.4%
Location that offers comparatively lower rents 19.2%
Malls that recently underwent 1.8%
Asset Enhancement Initiatives (AEI) 1.9%
Unique, niche enclaves such as conservation 1.8%
shophouses, old buildings 1.9%
Source : Knight Frank Retailers’ Sentiment Survey 2018
10 Knight Frank ResearchEXHIBIT 10
TO WHAT EXTENT HAVE YOU ADOPTED TECHNOLOGIES IN THE FOLLOWING
ASPECTS OF CONDUCTING YOUR RETAIL BUSINESS?
2018 2017
Mode of Payment
Web & Social Media Marketing
Inventory Management
E-Commerce
Omni-Channelling
In-store Interactive Technology
0.0 0.5 1.0 1.5 2.0 2.5 3.0 3.5 4.0 4.5
Weighted Average Score
Source : Knight Frank Retailers’ Sentiment Survey 2018
EXHIBIT 11
MORE RETAILERS ACTIVE IN MARKETING CHANNELS VIA ESTABLISHED E-COMMERCE PLATFORMS IN 2018
2018 2017
Physical store
Social media portals
(e.g. Facebook, Instagram, Twitter)
Provide all available POS
(point-of-sales) systems & Payment options
Official website for browsing of products
Official website with online contact centre
Official website for purchase of products
Placement & Marketing via other established
e-commerce platforms (e.g. Zalora, Lazada,
Tmall, Qoo10 etc.)
Roadshows, exhibitions and seminars
Smartphone interactive apps
0.0 1.0 2.0 3.0 4.0 5.0 6.0
Weighted Average Score
Source : Knight Frank Retailers’ Sentiment Survey 2018
Knight Frank Research 11EXHIBIT 12
HOW WOULD YOU SEE YOUR OVERALL BUSINESS PROFITABILITY CHANGE IN 2018,
COMPARED TO 2017?
% in 2018 % in 2017
25.0%
20.0%
Proportion of Responses
15.0%
10.0%
5.0%
0.0%
>20% -20% -14% -9% -4% SAME 1% 5% 10% 15% >20%
drop to to to to to to to to increase
-15% -10% -5% -1% 4% 9% 14% 20%
Source : Knight Frank Retailers’ Sentiment Survey 2018
Looking ahead, conventional retailers can explore integrating
04. click-and-collect services in their existing physical stores,
which may help reduce warehousing and additional manpower
costs over the long term. E-commerce players can seek to
partner existing “brick-and-mortar” owners, to allow customers
to collect their merchandise at their partner’s physical stores. An
RELEVANCE OF example of such a partnership is the tie up between e-commerce
player Lazada and real estate giant CapitaLand, where Lazada
BRICKS TO STAY leverages CapitaLand’s existing mall infrastructures by setting
up item collection lounges. There, e-shoppers can collect, test,
AND EVOLVE TO and even return defective items on the spot. Such partnerships
NEW EXPERIENCE not only create an ecosystem to drive traffic to both the
online and offline stores, but also offer added convenience
to customers. This seamless online-offline relationship, with
the added emphasis of convenience to customers’ shopping
experiences, will set the stage for the future of Singapore retail
at least for 2018.
12 Knight Frank ResearchFOR RETAIL LEASING ENQUIRIES,
PLEASE CONTACT:
Wendy Low
Executive Director and Head
Retail
+65 6228 7335
wendy.low@sg.knightfrank.com
FOR CONSULTANCY
AND RESEARCH ENQUIRIES,
PLEASE CONTACT:
Alice Tan
Director and Head
Consultancy & Research
+65 6228 6833
alice.tan@sg.knightfrank.com
FOR FURTHER ENQUIRIES,
PLEASE CONTACT:
Wong Shanting
Manager
Research
+65 6228 7339
shanting.wong@sg.knightfrank.com
Knight Frank Research 13KnightFrank.com.sg
© Knight Frank Singapore 2018
This report is published for general information only and not to be relied upon in any way. Although high standards have been used in the preparation of the information, analysis, views and projections
presented in this report, no responsibility or liability whatsoever can be accepted by Knight Frank Pte Ltd and its subsidiaries for any loss or damage resultant from any use of, reliance on or reference to the
contents of this document. As a general report, this material does not necessarily represent the view of Knight Frank Pte Ltd and its subsidiaries in relation to particular properties or projects. Reproduction
of this report in whole or in part is not allowed without prior written approval of Knight Frank Pte Ltd to the form and content within which it appears. Knight Frank Pte Ltd is a private limited company which is
incorporated in Singapore with company registration number 198205243Z and CEA license number L3005536J. Our registered office is at 10 Collyer Quay #08-01 Ocean Financial Centre Singapore 049315.
14 Knight Frank ResearchYou can also read