Analyst Presentation FY2015 - Frankfurt - March 16, 2016 Dr Stefan Schulte CEO Dr Matthias Zieschang CFO - Fraport AG
←
→
Page content transcription
If your browser does not render page correctly, please read the page content below
Analyst Presentation FY2015
Frankfurt – March 16, 2016

Dr Stefan Schulte       Dr Matthias Zieschang
CEO                     CFO
2     Fraport Analyst Presentation FY2015

Disclaimer

This document has been prepared by Fraport solely for use in this presentation.

The information contained in this document has not been independently verified. No representation or warranty – whether
express or implied – is made as to, and no reliance should be placed on, the fairness, accuracy, completeness or correctness
of the information or opinions contained therein. Neither the company nor any of its affiliates, advisors or representatives shall
have any liability whatsoever (in negligence or otherwise) for any loss arising from any use of this document or its content or
otherwise arising in connection with this document.

This document does not constitute an offer or invitation to purchase or subscribe for any shares and neither this document nor
any part of it shall form the basis of, or be relied upon in connection with, any contract or commitment whatsoever.

This document contains forward-looking statements that are based on current estimates and assumptions made by the
management of Fraport to the best of its knowledge. Such forward-looking statements are subject to risks and uncertainties,
the non-occurrence or occurrence of which could cause the actual results – including the financial condition and profitability of
Fraport – to differ materially from or be more negative than those expressed or implied by such forward-looking statements.
This also applies to the forward looking estimates and forecasts derived from third-party studies. Consequently, neither the
company nor its management can give any assurance regarding the future accuracy of the opinions set forth in this document
or the actual occurrence of the predicted developments.

By accepting this document, you agree with the foregoing.
3   Fraport Analyst Presentation FY2015

Agenda

- Financial Highlights
- Traffic Insight
- Main Features and Latest Development
              - Status Greek Regional Airports
              - Terminal 3
              - Services FRA / Multichannel Retail
- 2016 Outlook
- FY Financials in Detail
4 Fraport Analyst Presentation FY2015
Financial Highlights
Fraport Group Figures FY 2015 (P&L)
FY2015 FY2014 yoy
in € mil.
Revenue 2,599 2,395 +9 %
EBITDA 849 790 +7 %
EBIT 521 483 +8 %
Group result* 297 252 +18 %
Traffic Figures up, FRA with 2.5% upside in passenger traffic
Revenue increased by 9% (IFRIC12 adjusted +8%)
Group EBITDA rose to €849 million, an upside of 7%
All segments contributing, mostly Retail and External Activities
Group result increased by 18% mostly due to operating performance
* Before minorities
5 Fraport Analyst Presentation FY2015
Financial Highlights
Fraport Group FY 2015 (Cash Flow, Leverage, Capex)
FY2015 FY2014 yoy
in € mil.
Operating Cash Flow 652 506 +29%
Capex* 291 291 0%
Dividend from Investments 33 32 +2%
Free Cash Flow 394 247 +60%
Gearing in % 84% 97% -13PP
Net Debt 2,774 3,013 -8 %
Operating Cash Flow significantly up due to good operating performance
Flat Capex
Substantial increase in Free Cash Flow to just under €400 million
Gearing & Net Debt down despite dividend payment
* as used in PPE, airport operating projects, investment property, at equity investments, and other intangible assets
6   Fraport Analyst Presentation FY2015

Agenda

- Financial Highlights
- Traffic Insight
- Main Features and Latest Development
              - Status Greek Regional Airports
              - Terminal 3
              - Services FRA / Multichannel Retail
- 2016 Outlook
- FY Financials in Detail
7         Fraport Analyst Presentation FY2015

Traffic Insight
Group Passenger Development (stakes above 10%)
    IATA                                                Dec        D        FY         D        FY
                                                                                                        CAGR
              Airport                           Share           previous            previous            2010-
    Code                                                2015               2015                2014
                                                                  year                year              2014

    FRA       Frankfurt, Germany                100%    4,098   +2.1%      61,032    +2.5%     59,566   +3.0%

    LJU       Ljubljana, Slovenia               100%     80     -0.2%       1,438   +10.0%      1,307    -1.4%

    LIM       Lima, Peru                        70%     1,479   +11.4%     17,113    +9.2%     15,659   +11.1%

    BOJ       Burgas, Bulgaria                  60%      11     -2.8%       2,360     -6.7%     2,530   +7.5%

    VAR       Varna, Bulgaria                   60%      30     +22.0%      1,399    +0.8%      1,387   +3.1%

    AYT       Antalya, Turkey                   51%     674     +0.8%      27,523     -1.6%    27,979   +6.0%

    LED       St. Petersburg, Russia            35.5%   794     -14.8%     13,500     -5.4%    14,265   +14.0%

    HAJ       Hanover, Germany                  30%     306     +1.4%       5,453    +3.0%      5,292   +1.1%

    XIY       Xi‘an, China                      24.5%   2,629   +17.7%     32,970   +13.0%     29,177   +12.8%
8         Fraport Analyst Presentation FY2015

Traffic Insight
Frankfurt Airport
                                                                 Dec 2015         D%                FY 2015                     D%                      FY 2014

    Passengers                                  in `000             4,098        +2.1                       61,032                +2.5                      59,566

    Movements                                                      33.945        +3.0                    468,153                   -0.2                  469,026

    MTOW                                in `000 tons                2,230        +4.4                       29,543                +2.0                      28,958

    Cargo                               in `000 tons                  172          -1.0                        2,077               -2.6                       2,132

                                      Seat load factor                                                            Passenger per movement
    90%
                                     2015                 2014                        YTD 2015
    85%                                                                                                                                                          +4.0
                                                                                      YTD 2014                                                                   Pass.
    80%

    75%                                                                                           120        125         130        135        140         145        150

    70%
                                                                                                           Passenger guidance FY2015:
    65%                                                                                                     Between +~3% and +~4%
           Jan Feb Mar Apr May Jun Jul Aug Sep Oct Nov Dec

                                                                        Passenger figures according to ACI, commercial traffic only; cargo includes air freight and air mail
9   Fraport Analyst Presentation FY2015

Traffic Insight
Peer Comparison

                                          Absolute Figures in mil.         Relative 2015 vs. 2014

                               LHR                    75                         +2.2%

                              CDG                 66                             +3.1%

                                 IST             62                              +9.1%

                               FRA               61                               +2.5%

                               AMS               58                              +6.0%

                              MAD           47                                  +12.0%

                              MUC         41                                     +3.2%

                      Germany                                        216          +3.8%
10   Fraport Analyst Presentation FY2015

Traffic Insight
Summer Schedule FRA 2016

 Geo-Political                             Summer schedule          New Low Cost          Airlines*: 95
 situation impacts                         with a slight positive   Carrier WOW in        Destinations*: 289
 passenger                                 seat upside /            Frankfurt flying to
                                                                                          Countries*: 98
 development                               movements slightly       Iceland and on to
                                           negative                 North America

                    Summer Schedule from End of March to End of October 2016

                                                                                                * Passenger Flights
11 Fraport Analyst Presentation FY2015
Agenda
- Financial Highlights
- Traffic Insight
- Main Features and Latest Development
- Status Greek Regional Airports
- Terminal 3
- Services FRA / Multichannel Retail
- 2016 Outlook
- FY Financials in Detail12 Fraport Analyst Presentation FY2015
Main Features and Latest Development
Status Greek Regional Airports
• Concession contract signed end of 2015
• # of passengers 2015: 23.4 mil. / +7%
• Remaining conditions precedent required are to most extent:
project financing
ratification of concession contract by the parliament
green light from the Greek competition authority
setting up the operating entity (labour, IT, processes for transfer of
operations, etc.)
• Administration company in Athens will comprise about 100 employees plus
another 350 to 400 on the 14 airports
• Transfer of the airports and closing of the transaction is expected to take place in
Q4/2016
• Outlook of Fraport Group given for 2016 not reflecting any consolidation
• Consolidation impact from 2017 onwards:
minimum € 200 mil. Revenue, minimum € 100 mil. EBITDA
Net Debt increase above € 1 bn. / Gearing will go up to about 100%
Further more noticeable P+L impacts by D&A and interest expenses13 Fraport Analyst Presentation FY2015
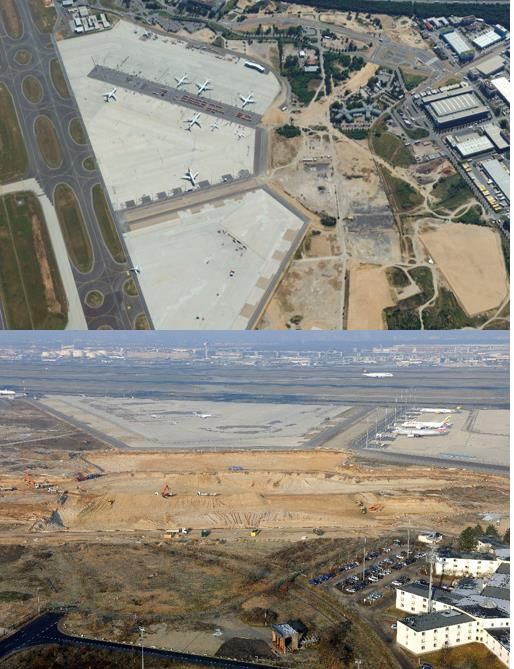
Main Features and Latest Development
Terminal 3
Summer 2015 Main Features:
Capex budget € 2.5-3.0 bn. in total
Additional passenger capacity 14 mil.
Floor space ca. 90,000 sqm
Large state-of-the-art Retail facilities
24 gate positions at the building
4 Check-in-Areas with 100 counters
Opening 2022
January 2016 Status / Next Steps:
Mild winter supported good time
schedule
Excavation for dry work to go until 3/2016
Special heavy construction works due to
ground water to follow up from Q4/2016
Capex 2015: ~€ 40 mil
Capex 2016: ~€ 60 mil
Capex 2017: ~€ 110 mil14 Fraport Analyst Presentation FY2015
Main Features and Latest Development
Insight on Retail Customers
1 TOP 5 BY RETAIL VALUE 2 TOP 5 BY VOLUME 3 ALL OTHER DESTINATIONS
Destinations with very high retail value, Destinations with very large passenger Large number of destinations (104)
average passenger volumes, volumes, with a highly heterogeneous
highly defined consumption patterns moderate retail value, and passenger mix,
easy reachability and addressability moderate reachability and greatly varying retail value and
addressability difficult addressability because of the
wide range of languages, consumption
patterns, gates etc.
China Russia South Korea Japan Vietnam USA Turkey Germany UAE India
7%
pax*
31%
revenue*
30%
pax
18%
revenue 63% pax
50%
revenue
* Source: sales/revenue data of Gebr. Heinemann by destinations 201515 Fraport Analyst Presentation FY2015
Main Features and Latest Development
Our Service-Strategy for a Better Stay of our Passengers
Individual
Welcome and Ambience and
Experience esp.
Way Finding Infrastructure
for Transfers
First Impression Well Being Individual needs count
Individual identity and happy to Realization of important
Initial positive impression,
be back again rather than being expectations: relaxing,
facing safety, no stress, clear
anonym in a cold atmosphere. working, find-out, shopping
orientation
Sharing of positive experience16 Fraport Analyst Presentation FY2015
Main Features and Latest Development
Multichannel Retail – Successive Rollout of Activities
Time Line Multichannel-Activities
12/2015 Online Shopping, Frankfurt Airport
Rewards, Frankfurt Airport App & Webpage
LAUNCH…
Lounge-Delivery und Inflight Shopping
H1 / 2016 joint project with Lufthansa
Launch for possibility of online payment
and Home Delivery (Germany)
Continuous expansion of reward program
(partner & benefits)
H2 / 2016 Further rollout of Interactive Airport Desks
and professionalizing of all Info Screens in
Terminal 1 and 2
Offering additional supply varieties at the
airport (Pick-Up-Points, Gates etc.)
Doubling the number of participating
retailers for the online shopping17 Fraport Analyst Presentation FY2015
Agenda
- Financial Highlights
- Traffic Insight
- Main Features and Latest Development
- Status Greek Regional Airports
- Terminal 3
- Services FRA / Multichannel Retail
- 2016 Outlook
- FY Financials in Detail18 Fraport Analyst Presentation FY2015
2016 Outlook – Financial Results*
2015 Outlook 2015 Results 2016 Outlook
between between
Passengers FRA 2.5%
+~3% and +~4%** +~1% and +~3%
Revenue revenue between
€ 2.6 bn up to € 2.65 bn
(IFRIC 12 adjusted) ~€2.55 and ~€2.6 bn.
between ~€840 and between ~€ 850
EBITDA € 849 mil.
~€850 mil. and ~ 880 mil.
between ~€520 and between ~€ 520
EBIT € 521 mil.
~€530 mil. and ~ 550 mil.
between ~€275 and on PY level or
Group result*** € 297 mil.
~€295 mil. slightly above
Dividend proposal stable stable at € 1.35 / share at least stable
*Without taking account of potential closing of Greek deal
** before strike effects
***Group result before minorities19 Fraport Analyst Presentation FY2015
2016 Outlook – Balance Sheet and Cash Flow*
in € mil.
2015 Results 2016 Outlook
Capex** 291 on PY level or slightly above
Free Cash Flow (FCF) 394 on PY level ***
Net Debt 2,774 deleverage by up to 10%
Gearing in % 83.8 decline by up to 10 PP
Equity Share in % 37.4% up by 3 to 4 PP
*Without taking account of potential closing of Greek deal
** as used in PPE, airport operating projects, investment property, at equity investments, and other intangible assets
***2016 outlook also depending on Antalya development20 Fraport Analyst Presentation FY2015
Agenda
- Financial Highlights
- Traffic Insight
- News from FRA
- Status Greek Regional Airports
- Terminal 3
- Services FRA / Multichannel Retail
- 2016 Outlook
- FY Financials in Detail21 Fraport Analyst Presentation FY2015
Group P&L FY 2015
Strong Increase in Group Financials
P&L in € mil. FY15 FY14 % Comments
Revenue 2,599 2,395 +8.5 › All segments with increasing EBITDA
- excl. IFRIC 12 2,584 2,384 +8.4 › Tailwind from Retail, FRA pricing, US$
EBITDA 849 790 +7.4 conversion, and new Airmall and
Ljubljana investments
EBIT 521 483 +7.8
› Improvement in financial result despite
EBT 434 375 +15.8 negative CHF loan valuation
Group result 297 252 +18.0
› Group result and EPS with double-digit
EPS in € 3.00 2.54 +18.1 growth
Revenue by segment in € mil. EBITDA by segment in € mil.
+112 2,599 +34 849
+17 +1 +22 +2
+43 +33 790
2,395
Revenue Aviation Retail & Ground External Revenue EBITDA Aviation Retail & Ground External
External EBITDA
FY 2014 Real Estate Handling Activities & FY 2015 FY 2014 Real Estate Handling Activities&
Activities FY 2015
Services Services
Services
Due to commercial rounding slight discrepancies may occur when summing up, percent changes based on unrounded figures22 Fraport Analyst Presentation FY2015
Group P&L FY 2015
External Activities key Driver for Group EBITDA
+€59 mil.
+67 +4 +9
+133
€ mil. -44 849
790 AMU -29 -4
LJU AMU -46 -10 -12 -9
effect LJU AMU
effect LJU AMU
effect LJU
effect
EBITDA Revenue IFRIC12 Other Cost of materials IFRIC 12 Staff cost Other opex EBITDA
FY 2014 ex. IFRIC 12 revenue income ex. IFRIC 12 cost of FY 2015
materials
Segment share in Group EBITDA FY 2014 Segment share in Group EBITDA FY 2015
External External
Activities & Activities &
Services 19.3% Aviation Services 21.9% Aviation
30.0% 28.0%
Ground
Handling 5.6% Ground
Handling 5.5%
Retail & Retail &
45.1% Real Estate 44.6% Real Estate
Due to commercial rounding slight discrepancies may occur when summing up23 Fraport Analyst Presentation FY2015
Group P&L FY 2015
Improved Interest Result supports Earnings Momentum
+€45 mil. +€0.46
€ mil. +59 +21 297 €3.00
252 -14 €2.54
-21
Group result EBITDA D&A Financial Taxes Group result EPS EPS
FY 2014 result FY 2015 FY 2014 FY 2015
Split of financial result Comments
€ mil FY 15 FY 14 % › Improved interest result from lower interest
Interest income 31 36 -14.0 rates payable, lower net debt position, and
lower interest cost added back on provisions
Interest
expenses
-156 -177 - › Split of equity result:
› Antalya down due to less Russian
At equity result 38 44 -13.6 travelers
Other result 1 -11 >100 › Xi’an and Hanover up
› Other financial result up, despite negative
Financial result -87 -108 - impact from CHF loan market valuation
Due to commercial rounding slight discrepancies may occur when summing up, percent changes based on unrounded figures24 Fraport Analyst Presentation FY2015
Group Asset & Financial Situation FY 2015
FCF +60% to just under €400 mil.
Operating Intangible Capex in Investment DVDs from Free cash
PPE
cash flow assets investments property investments flow
€ mil. 652
506 -16
-8 +33 394
-247 -18 -10 247
+32
-252 -13 -19
FY 2015 FY 2014
2015 development 2016 Outlook
› OCF €+146 mil. due to good earnings and › 2016 Capex on 2015 level or slightly above
lower cash outs for interests and taxes
› Subject to dividends from Antalya, 2016 FCF
› Total capex on 2014 level expected to be on 2015 level
› Incl. dividends from investments FCF €147 › Including DVD payout, 2016 FCF with
mil. up at €394 mil. potential to de-lever Group by up to c.10 % to
net debt/EBITDA < 3x w/o Greek deal
› FCF per share at €4.26
Due to commercial rounding slight discrepancies may occur when summing up25 Fraport Analyst Presentation FY2015
Group Asset & Financial Situation FY 2015
FCF +60% to just under €400 mil.
FCF Liquidity Gross debt Net debt Equity Gearing1
€ mil. -12% -9% -8% +7% -13PP
4,192
3,817
3,512
+60% 2,774
3,013
3,286
97%
84%
394
1,043 1,180
394 247
247
2015 2014
Cash development Balance sheet
› FCF of €394 mil. clearly above previous year › Group result, valuation of derivatives, and
currency effects led to increase in equity to
› Repayment of gross debt and cash out for more than €3.5 bn.
DVD led to decline in liquidity to €1.04 bn.
› Gearing c.13 PP down at 84%
› Net debt below €2.8 bn.
› Equity ratio at 37.4% (Dec. 31, 2014: 34.4%)
› Net debt/EBITDA at c.3.3x, slight diluting
effects from interest cost added back
Due to commercial rounding slight discrepancies may occur when summing up
1) Net debt divided by equity less non-controlling interests and profit earmarked for distribution26 Fraport Analyst Presentation FY2015
Segment Aviation FY 2015
Additional Revenue offset by One-offs & other Cost Items
P&L in € mil. FY 15 FY 14 % Comments
Revenue 927 884 +4.9 › FRA traffic drives revenue growth
- Airport charges 769 732 +5.1 › Headwind among others from:
- Security Services 118 109 +7.4 › Revenue increase slowed down by
flat 2015 movements
- Other 41 43 -4.9 › €15 mil. wage increases
› €10 mil. provision for fire brigade
EBITDA 238 237 +0.3 › Non-capitalizable capex
EBIT 116 116 +0.7 › Further provisions created
› Quality measures
Employees 6,043 6,082 -0.6
EBITDA performance in € mil. Revenue split
+43 +4 Security Services 12.7% 4.4% Other
237 238
-25
-21
82.9% Aviation charges
EBITDA Revenue Other Staff Other EBITDA
FY 2014 income cost FY 2015
Due to commercial rounding slight discrepancies may occur when summing up, percent changes based on unrounded figures27 Fraport Analyst Presentation FY2015
Segment Retail & Real Estate FY 2015
More Traffic & higher spend per Passenger = strong Result
P&L in € mil. FY 15 FY 14 % Comments
Revenue 488 456 +7.1 › All businesses with revenue increase
- Retail 209 193 +8.3 › €6m extra revenue from q4 property
- Real Estate 184 179 +2.4 sale
- Parking 82 78 +5.4 › Other cost items a.o. up due to non-
capitalizable capex and property sale
EBITDA 379 357 +6.3
EBIT 295 275 +7.3 › EBITDA & EBIT with noticeable
increase
Employees 624 613 +1.8
EBITDA performance in € mil. Revenue split
+33 +1 2.7% Other
379
357 -2 Parking
-10
16.8%
42.9% Retail
Real Estate 37.6%
EBITDA Revenue Other Staff Other EBITDA
FY 2014 income cost FY 2015
Due to commercial rounding slight discrepancies may occur when summing up, percent changes based on unrounded figures28 Fraport Analyst Presentation FY2015
Segment Retail & Real Estate FY 2015
Retail per Passenger +5.5% reaching All-time-high
Retail revenue per Passenger
FY 12: €3.32 FY 13: €3.60 FY 14: €3.43 FY 15: €3.62
3.95 4.11 3.95 3.93 4.05
3.74 3.69
3.40 3.42 3.24 3.41 3.26
3.10 2.95 3.22 3.04
Q1 Q2 Q3 Q4 Q1 Q2 Q3 Q4 Q1 Q2 Q3 Q4 Q1 Q2 Q3 Q4
€ mil.
27 31 33 33 26 29 32 32 30 34 35 32
Shopping 25 29 30 31
11 13 14 13 12 14 14 13 13 14 16 14
Services 11 12 13 13
6 6 6 10 6 8 9 11 7 7 8 10 7 9 10 10
Advertis.29 Fraport Analyst Presentation FY2015
Segment Retail & Real Estate FY 2015
Development of Core Spending Destinations
Top 5 by Retail Value Top 5 by Volume
Volume 13 12 11
8 9 7
Development 2 2
Change vs. 2014
in %
-14 -15
China Russia South Japan Vietnam USA Turkey Germany UAE India
Korea
Retail Revenue
78
per Passenger
in EUR 15 15
28
13 3 13
2
Change vs. 2014
in % -21 -10
Source: sales/revenue data of Gebr. Heinemann by destinations 201530 Fraport Analyst Presentation FY2015
Segment Ground Handling FY 2015
Positive Earnings Momentum due Revenue Increase
P&L in € mil. FY 15 FY 14 % Comments
Revenue 673 656 +2.6 › Revenue increase due to higher
volumes and prices in infrastructure
- Ground Handling 376 381 -1.3
- Infrastructure 297 276 +7.9 › Lower GH revenue due to sale of 51%
stake in Cargo subsidiary as of Nov.15
EBITDA 46 44 +4.7
› Staff cost up due to volume and price,
EBIT 6 8 -20.0 decline in other cost from Cargo JV
Employees 9,262 9,038 +2.5
› EBITDA up & EBIT down, also due to
one-off D&A on Cargo JV of c.2 mil.
EBITDA performance in € mil. Revenue split
+17
44 -3 +5 46 Infrastructure 44.2%
-17
55.8% Ground Handling
EBITDA Revenue Other Staff Other EBITDA
FY 2014 income cost FY 2015
Due to commercial rounding slight discrepancies may occur when summing up, percent changes based on unrounded figures31 Fraport Analyst Presentation FY2015
Segment External Activities & Services FY 2015
Growth from Lima and new Investments
P&L in € mil. FY 15 FY 14 % Comments
Revenue 510 399 +28.1 › Strong increase from Lima traffic and
positive US$ effect
- excl. IFRIC 12 495 388 +27.7
- AMU 60 21 >100 › Full year contribution of AMU & LJU
- Ljubljana 35 7 >100 › Lower earnings from Varna/Burgas and
termination of Saudi mgmt. contracts
EBITDA 186 152 +22.1
EBIT 103 85 +21.6 › Other income with €8m Air-IT book gain
Employees 4,791 4,662 +2.8 › Strong increase in EBITDA and EBIT
EBITDA performance in € mil. Revenue split
+23 186 Other
+11 -3
152 +8 -3 -1 -1 16.5%
Ljubljana 6.8%
Twin Star 10.6% 54.5% Lima
EBITDA AMU LJU LAP Twin Saudi Air-IT Other EBITDA 11.7%
FY 2014 Star Arabia FY 2015 Airmall
Due to commercial rounding slight discrepancies may occur when summing up, percent changes based on unrounded figures32 Fraport Analyst Presentation FY2015
External Activities FY 2015
Fully consolidated Investments1
Airmall2 Ljubljana2 Lima Twin Star
€ mil. FY 15 FY 14 % FY 15 FY 14 % FY 15 FY 14 % FY 15 FY 14 %
Revenue 60 21 >100 35 7 >100 278 214 29.7 54 61 -11.2
-ex IFRIC 12 - - - - - - 263 205 28.5 54 60 -9.7
EBITDA 12 4 >100 13 2 >100 100 77 30.5 32 36 -9.2
margin 19.8% 18.4% - 36.2% - - 36.0% 35.8% - 60.1% 58.8% -
adjusted - - - - - - 38.1% 37.5% - 60.3% 60.0% -
EBIT 4 1 >100 3 -1 - 83 62 33.5 21 24 -14.3
margin 6.0% 4.4% - 7.5% - - 29.7% 28.8% - 38.8% 40.2% -
adjusted - - - - - - 31.4% 30.2% - 38.9% 41.0% -
Result 4 1 >100 3 -1 - 46 32 44.2 13 16 -16.5
Passengers - - - 1.4 1.3 10.0 17.1 15.7 9.2 3.8 3.9 -4.1
in mil.
1) Figures refer to IFRS accounting, not local GAAP, percent changes based on unrounded figures
2) Airmall acquired August 2014 and Ljubljana October 201433 Fraport Analyst Presentation FY2015
External Activities FY 2015
At Equity consolidated Investments
Antalya Pulkovo Hanover Xi‘An
€ mil. FY 15 FY 14 % FY 15 FY 14 % FY 15 FY 14 % FY 15 FY 14 %
Revenue 301 327 -7.9 233 370 -37.0 146 142 2.9 201 144 39.5
-ex IFRIC 12 - - - 208 241 -13.8 - - - - - -
EBITDA 258 283 -8.6 125 109 15.4 28 27 4.4 85 57 49.6
margin 85.8% 86.5% - 53.8% 29.4% - 19.4% 19.1% - 42.2% 39.3% -
adjusted - - - 60.3% 45.0% - - - - - - -
EBIT 161 184 -12.7 87 67 30.0 8 7 12.5 36 29 24.5
margin 53.4% 56.3% - 37.4% 18.1% - 5.5% 5.1% - 18.0% 20.2% -
adjusted - - - 41.9% 27.8% - - - - - - -
Result 68 85 -20.4 -9 -292 - 4 1 >100 21 13 62.7
Passengers 27.5 28.0 -1.6 13.5 14.3 -5.4 5.5 5.3 3.0 33.0 29.2 13.0
in mil.
Figures refer to IFRS accounting, Xi’an 2014 values adjusted, percent changes based on unrounded figuresThank you for your Attention! www.meet-ir.com
35   Fraport Analyst Presentation FY2015

                                                 Appendix
                                      – Subsequent financial information –
36 Fraport Analyst Presentation FY2015 Appendix Special Effects FY 2015 € mil. FY 15 FY 14 Group financial result Market valuation of derivatives & F/X fluctuations 0.6 -9.0 Segment External Activities IFRIC 12 revenue 15.1 10.8 AMU Holdings – acquired August 2014 Revenue 59.7 20.6 EBITDA 11.8 3.8 EBIT 3.6 0.9 Aerodrom Ljubljana – acquired Oct. 2014 Revenue 34.8 7.2 EBITDA 12.6 1.7 EBIT 2.6 -0.8 Air Transport IT – disposed April 2015 Revenue 4.9 12.5 EBITDA 0.3 1.5 EBIT 0.1 1.1 Fraport Saudi Arabia – ended June 2014 Revenue - 9.7 EBITDA - 2.7 EBIT - 2.6
37         Fraport Analyst Presentation FY2015

 Appendix
 Maturity Profile & Cash Position as at December 31, 2015

€ mil.

 4,500
                                                                                 Fraport debt conditions on average
 4,000                      3,817.4
                                                                                         ~ 3.4 % interest rate
 3,500                                                                                   ~ 4.6 years maturity

 3,000
                                                                                     Book value
 2,500
                                                                                     Nominal value
 2,000

 1,500
               1,043.1                                             1,133.3
 1,000

                                           516.0           517.7
      500                                                                            423.3    401.2                     318.6
                                                   295.6                     186.5
                                                                                                       2.6       2.6
       0
             Liquidity
             Liquidityas Financial
                          Gross            2016    2017    2018     2019     2020    2021     2022    2023       2024   2025++
             of Dez 31, Liabilities
                           debt
                2015
38 Fraport Analyst Presentation FY2015
Appendix
Status Greece Acquisition
Airports 14 Greek regional airports, 77% international share, around 23 million passengers in 2015
Fraport Share & Fraport will hold minimum 65 percent
Partner
Upfront payment € 1.2 bn. upfront payment
Concession Payment 22.9 mil. fixed annual concession payments (indexed with Greek inflation rate)
From 2020 variable payment of ~28.5% of EBITDA (before variable concession payment )
Concession Length 40 years
Capex ~€ 330 mil. capex requirements between 2017-2020, afterwards maintenance capex,
capex for further extension depending on traffic growth
Regulation Dual Till
Airport Capped at € 13 per departing passenger in 2017, after initial capex capped at € 18.50, thereafter
Charges indexation with 90% of the Greek inflation rate annually
Retail Development Very small retail outlets existing; space will roughly triple after first construction phase; new
operating concepts like walk through will be introduced
Traffic Growth Not disclosed in detail - business case assumes conservative growth over concession period of
Assumption about 2.5% p.a.39 Fraport Analyst Presentation FY2015
Appendix
IR Contact
Fraport AG
Frankfurt Airport Services Worldwide
60547 Frankfurt am Main
www.meet-ir.com
investor.relations@fraport.de
+49 69 690 – 74842
Stefan J. Rüter Florian Fuchs
Head of Finance Svenja Ebeling Manager Investor Relations
& Investor Relations Investor Relations Assistant & Financial Reporting
+49 69 690-74840 +49 69 690-74842 +49 69 690-74844
s.rueter@fraport.de s.ebeling@fraport.de f.fuchs@fraport.deYou can also read