QANTM Full Year Results Presentation - 12 months to 30 June 2018 - Open Briefing
←
→
Page content transcription
If your browser does not render page correctly, please read the page content below

Full Year Results Presentation
12 months to 30 June 2018

QANTM
29 AUGUST 2018

Leon Allen, Managing Director and CEO
Martin Cleaver, Chief Financial Officer

                                          QANTM Investor Presentation
Structure

1. 2018 – Summary Features

2. Market and Business Overview

3. Financial Results

4. Business Initiatives

5. Priorities

                                  QANTM Investor Presentation   2
Disclaimer

This presentation has been prepared by QANTM                    “believe”, “expect”, “project”, “forecast”, “estimate”, “likely”,   performance and condition. The non-IFRS financial
Intellectual Property Limited ACN 612 441 326 (“QANTM”          “intend”, “should”, “could”, “may”, “target”, “plan”,               information does not have standardised meanings under
or the “Company”). The information contained in this            “guidance” and other similar expressions. Indications of,           the Australian Accounting Standards and therefore may
presentation is for information purposes only and has been      and guidance on, future earning or dividends and financial          not be comparable to similarly titled measures presented
prepared for use in conjunction with a verbal presentation      position and performance are also forward-looking                   by other entities, nor should they be interpreted as an
and should be read in that context.                             statements. Such forward-looking statements are not                 alternative to other financial measures determined in
                                                                guarantees of future performance and involve known and              accordance with the Australian Accounting Standards. No
The information contained in this presentation is not           unknown risks, uncertainties and other factors, many of             reliance should therefore be placed on any financial
investment or financial product advice and is not intended      which are beyond the control of QANTM and its related               information, including non-IFRS financial information and
to be used as the basis for making an investment decision.      bodies corporate, together with their respective directors,         ratios, included in this presentation. All financial amounts
Please note that, in providing this presentation, QANTM         officers, employees, agents or advisers, that may cause             contained in this presentation are expressed in Australian
has not considered the objectives, financial position or        actual results to differ materially from those expressed or         dollars and rounded to the nearest $0.1 million unless
needs of any particular recipient. QANTM strongly               implied in such statement. Actual results, performance or           otherwise stated. Any discrepancies between totals and
suggests that investors consult a financial advisor prior to    achievements may vary materially from any forward                   sums of components in tables contained in this
making an investment decision.                                  looking statements and the assumptions on which those               presentation may be due to rounding.
                                                                statements are based. Readers are cautioned not to place
                                                                undue reliance on forward looking statements and QANTM
No representation or warranty, express or implied, is made      assumes no obligation to update such information.
as to the fairness, accuracy, completeness or correctness       Specific regard should be given to the risk factors outlined
of the information, opinions and conclusions contained in       in this presentation (amongst other things) .
this presentation. To the maximum extent permitted by
law, none of QANTM, its related bodies corporate or its
shareholders nor their respective directors, officers,          This presentation is not, and does not constitute, an offer
employees, agents nor advisors, nor any other person,           to sell or the solicitation, invitation or recommendation to
accepts any liability, including, without limitation, any       purchase any securities and neither this presentation nor
liability arising out of fault or negligence for any loss       anything contained in it forms the basis of any contract or
arising from the use or application of information contained    commitment.
in this presentation.
                                                                Certain financial data included in this presentation is not
This presentation may include “forward looking                  recognised under the Australian Accounting Standards
statements” within the meaning of securities laws of            and is classified as 'non-IFRS financial information' under
applicable jurisdictions. Forward looking statements can        ASIC Regulatory Guide 230 'Disclosing non-IFRS financial
generally be identified by the use of the words “anticipate”,   information' (RG 230). This non-IFRS financial information
                                                                provides information to users in measuring financial

                                                                                                                                                          QANTM Investor Presentation              3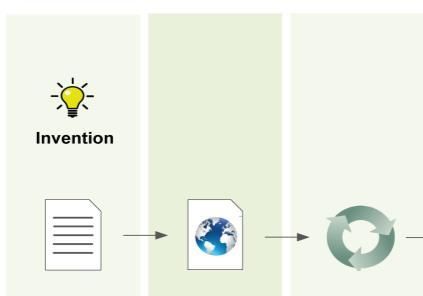
2018 – Summary Features

                      QANTM Investor Presentation   4
2018 – Summary
Full year EBITDA after FX within guidance range as advised February 2018
Stronger 2H financial performance following 1H weakness
Trade mark and legal revenue growth, partially offset patent revenue decline for the year
Positive trend in patents evident in 2H with Australian applications up 12% on 1H 2018
Overall Group patent applications down 0.6%
– Australian patent applications down 6.2%, reflecting weakness in 1H
– PCT applications up 19.8% to record level
– Asian applications down 9.3% with decline in Singapore (due to previous year transfers) and growth in the rest of Asia
– RoW (rest of World) applications up 13.7%
Acquisition of Malaysian IP firm, Advanz Fidelis, finalised 2 July 2018
Measures for internal alignment, retention and career advancement of personnel
Focus on revenue generation; increased marketing / business development investment
Maintenance of low debt and balance sheet flexibility
QANTM Investor Presentation 5Financial Summary – Underlying Results 1
Total revenue $101.7 million, down 1.5% ( 2017: $103.2 million), (2H up 6.7% on 1H)
─ Service Charges of $76.5 million vs $80.4 million, down 4.9%, 2H up 1.3% on 1H
─ Foreign Associate Charges of $25.2 million vs $22.8 million, 2H up 25.0% on 1H
(net after recoverable expenses of $1.8 million vs $2.9 million)
Operating expenses $61.1 million, down 1.0% (2017: $61.7 million)
Restructuring costs, as advised at the half year of $1.9 million
EBITDA pre FX of $19.3 million (2017: $23.6 million), 2H up 5.3% on 1H
EBITDA after FX of $20.1 million (2017: $24.5 million), 2H up 13.8% on 1H
EBITDA margin (on Service Charges Revenue) 26.3% (2017: 30.5%), 2H 27.8%
Net Profit after Tax $11.9 million (2017: $14.8 million), 2H up 16.4% on 1H
Operating cash flow of $11.3 million (2017: $21.3 million)
Final dividend of 4.3 cents per share, 100% franked; total 2018 dividends of 7.1 cents (2017: 8.9 cents)
Net debt of $8.3 million (2017: $7.4 million); gearing (net debt/net debt + equity) 10.6%
Note
1 A reconciliation of Statutory to underlying results is included in Slide 20. Underlying results are shown in 2018 to facilitate comparisons period-to-period.
QANTM Investor Presentation 6Market and Business Overview
QANTM Investor Presentation 7Revenue by Source of Business
QANTM REVENUE FULL YEAR TREND QANTM REVENUE HALF YEAR TREND
FY 2016 - FY 2018 1H 2016 - 2H 2018
120,000 60,000
100,000 50,000
80,000 40,000
60,000 30,000
40,000 20,000
20,000 10,000
0 0
FY2016 FY2017 FY2018 1H 2016 2H 2016 1H 2017 2H 2017 1H 2018 2H 2018
PATENTS TRADE MARKS LEGAL/LITIGATION PATENTS TRADE MARKS LEGAL/LITIGATION
• Total patent revenue down 4.2%; service charges revenue down 8.6% • 6.3% increase in total patent revenue 2H 2018 vs 1H 2018; service
charges patent revenue up 0.6%
• Total trade mark revenue up 5.9%; service charges revenue up 2.7%
• 15.8% increase in trade mark revenue 2H 2018 vs 1H 2018; service
• Legal/litigation revenue up 7.5%
charges revenue up 10.7%
• Trade mark 2H 2018 revenue highest ever
• Legal revenue in 2H 2018 4.9% lower vs 1H 2018, after strong 1H
Note:
Includes both service charge revenue and foreign associate revenues.
QANTM Investor Presentation 8Business Overview
PATENTS AND DESIGNS
BUSINESS AREAS TRADE MARKS LEGAL / LITIGATION
LIFECYCLE/ADVISORY
Lifecycle
57%
Percentage of aggregate
QANTM Service Charges 69% 19% 12%
revenue FY 20181
Advisory
12%
2018 vs 2017
• Service Charges Revenue $52.6 m vs $57.6 m $14.3 m vs $13.9 m
• Service and Foreign $9.6 m vs $8.9 m
Associates Charges
$73.0 m vs $76.2 m $19.1 m vs $18.1 m
Revenue
• Lower level of foreign sourced,
Australian patent work, particularly
• Trade mark business growth,
prosecution and advisory • Increase in client litigation/ legal
Main Factors filings up 3%
• Australian domestic patent work; continuation evident into 1H
• Strong DCC Australia trade mark
applications down 6.2% y-o-y 2019
business
• Overall Group patent applications
marginally lower, down 0.6%
• DCC equal #2 firm • DCC #2 individual firm
Market Position2 • DCC legal services
• QANTM #3 group • QANTM #2 group
Source: DCC and FPA management analysis
Notes:
1. Excludes Associate Charges.
2. Market position analysis is based on the total number of patent or trade mark applications filed in Australia in FY18 and assumes the Group and two additional competitor groups of businesses both
operated in their current form.
QANTM Investor Presentation 9Patents and Designs Life Cycle / Advisory
QANTM total patent revenues (service charges and associate charges) declined 4.2% vs 2017
− service charges declined 8.6% (0.6% increase in 2H v 1H)
− associate charges increased 9.6% (offset by higher recoverable expenses)
Full year revenues reflect lower client prosecution and advisory activity
Total patent revenues increased 6.3% in 2H vs 1H 2018
Overall group patent applications down marginally 0.6% in FY18
– Australian patent applications down 6.2%, weakness evident in 1H
– PCT applications up 19.8% to record level
– Asian applications 9.3% lower with decline in Singapore (18%, reflecting prior year transfers) and growth
in the rest of Asia (13.5%)
– RoW applications up 13.7%
QANTM Investor Presentation 10Patent Applications Australia
TOTAL QANTM QANTM
PATENT APPLICATIONS FILED IN AUSTRALIA AUSTRALIA PATENT APPLICATIONS PATENT FILINGS TOTAL MARKET SHARE
FY 2014 – FY 2018 FY 2014 – 2018 FY 2014 – FY 2018
40,000 6,000 16%
35,000 14%
5,000
30,000 12%
4,000
25,000 10%
20,000 3,000 8%
15,000 2,000 6%
10,000 4%
1,000
5,000 2%
0
0 0%
FY 2014 FY 2015 FY 2016 FY 2017 FY 2018
FY 2014 FY 2015 FY 2016 FY 2017 FY 2018 FY 2014 FY 2015 FY 2016 FY 2017 FY 2018 1H 2018 2H 2018
QANTM
TOTAL
• Overall Australian market patent filings • QANTM Australian patent applications down • Decline in annual market share, with soft 1H 2018
down 0.3% FY 2018 vs FY 2017 6.2% from FY 2017
• Recovery in 2H market share to similar levels to prior
• QANTM patent applications 12.0% higher 2H years (2015-2017)
vs 1H 2018
• 2H 2018 applications in line with 2H 2017
QANTM Investor Presentation 11Patent Applications Asia and International
QANTM QANTM
SINGAPORE/ASIA NEW PATENT CASES SECURED TOTAL NEW PATENT CASES SECURED
FY 2014 – FY 2018 FY 2014 – FY 2018
9,000
600
8,000
500 7,000
6,000
400
5,000
300
4,000
200 3,000
2,000
100
1,000
0 0
FY14 FY15 FY16 FY17 FY18 FY14 FY15 FY16 FY17 FY18
Asia (IND, MAL, PHI, THL and VIE) SIN AUS PCT applications Asia (IND, MAL, PHI, THL and VIE) SIN RoW
• Singapore cases filed decreased 18.4% on pcp • Group patent cases stable year-on-year (down 0.6%), despite lower
(Singapore total filings estimated to have decreased) activity level in Asia
• Filings in Asia (ex Singapore) up 13.5% on pcp • Group patent filing market share in NZ higher
• Total Asia filings down 9.3% • Growth in PCT filings 19.8% on pcp; to record level
• Growth in RoW filings 13.7% on pcp; to record level
QANTM Investor Presentation 12Trade Mark Filings Australia
AUSTRALIAN TRADE MARK FILINGS AUSTRALIAN TRADE MARK FILINGS
BY GROUP BY TOP 10 FIRMS
FY 2017 – FY 2018 FY 2017 – FY 2018
8000 3500
7000 3000
6000 2500
5000
2000
4000
1500
3000
1000
2000
1000 500
0 0
FY 2017 FY 2018 No 1 No 2 No 3 No 4 No 5 No 6 No 7 No 8 No 9 No 10
(DCC) (Other Top 10)
QANTM Peer 1 Peer 2
FY 2017 FY 2018
• QANTM Australian trade mark filings up 3% on pcp • DCC retained leading market position and key capabilities in trade
mark applications, design, execution work; combination of 3
• Strong relative performance compared to main peers
competitor firms into one caused DCC to move from #1 to #2 market
• QANTM service charge trade mark revenue increased 2.7% to $14.3 m position despite growth in business
QANTM Investor Presentation 13DCC Trade Mark Filings
New Zealand, Singapore, Malaysia
FY 2017 – FY 2018
400
350
300
250
200
150
100
50
0
New Zealand New Filings Singapore New Filings Malaysia New Filing
FY 2017 FY 2018
• New Zealand trade mark filings up 20.9%
• Singapore filings up 136.4%
• Malaysian filings up nearly three fold
QANTM Investor Presentation 14Legal/Litigation Services
DCC Law recognised as representing largest number of IP cases in Federal Court in 2017
(Lawyerly, 10 August 2018)
Solid case load of client IP litigation and legal services
Legal/litigation revenues increased by 7.5% to $9.6 million
Continuation of current case load expected into 1H 2019
Recruitment of corporate law legal team and development of new service offering to fulfil identified
client requirements, established early FY 2019
QANTM Investor Presentation 15Financial Results
QANTM Investor Presentation 16Summary Profit and Loss
Pro
Year ended 30 June 2018 Statutory Adj Underlying forma FY H2 v H1
% %
COMMENTS
$m FY18 FY18 FY17 Change Change
Revenue Revenue:
Service charges 76.5 76.5 80.4 -4.9% 1.3%
Service charge revenue decline reflects lower patent revenue,
Associate charges 25.2 25.2 22.8 10.5% 25.0%
mainly offshore derived prosecution and advisory
Total Revenue 101.7 101.7 103.2 -1.5% 6.7%
Patent revenue decline of 8.6%, partially offset by growth in
Other income excl FX 2.1 2.1 2.0 5.0% trade mark revenue of 2.7% and legal/litigation revenue
Recoverable expenses (23.4) (23.4) (19.9) 17.6% growth of 7.5%
Associate revenue growth offset by higher recoverable
Operating expenses expenses
Compensation 44.8 (0.9) 43.9 44.2 -0.7% 1.4%
Occupancy 6.5 6.5 6.7 -3.0% H2 improvement, patent revenue stabilised and strong growth
Restructuring and business acquisition 2.3 (2.3) - - - in trade mark revenue
Other 10.7 10.7 10.8 -0.9%
Total Operating expenses 64.3 (3.2) 61.1 61.7 -1.0% 1.7% Expenses:
EBITDA before FX 16.1 3.2 19.3 23.6 -18.2% 5.3% Operating expenses 1.0% lower
Foreign exchange 0.8 0.8 0.9 -11.1% − Staff costs 0.7% lower despite CPI increases, internal
EBITDA after FX 16.9 3.2 20.1 24.5 -18.0% 13.8% promotions, lateral hires and new principal incentives.
Dep'n and amort'n 2.1 2.1 2.0 5.0% Some restructuring benefit in H2
Interest 0.8 0.8 1.0 -20.0% − Occupancy costs down 3.0%
Profit before tax 14.0 3.2 17.2 21.5 -20.0% 17.7%
− Other costs flat with reduction in technology costs offset by
Tax expense 4.5 0.8 5.3 6.7 -20.3%
Net profit after tax 9.5 2.4 11.9 14.8 -19.6% 16.4%
increased marketing and travel for BD activities
Amortisation 1.0 1.0 0.9 11.1% Restructuring and business acquisition costs of $2.3m
NPATA 10.5 2.4 12.9 15.7 -17.8% 15.0% incurred
Capex spend within expected range
EBITDA % after FX - service charge revenue 22.1% 26.3% 30.5% -13.8% 12.6%
Interest expense reduced due to lower average borrowing
EBITDA % after FX - total revenue 16.6% 19.8% 23.7% -16.7% 6.8%
volumes.
Note:
Figures may vary from those shown in the financial statements due to rounding
QANTM Investor Presentation 17Cash Flow Statement
Year ended 30 June 2018 FY 18 FY 17
$m COMMENTS
Receipts from customers 105.9 112.3
Cash provided by operating activities:
Payment to suppliers and employees (89.2) (87.9)
Operating cash flows of $11.3 million, with additional income
Interest and costs of finance paid (0.8) (1.1) tax and restructuring payments plus impact of higher
Income tax paid (4.6) (2.0) recoverable expenses
Net cash provided by operating activities 11.3 21.3 Low working capital requirements
Payments for property, plant and equipment (1.5) (1.3) Cash used in investing activities:
Proceeds from sale of property, plant and equipment - 0.7 Capex expenditure of $1.5 million reflects the continued
Payments for intangible assets (0.2) - investment in the Group’s IT systems, computer hardware
and fitout upgrade costs
Net cash provided by/ (used in) investing activities (1.7) (0.6)
Intangible assets represents investment in software
Proceeds from bank borrowings - 15.7
Cash provided by financing activities:
Repayment of bank borrowings (4.2) (15.9)
Increased dividend cash outlay vs 2017
Proceeds from issue of new shares - 30.8
Borrowing levels better managed with repayments where
Transaction costs relating to issue of new shares - (9.9) possible
Repayment of previous owner loans and distributions - (26.7)
Dividends paid (10.8) (4.8)
Settlement of forward exchange contracts - (0.8)
Net cash used in finance activities (15.0) (11.6)
Net increase/(decrease) in cash and cash equivalents (5.4) 9.1
QANTM Investor Presentation 18Summary Balance Sheet
As at 30 June 2018 FY 2018 FY 2017
COMMENTS
$m
CURRENT ASSETS
Cash and cash equivalents 3.1 8.3 Balance sheet strength
Trade and other receivables 31.6 29.6
Other financial assets - 0.3
Other assets 1.2 1.1
Net debt as at 30 June 2018 was $8.3 million, up from $7.4
TOTAL CURRENT ASSETS 35.9 39.3 million as at 30 June 2017
NON-CURRENT ASSETS Current banking facilities include:
Property, plant and equipment 2.7 2.3
− $25 million working capital facility ($14 million undrawn)
Intangible assets 66.3 67.1
Other assets - 0.1 − $30 million acquisition facility (undrawn)
TOTAL NON-CURRENT ASSETS 69.0 69.5
TOTAL ASSETS 104.9 108.8 Good quality debtor book with low levels of bad and doubtful
debts. Increase at year end with higher billings and some
CURRENT LIABILITIES
Trade and other payables 9.5 8.1
one-off customer system changes impacting debtor book
Provisions 6.4 6.4 Trade and other payables increase mainly represents
Borrowings 0.2 0.6
principal incentive accruals to be paid to the newly
Current tax liabilities 3.2 3.5
established Employee Share Trust
Other financial liabilities 0.1 -
TOTAL CURRENT LIABILITIES 19.4 18.6 Provisions predominantly comprise long service leave and
NON-CURRENT LIABILITIES annual leave
Provisions 2.8 2.7
Borrowings 11.2 15.1
Deferred tax liabilities 1.8 1.5
TOTAL NON-CURRENT LIABILITIES 15.8 19.3
TOTAL LIABILITIES 35.2 37.9
NET ASSETS 69.7 70.9
EQUITY
Issued capital 293.8 293.8
Reserves (222.6) (222.7)
Retained earnings (1.5) (0.2)
TOTAL EQUITY 69.7 70.9 QANTM Investor Presentation 19Income Statement Reconciliation
Statutory to underlying
Statutory NPAT to Underlying NPAT reconciliation
FY 2018 FY 2017
$m
Statutory NPAT 9.5 7.2
add: DCC and FPA pre acquisition NPAT - (2.3)
NPAT – QANTM Group 9.5 4.9
add: interest 0.8 1.0
add: depreciation and amortisation 2.1 1.9
add: tax 4.5 2.8
EBITDA – QANTM Group 16.9 10.6
add: IPO expenses - 6.6
add: share based payments 0.1 1.0
add: employee incentive payments1 0.8 -
add: retention bonuses - 4.5
add: reorganisation expenses - 1.3
add: initial recognition Principal LSL - 1.7
add: partnership expenditure - 0.2
less: notional remuneration adjustment - (1.4)
add: restructuring and business acquistion costs 2.3 -
Underlying EBITDA – QANTM Group 20.1 24.5
less: depreciation and amortisation (2.1) (2.0)
less: interest (0.8) (1.0)
less: tax (5.3) (6.7)
Underlying NPAT - QANTM Group 11.9 14.8
Notes:
1 Represent one-off benefit payments to provide selected employees access to the Company’s shares, facilitated
through the Company’s cash contributions to the Employee Share Trust QANTM Investor Presentation 20Business Initiatives
QANTM Investor Presentation 21Business Initiatives
Business reconfiguration and cost reduction initiatives, advised at half year, implemented
Post IPO reconfiguration and business efficiency measures now largely in place
– incremental efficiency improvements continue
Increased re-investment in revenue generation
– new lateral team hires
– continued higher marketing and business development expenditure in 2019
7 new principals promoted; 2 lateral recruitments in 2018; 12 new principals since listing
Arrangements for incentivising, retaining and the career advancement of professionals
– incentive payments to attract and retain new Principals, facilitated via newly established Employee Share Trust
– 40 internal promotions; of the July 2018 promotions entailed 65% were female representation
Year-on-year operating expenses expected to remain relatively stable
QANTM Investor Presentation 22Acquisition of Advanz Fidelis, Malaysia
Advanz Fidelis provides IP services (consultancy, advisory application, prosecution and renewal
services) in Malaysia to local and foreign clients
Established 2000; 19 fee-generating professionals
Geographical spread of revenue (32% Malaysia derived)
QANTM strategic and business rationale:
− expands QANTM’s position in S.E. Asian market, building upon Singapore presence
− consolidation of QANTM IP work sent from Australia
− ability to leverage QANTM client relationships in overseas locations through Malaysia
QANTM business priorities include:
− integrated Singapore/Malaysia service offering (including fee structure) for DCC and FPA clients
− marketing QANTM capabilities to Advanz clients and prospects
Transaction finalised 2 July 2018; initial payment of A$3.05 million
Additional payments representing 6.5 times normalised EBITDA, subject to earn out over 18 months
QANTM Investor Presentation 23Growth Initiatives
Recruitment of two lateral teams (patents and trademarks)
DCC Law recruitment of corporate law legal team (effective 1 July 2018)
Provision of expanded services sought by clients:
− corporate and private client advisory services
− mergers and acquisitions
− tax and property services
Marketing and business development activities:
− increase in budgeted marketing expenditure following 2018 increase
− lead times typically long but evidence of traction in terms of business generation
Integration of new Malaysian business with DCC and FPA for interchange of case work
FPA Singapore office establishment; complementing DCC presence
New Zealand in-country presence being established (QANTM has 10% market share in New Zealand)
QANTM Investor Presentation 24Priorities
QANTM Investor Presentation 25Priorities
Revenue generation through targeted business development, marketing initiatives and potential
acquisition opportunities
Build S.E. Asian presence, utilisation of FPA and DCC client connections through regional offices
Integration of Advanz Fidelis with QANTM client relationships
Further development of programmes for career progression of key professionals; enhancement of
current depth of IP expertise and service offering
Continued focus on business efficiency and alignment of internal capabilities to market development
QANTM Investor Presentation 26FOR MORE INFORMATION CONTACT:
Leon Allen
Managing Director
Martin Cleaver
Chief Financial Officer
+61 3 9254 2806
www.qantmip.com
QANTM Investor Presentation 27Supplementary Slides
QANTM Investor Presentation 28Intellectual Property – Revenue Stages
Revenue generation at various stages of obtaining, maintaining and enforcement of Intellectual Property Rights
Lifecycle
PROSECUTION MAINTENANCE
GRANT
PHASE 20 year term for patents (mostly renewed annually)
Indefinite term for trade marks (usually renewed 10 yearly)
Acceptance/
Examination /
Administrative Grant or
Filing responding to
Steps Registration/
examination
Processing
ADVISORY
Opposition to grant / enforcement / licensing /
REVENUE advice / litigation
Time line: 0 to > 8 years
This chart demonstrates the main revenue components of the IP rights filing, prosecution and maintenance/renewal phases, with
potential for opposition, advisory and legal/litigation services. It excludes originating application work for new inventions, at a pre-
filing stage, which also generates revenue.
QANTM Investor Presentation 29Patent Originating Application Process
QANTM QANTM
5% in FY17 5% in FY17
First application International PCT
(usually home (PCT) formalities
country) application
Up to another
~130
jurisdictions
possible
12 MONTHS
30 / 31 MONTHS
UP TO 20 YEARS 30
QANTM Investor PresentationYou can also read


