Seven West Media 1HFY17 Results Presentation - Seven ...
←
→
Page content transcription
If your browser does not render page correctly, please read the page content below

Seven West Media
       1HFY17 Results Presentation

Presentation on 15 February 2017 | Results for the Half Year ended 24 December 2016   1
Disclaimer
       Basis of Preparation of Slides

Data included in this presentation is prepared for the management of Seven West Media Limited and its associated entities (together, ‘SWM’). This data is included for
information purposes only and has not been audited or reviewed or subject to the same level of review by SWM as the statutory accounts and so is merely provided for
indicative purposes. SWM and its employees do not warrant the accuracy or reliability of this data and disclaim any liability flowing from the use of this data by any party.
SWM does not accept any liability to any person, organisation or entity for any loss or damage suffered as a result of reliance on this document. All statements other than
statements of historical fact are, or may be deemed to be, forward-looking statements, and are subject to variation.
All forward-looking statements in this document reflect the current expectations concerning future results and events. Any forward-looking statements contained or
implied, either within this document or verbally, involve known and unknown risks, uncertainties and other factors (including economic and market conditions, changes in
operating conditions, currency fluctuations, political events, labour relations, availability and cost of labour, materials and equipment) that may cause actual results,
performance or achievements to differ materially from the anticipated results, performance or achievements, expressed, projected or implied by any forward-looking
statements.
Unless otherwise indicated, all references to estimates, targets and forecasts and derivations of the same in this document are references to estimates, targets and
forecasts by SWM. Estimates, targets and forecasts are based on views held only at the date of this document, and actual events and results may be materially different
from them. SWM does not undertake to revise this document to reflect any future events or circumstances.
Amounts, totals and change percentages calculated on whole numbers and not the rounded amounts presented. The information contained in these pages may not
necessarily be in statutory format. A full reconciliation of EBIT is provided in the Financial Statements.

Presentation on 15 February 2017 | Results for the Half Year ended 24 December 2016   2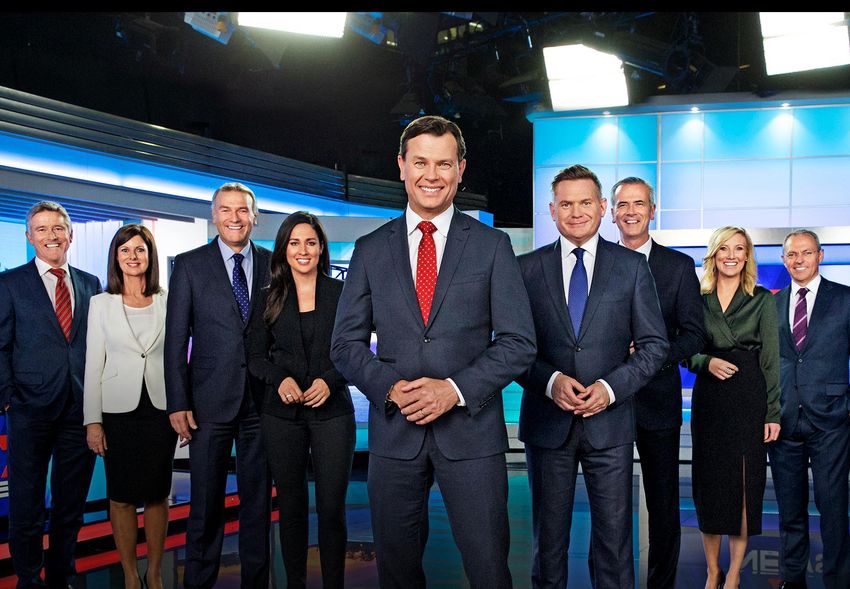
Agenda
       1HFY17 Results Presentation

       Performance & Outlook
       Financial Results
       Operating Performance
       Strategy
       Q&A

Presentation on 15 February 2017 | Results for the Half Year ended 24 December 2016   3
Performance & Outlook
       Maintain Leadership

                                                               ▪     Maintain leadership in all core markets
    Maintain                                                   ▪     Monetise strong audience performance
   Leadership                                                  ▪     Leverage the strength of our content and brands to establish leadership in new markets
                                        Focus

                                                               ▪ 21st consecutive half of TV ratings and revenue leadership

                                      Progress
                                                               ▪ Most profitable Australian FTA TV business

                                                               ▪ in all key TV demographics

                                                               ▪ Live streaming broadcaster and #1 catch-up TV app

                                                               ▪ Australian digital content publisher since August 2016

                                                               ▪ Publisher in target markets

Presentation on 15 February 2017 | Results for the Half Year ended 24 December 2016       4
Performance & Outlook
Redefine the Operating Model
▪ Multiplatform content teams
Redefine
the ▪ Drive greater utilisation of content across assets to maximise SWM and client outcomes
Operating ▪ Leverage technology to drive greater efficiencies
Model Focus
▪ Multiplatform delivery of major content – Rio 2016 Olympics, AFL,
7Tennis and key owned programming
Progress
▪ Cross network cost sharing programs in TV accelerating
▪ Completed the first phase of The Sunday Times and PerthNow
integration
▪ Pacific portfolio rationalised resulting in a 20% headcount reduction
▪ Development of unique multiplatform sales proposition
Presentation on 15 February 2017 | Results for the Half Year ended 24 December 2016 5
Performance & Outlook
Fuel New Growth
▪ Expand content production capabilities domestically and overseas
▪ Leverage the scale of SWM’s total audiences to accelerate new revenue streams and
Fuel New investments
Growth
Focus ▪ Capitalise on digital innovation and new investments
▪ Largest production company in Australia with continued strong
growth in global commissions and program sales
Progress
▪ New digital revenue streams across assets – digital revenue up 200% 1
▪ New digital products establishing leadership positions 2
▪ Significant growth in the value of digital investments leveraging the
power of our assets
Note/s: 1. 100% SWM-owned digital assets; revenue for 1HFY17 vs. pcp. 2. For example, Beauty Crew is now Australia’s #1 digital beauty destination.
Presentation on 15 February 2017 | Results for the Half Year ended 24 December 2016 6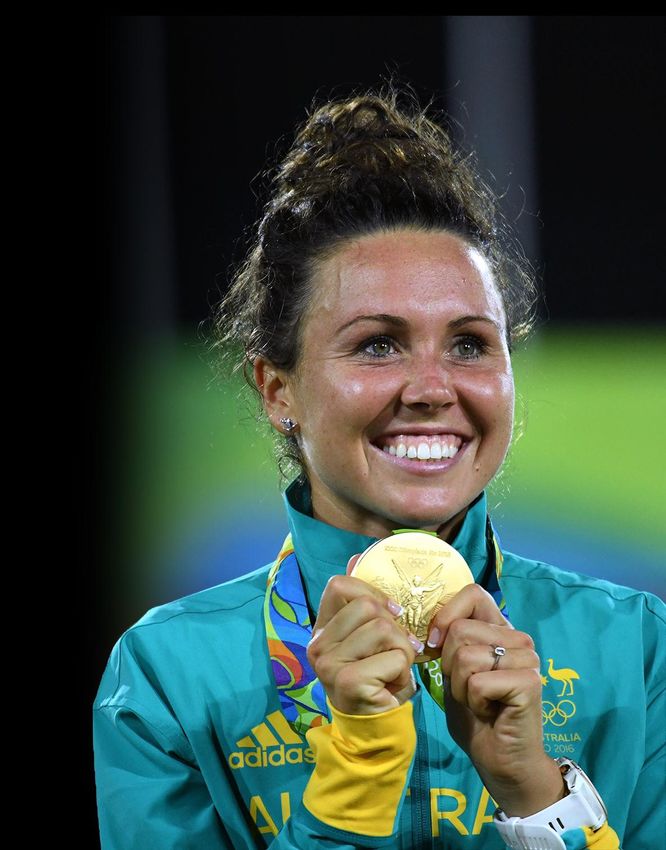
Performance & Outlook
       1HFY17 Results

1HFY17 Financials
▪     EBIT of $148.5m down 27.7% (incl. results from early stage investments)
▪     Costs down 3.8% (excl. major events and 3rd party commissions)
▪     Profit after tax of $12.4m incl. significant items, $95.7m excl. significant items
▪     Operating cash conversion at 102% with operating cashflow of $174.7m
▪     Group net debt leverage ratio of 2.2x
▪     Interim dividend of 2 cents per share fully franked

Outlook
▪     AGM guidance maintained based on current visibility
▪     Group EBIT to be down approximately 20% year-on-year (YoY)
▪     Group operating costs down incl. AFL (excl. Olympics and 3rd party commissions)
▪     TV advertising market to be down low single digits YoY, 2HFY17 trending better vs. 1HFY17
▪     Full year publishing advertising market trends to continue
▪     Program sales and 3rd party commissions to deliver greater than 25% revenue growth, strengthening our position for the future
▪     100% SWM-owned digital to deliver greater than 150% annual revenue growth

Presentation on 15 February 2017 | Results for the Half Year ended 24 December 2016   7
Financial Results
       1HFY17 Results Presentation

Presentation on 15 February 2017 | Results for the Half Year ended 24 December 2016   8
Financial Results
       Key Group Results

Statutory Results1
$m                                                                                                                         1HFY17                       1HFY16      Inc/(dec) %
Profit before tax                                                                                                            46.8                        178.6        (73.9)
Profit after tax                                                                                                             12.4                        135.2        (90.8)
Basic EPS                                                                                                                 0.8 cents                     9.0 cents
Diluted EPS                                                                                                               0.8 cents                     8.9 cents
Proposed interim FY17 dividend                                                                                            2.0 cents                     4.0 cents

Additional Information
$m                                                                                                                         1HFY17                       1HFY16      Inc/(dec) %
Profit after tax (excl. significant items)                                                                                   95.7                        140.3        (31.8)
Significant items (net of tax)                                                                                              (83.3)                        (5.1)        nm3
Profit after tax (incl. significant items)                                                                                   12.4                        135.2        (90.8)
Basic EPS2                                                                                                                6.4 cents                     9.3 cents
Diluted EPS2                                                                                                              6.4 cents                     9.3 cents

Note/s: 1. Statutory results incl. significant items. 2. EPS based on net profit excl. significant items (net of tax). 3. “nm” means “not meaningful”

Presentation on 15 February 2017 | Results for the Half Year ended 24 December 2016                          9
Financial Results
       Consolidated Income Statement

$m                                                                                         1HFY17    1HFY16    Inc/(dec) %
Revenue and other income                                                                   906.1     896.7         1.0
Share of loss of equity accounted investees                                                 (0.9)     (3.8)      (76.3)
Expenses (incl. depreciation)                                                              (756.6)   (687.5)      10.1
Profit before significant items, net finance costs and tax (EBIT)                          148.5     205.4       (27.7)
Net finance costs                                                                          (19.1)    (19.5)       (2.1)
Profit before significant items and tax                                                    129.4     185.9       (30.4)
Significant items before tax                                                               (82.6)     (7.3)       nm
Profit before tax                                                                           46.8     178.6       (73.9)
Tax expense                                                                                (34.4)    (43.4)      (20.7)
Profit after tax                                                                            12.4     135.2       (90.8)

Underlying profit after tax (excl. significant items)                                       95.7     140.3       (31.8)

Presentation on 15 February 2017 | Results for the Half Year ended 24 December 2016   10
Financial Results
Consolidated Cashflow
$m 1HFY17 1HFY16 Inc/(dec) %
EBITDA 170.8 229.3 (25.5)
Working capital and other movements 18.7 (46.1) nm
Redundancy and restructuring (significant items) (16.4) (2.8) nm
Dividends received net of share of associates profit 1.6 6.3 (74.6)
Operating cash flows before interest and tax 174.7 186.7 (6.4)
Net tax paid (33.8) (7.0) nm
Net finance costs paid (14.9) (17.2) (13.4)
Net payment for property, plant & equipment and software (11.9) (12.7) (6.6)
Proceeds and payments for investments (incl. loans) (20.9) (6.4) nm
Dividends paid (60.3) (60.5) (0.3)
Proceeds from share sale / (buy back and transaction costs) 0.6 (5.4) nm
Net increase in cash and cash equivalents 33.5 77.5 (56.8)
Presentation on 15 February 2017 | Results for the Half Year ended 24 December 2016 11Financial Results
Net Debt
$m 1HFY17 FY16 Inc/(dec) %
Total borrowings¹ 834.4 810.8 2.9
Cash (153.3) (94.8) 61.7
SWM total net debt 681.2 716.0 (4.9)
SWM LTM EBITDA 305.0 363.5 (16.1)
SWM Total Leverage Ratio 2.2x 2.0x
SWM Interest Cover Ratio 9.9x 10.8x
Note/s: 1. Total borrowings of $834.4m are net of unamortised refinancing costs of $5.2m (June 2016: $4.2m).
Presentation on 15 February 2017 | Results for the Half Year ended 24 December 2016 12Financial Results
Seven
$m 1HFY17 1HFY16 Inc/(dec) %
Revenue
Broadcast & digital advertising, affiliate fees and other revenue1 648.7 619.9 4.6
Program sales and 3rd party commissions 50.2 43.0 16.7
698.9 662.9 5.4
Costs
Revenue variable costs² (32.9) (39.0) (15.5)
Depreciation & amortisation (10.2) (12.2) (16.2)
Other costs (512.8) (426.3) 20.3
(555.9) (477.5) 16.4
EBIT 143.0 185.4 (22.9)
Note/s: 1. Advertising revenue includes advertorial revenue. 2. Revenue variable costs include licence fees, contra and advertorial costs which are directly variable to revenue streams.
Presentation on 15 February 2017 | Results for the Half Year ended 24 December 2016 13Financial Results
The West1
$m 1HFY17 1HFY16 Inc/(dec) %
Revenue
Advertising 65.7 78.0 (15.8)
Print & digital circulation 27.3 28.6 (4.6)
Other 15.5 14.8 4.7
108.5 121.4 (10.7)
Costs
Depreciation & amortisation (10.5) (10.7) (1.9)
Other costs (83.1) (86.7) (4.2)
(93.6) (97.4) (3.9)
EBIT 14.9 24.0 (38.0)
Pro forma results2
Revenue 126.7 121.4 4.4
Costs (incl. depreciation & amortisation) (105.1) (97.4) 7.9
EBIT 21.6 24.0 (10.0)
Note/s: 1. The Sunday Times and PerthNow acquisition was completed on 16 November 2016. 2. Pro forma based on The Sunday Times and PerthNow acquisition completed 26 June 2016.
Presentation on 15 February 2017 | Results for the Half Year ended 24 December 2016 14Financial Results
Pacific
$m 1HFY17 1HFY16 Inc/(dec) %
Revenue
Circulation 57.8 67.1 (13.8)
Advertising 25.4 32.8 (22.5)
Digital (and other) 8.7 6.1 42.6
91.9 106.0 (13.3)
Costs
Depreciation & amortisation (1.3) (0.7) 85.7
Other costs (89.3) (98.0) (8.9)
(90.6) (98.7) (8.2)
EBIT 1.3 7.3 (82.8)
Pro forma results1
Revenue 85.3 91.2 (6.5)
Costs (incl. depreciation & amortisation) (80.2) (85.8) (6.5)
EBIT 5.1 5.4 (7.2)
Note/s: 1. Pro forma based on continuing operations – post restructure, assuming titles were closed in both periods and restructuring completed on 26 June 2016.
Presentation on 15 February 2017 | Results for the Half Year ended 24 December 2016 15Financial Results
Other Business & New Ventures
$m 1HFY17 1HFY16 Inc/(dec) %
Revenue
Other revenue (incl. radio) 7.4 8.5 (11.7)
Yahoo7 share of net profit (incl. significant items) 3.4 5.7 (40.4)
10.8 14.2 (23.3)
Costs
Depreciation & amortisation (0.3) (0.3) 0.0
Other costs (5.4) (5.6) (4.4)
(5.7) (5.9) (3.3)
EBIT (excl. early stage investments) 5.1 8.3 (37.8)
Early stage investments share of net losses (8.0) (11.7) (30.8)
EBIT (2.9) (3.4) (14.3)
Presentation on 15 February 2017 | Results for the Half Year ended 24 December 2016 16Operating Performance
1HFY17 Results Presentation
TOTAL BROADCAST AUDIENCE SOCIAL FTA NEWS APP
FOR NEWS
Presentation on 15 February 2017 | Results for the Half Year ended 24 December 2016 17Operating Performance
Seven
▪ #1 for our 21st consecutive ratings half year
▪ #1 network in ratings and revenue share (40.8%)
▪ #1 in all key demographics with best performance
since 2011
▪ 10 of the top 20 regular programs on Seven in 2016
▪ Seven leads in drama – Top 3 (Wanted, 800 Words, and The
Secret Daughter)
▪ Cost per hour of local programming down 22% YoY
▪ Underlying cost performance down 3.4% (excl. one off events
and 3rd party commissions)
▪ Seeking further license fee reduction in 2017 May Federal
Budget
▪ Core sporting rights locked in to at least 2019
▪ Portfolio of huge live events secured out to Tokyo 2020 Olympics
with an option to extend
Source/s: FreeTV, OzTAM.
Presentation on 15 February 2017 | Results for the Half Year ended 24 December 2016 18▪ Halo effect from premium sports rights strengthens leadership position and provides long-term certainty in audience ▪ Secures long-term advertiser commitments in revenue ▪ Sports rights will be critical for the launch of future products in the market Presentation on 15 February 2017 | Results for the Half Year ended 24 December 2016 19
Operating Performance
Sports Rights
Olympics on 7
▪ 18.6m Australians reached with Seven’s coverage of Rio 2016
▪ 38m streams and 74m domestic social video views
▪ 2.9m unique online audience and 250k premium subscribers
▪ Revenue shares locked in to 2020 with major advertisers
▪ PyeongChang 2018 and Tokyo 2020 Olympics both in an Australian time zone
AFL
▪ More AFL content in 2017
▪ Ad inventory integration and more prime time games will drive greater
monetisation across all platforms
▪ 2016 Grand Final delivered highest audience in a decade
▪ Strong advertiser demand for Women’s AFL
Tennis
▪ 2017 Australian Open tennis delivered a strong performance for Seven’s
launch into our 2017 schedule:
Highest rating men's final in a decade peaking at 4.4m viewers
7Tennis streaming up 44% YoY and up 188% YoY for the men’s final
Presentation on 15 February 2017 | Results for the Half Year ended 24 December 2016 20Operating Performance
Seven Productions
▪ Program sales and 3rd party commissions revenue up 17%
▪ 7Productions, 7Wonder and 7Beyond now producing over 850 hours
of scripted, factual, kids and reality programming per annum1
▪ Acquired UK-based scripted drama producer Slim Productions
▪ Launched New Zealand production company
▪ 15 commissions secured 1HFY17 incl. A Place to Call Home, My
Lottery Dream House, MKR
▪ MKR’s global footprint continues to grow
UK: 2nd season commissioned by CH4
NZ: 3rd and 4th seasons commissioned by TVNZ
US: Celebrity version debuting on Fox
▪ Platform7 launched focused on short-form video content
Note/s: 1. Does not include news or sports productions which contribute hundreds of hours of additional content.
Presentation on 15 February 2017 | Results for the Half Year ended 24 December 2016 21Operating Performance
Seven Digital & Yahoo7
▪ SWM (incl. Yahoo7) #1 Australian digital content publisher with Streaming Growth Across SWM Digital Assets3
average monthly unique audience of 11.3m in 1HFY171
▪ Scale in total video and first-party audience data fundamental to
growth strategy
+207 % +142 % +44 % +18%
▪ 100% SWM-owned digital revenue up 200% in 1HFY17
▪ #1 AVOD catch-up app PLUS7 and #1 live streaming network
delivering strong audience and revenue growth
▪ Yahoo7 native and video now represents greater than 50% of
revenue, however transition of premium display to programmatic Airtasker – Seven Integration Traffic Benefits2
impacting yields
▪ First-party audience data set increased +1.3m profiles vs. pcp to
5.7m total 1,100%
increase
▪ Freeview Plus / Hybrid TV now available in almost 2m Australian
TVs within 26 months since launch
▪ Growing portfolio of digital investments benefiting strongly from
the power of SWM assets to rapidly scale (see right)2
▪ OzTAM VPM now measuring catch-up TV VPM + live streaming,
accounting for 1-2% of all total video consumption
7:00pm 8:00pm 9:00pm
Source/s: 1. Nielsen Digital Ratings Monthly (see next slide). 2. Google Analytics, Company data. Measured by Pages per Minute. Importantly, the ‘spikes’ in visits was driven by highly desirable new users as
more traffic was to ‘first-timer’ pages (e.g. “How It Works”), 3. Seven internal analytics and OzTAM Video Player Measurement (VPM) November 2015 to January 2017. Plus7 and 7Live comparatives for the
December 2016 versus the prior half, 7Tennis and 7 Horse Racing comparison versus previous event.
Presentation on 15 February 2017 | Results for the Half Year ended 24 December 2016 22Operating Performance
Seven Digital (incl. Yahoo7) Audience
Total Audience1 Smartphone2
Unique Audience (000s)
Unique Audience (000s)
11,285 10,648 6,484
10,513
5,467
4,763
5,197
1,666
4
SWM (incl. Yahoo7) Fairfax Media News Australia Nine Entertainment SWM (incl. Yahoo7) Fairfax Media News Australia Nine Entertainment
Co. Co.
+ +
Catch-up TV App1 Millennial Audience3
Unique Audience (000s)
Unique Audience (000s)
942 3,751
854 3,315 3,207
621 614
527
285 1,299
PLUS7 ABC iView Foxtel Go 9Now TENplay SBS on SWM (incl. Yahoo7) Fairfax Media News Australia Nine Entertainment
Demand Co.
+
Source/s: 1. Nielsen Digital Ratings Monthly, average monthly unique audience from July 2016 to December 2016. 2. Nielsen Digital Ratings Monthly, average monthly unique audience on smartphone from July
2016 to December 2016. 3. Nielsen Digital Ratings Monthly, average monthly unique audience (P18-34) from July 2016 to December 2016. 4. News Australia including its investments in realestate.com.au and
Foxtel has a combined unique audience of 11,627,000 people (Nielsen Digital Ratings Monthly, December 2016). The above competitive set is not represented as an official category ranking by Nielsen.
Advertising networks custom rollups are not represented here.
Presentation on 15 February 2017 | Results for the Half Year ended 24 December 2016 23Operating Performance
The West
▪ Local WA content 7 days a week across print, TV and digital
▪ The West Australian the best performing metro newspaper in
Australia
Readership up 3.7% and digital editions up 80%
▪ Ongoing cost management with costs down 6.5% (excl. The
Sunday Times and PerthNow)
▪ Acquisition of The Sunday Times and PerthNow completed in
November 2016
First phase of integration complete
▪ Digital strategy gains momentum:
New digital products for The West Australian launched
December 2016
Digital audience up 163% to 1.1m per month1
Digital revenues up 107% YoY, well ahead of market
Focus on short-form video gaining traction
Note 1: Nielsen.
Presentation on 15 February 2017 | Results for the Half Year ended 24 December 2016 24Operating Performance
Pacific
▪ Strategic portfolio rationalisation undertaken with mastheads ▪ Fastest growing digital publisher, #1 mobile and #1 social
closed, refocused or divested publisher
Cost base to decline by approximately 20% in 2HFY17 ▪ Digital revenue up 102% YoY with momentum increasing
Key licenses renegotiated on more favourable terms ▪ Revenue diversification continues with eCommerce capacity
expanding
20% headcount reduction
BHG shop and Styled by marie claire growing in both
▪ Monthly unique audience for Pacific-owned digital sites
audience and digital revenue
launched in June 2016 now 1.7m with accelerating growth1
▪ Pacific’s portfolio represents 12% of total market titles vs. 27% ▪ New digital products establishing leadership positions with
Beauty Crew now Australia’s #1 digital beauty destination2
representation of total magazine market readership
Note 1: Nielsen Unique Audience to December 2016. 2. Nielsen average daily UB July-December 2016
Presentation on 15 February 2017 | Results for the Half Year ended 24 December 2016 25Strategy
Outlook
▪ Accelerating pace of transformation from a traditional media
company to a platform agnostic content & audience business
▪ Unique multiplatform sales proposition to be launched in 3QFY17
to capitalise on changing industry structure
▪ Build on TV effectiveness campaign with advertisers, focusing on
measurability, transparency and ROI driven by ThinkTV
▪ Drive enhanced monetisation of our digital audiences, capturing
a greater share of growing digital video market
▪ Grow multiplatform content production presence in Asia, Europe,
and US, and build on successes in Australia
▪ Maintain cost focus, driving greater operating efficiencies across
the business
▪ Leverage the power and reach of our assets to build and invest in
new disruptive models
▪ Evaluating options around Yahoo7 / Verizon transaction, delayed
to 2QCY17
Presentation on 15 February 2017 | Results for the Half Year ended 24 December 2016 26Q&A
1HFY17 Results Presentation
Presentation on 15 February 2017 | Results for the Half Year ended 24 December 2016 27Appendix
1HFY17 Results Presentation
Presentation on 15 February 2017 | Results for the Half Year ended 24 December 2016 28Appendix
“It’s Prime Time to Rethink TV”
▪ TV’s reach and mass appeal remains unrivalled1 TV Makes More Money for Brands5
Broadcast TV reaches over 20m Australians every week2
TV’s top 50 programs of 2016 all delivered audiences in
excess of 1.7m viewers3
90% of broadcast TV is watched in the live environment2
62% of Australians rate TV as their #1 entertainment
activity4
▪ TV remains the dominant media channel in driving sales and is
the only media channel likely to payback
TV drives 2x greater ROI than online video, print and radio5
TV Impact Lasts Longer5
TV retains ~65% of its impact from the previous week with
stronger recall than other media5
Average Retention Rate
65%
▪ Multiplatform TV also has a significant halo effect on other
forms of advertising, and has a measurable, long-term impact
on driving incremental sales and building brands6 28%
23% 22% 19% 17%
▪ Importantly, technology is making TV (even) better
TV Outdoor Video Online Print Radio
Display
Note/s: 1. Sourced from ThinkTV. 2. Australian Multiscreen Report Q3 2016. 3. OzTAM & RegionalTAM, program audience averages have been combined to form a national estimate and ranking, based on
week’s 1-49 2016, fact 9 sourced ACMA Communications Report 2015-2016. 4. Deloitte’s Media Consumer Survey 2016. 5. Ebiquity “Payback” Study Wave 1 (FMCG, OTC and Beverages) November 2016. 6.
Accenture “Cross-channel advertising attribution: New insights into Multiplatform TV” (2016). Research found that 18% of the ROI typically attributed to search, display and short-form video is actually derived
from multiplatform TV, and has a 1.3x effect on incremental sales in years 2-3 vs. year 1. 22% of key brand health and awareness metrics are driven by multiplatform TV advertising.
Presentation on 15 February 2017 | Results for the Half Year ended 24 December 2016 29Appendix
Group Revenue
$m 1HFY17 1HFY16 Inc/(dec) %
Revenue1
Seven 698.9 662.9 5.4
The West 108.5 121.4 (10.7)
Pacific 91.9 106.0 (13.3)
Other Business & New Ventures2 5.8 2.5 138.2
Corporate - 0.1 -
905.1 892.9 1.4
Revenue (as a % of Group)
Seven 77% 74%
The West 12% 14%
Pacific 10% 12%
Other Business & New Ventures 1% 0%
Corporate - 0%
Note/s: 1. Totals may differ from earlier slides due to rounding. 2.Includes share of loss of equity accounted investments ($0.9m).
Presentation on 15 February 2017 | Results for the Half Year ended 24 December 2016 30Appendix
Group Costs & EBIT
$m 1HFY17 1HFY16 Inc/(dec) %
Costs¹
Seven (555.9) (477.5) 16.4
The West (93.6) (97.4) (3.9)
Pacific (90.6) (98.7) (8.2)
Other Business & New Ventures (8.8) (5.9) 47.6
Corporate (7.7) (8.0) (4.0)
(756.6) (687.5) 10.1
EBIT
Seven 143.0 185.4 (22.9)
The West 14.9 24.0 (38.0)
Pacific 1.3 7.3 (82.8)
Other Business & New Ventures (2.9) (3.4) (14.3)
Corporate (7.7) (7.9) (2.4)
148.5 205.4 (27.7)
Note/s: 1. Costs include depreciation & amortisation and excl. significant items.
Presentation on 15 February 2017 | Results for the Half Year ended 24 December 2016 31You can also read