Global Dairy UPDATE - Amazon AWS

Page created by Thomas Carrillo
 
CONTINUE READING
Global Dairy UPDATE - Amazon AWS
JANUARY 2021

Global Dairy
UPDATE
Our Markets                                                      Our Performance

               • December production in New Zealand flat         • Darfield site adds new shift to meet cream cheese demand.
                 on last year. Australia monthly production
                 flat. US and EU monthly production
                 increased relative to last year.

               • New Zealand and Australia exports
                 increased in November. EU and US
                 monthly exports down.
                                                                 Our Co-op
               • China imports continue to increase and
                 Latin America monthly imports also up.          • Promising plantain trial looking good for the planet.
                 Decline in Middle East and Africa and
                 Asia imports.

               • Fonterra’s season-to-date New Zealand milk
                 collection reached 902.8 million kgMS at the
                 end of December, down 0.7% on last season.
               • Fonterra's Australia milk collection for
                 December increased 1.3% to 11.4 million kgMS,
                 but was down 2.2% for the season to date
                 relative to last season.

Key Dates
28 February 2021                  17 March 2021                  20 April 2021                      May 2021
Final Date for Application to     FY21 Interim Results           Share Standard Compliance          FY21 Q3 Business Update
Supply Fonterra                   Announcement                   Date for 2020/21 Season

                                                                                                                               1
Global Dairy UPDATE - Amazon AWS
OUR MARKETS
Global Production

                                                  December production in
                                                  New Zealand flat on last
                                                  year. Australia monthly
                                                  production flat. US and EU
To view a chart that                              monthly production
                                                  increased relative to last year
illustrates year-on-year
changes in production –

      CLICK HERE

NEW ZEALAND                                       AUSTRALIA                                   EUROPEAN UNION/UK               USA

   0.7 %
   Change for December 2020
                                                    0.0%
                                                    Change for November 2020
                                                                                                 1.1%
                                                                                                 Change for November 2020
                                                                                                                                3.1%
                                                                                                                                Change for December 2020
   compared to December 2019                        compared to November 2019                    compared to November 2019      compared to December 2019

   0.4%
   Change for the 12 months
                                                    3.0%
                                                    Change for the 12 months
                                                                                                 0.8%
                                                                                                 Change for the 12 months
                                                                                                                                2.1%
                                                                                                                                Change for the 12 months
   to December 2020                                 to November 2020                             to November 2020               to December 2020

New Zealand milk                                  Australia milk                              EU (including UK) milk          US milk production
production¹ was relatively                        production was flat in                      production increased by         increased by 3.1% in
flat in December compared                         November compared to                        1.1% in November compared       December compared to the
to December last year                             November 2019. Warm and                     to the same period last year.   same period last year.
increasing 0.7% on a litres                       wet weather continued to
                                                                                              The increase in production      December saw continued
basis (up 1.0% on a milk                          improve pasture growth
                                                                                              was observed across key         strong production volumes
solids basis).                                    through spring though smaller
                                                                                              producing countries such        as farmers drive higher milk
Following a 2.5% drop year-                       herds, a drop in farm numbers
                                                                                              as Ireland (up 8.6%), Italy     per cow yields and herd
on-year in November driven                        and labour challenges
                                                                                              (2.0%), UK (1.9%) and           sizes. There is some concern
by challenging weather                            impacted milk production
                                                                                              Poland (1.5%). This increase    that this sustained growth
conditions, milk production                       growth. Dairy Australia                     was partially offset by a       rate will lead to pressure on
growth has improved in                            expects milk production to                  continuing decline in France    processing capacity during
December as milder and                            track towards the lower end                 and Germany.                    spring peak.
drier weather settled in.                         of the current 2020/21 growth
New Zealand milk                                  range of 1-3%.                              EU milk production for the      Milk production for the
production for the 12 months                      Australia milk production for               12 months to November was       12 months to December was
to December was also                              the 12 months to November                   up by 0.8% compared to the      2.1% higher compared to the
relatively flat on last year at                   was 3.0% higher than                        same period last year.          same period last year.
0.4% higher.                                      last year. Fonterra collections
Fonterra collections are                          in Australia are reported
reported for December, see                        for December, see page 5
page 5 for details.                               for details.
1 New Zealand production is measured in litres.
Note: 2020 production numbers include one extra day of production in February as 2020 was a leap year.

                                                                                                                                                              2
Global Dairy UPDATE - Amazon AWS
OUR MARKETS
Global Exports

                               New Zealand and Australia
                               exports increase in
                               November. EU and US
                               monthly exports down
To view a chart that
illustrates year-on-year
changes in exports –

     CLICK HERE

NEW ZEALAND                    AUSTRALIA                        EUROPEAN UNION/UK                USA

  8.7%
  Change for November 2020
                                 6.9 %
                                 Change for November 2020
                                                                  9.5%
                                                                  Change for October 2020
                                                                                                   3.1%
                                                                                                   Change for November 2020
  compared to November 2019      compared to November 2019        compared to October 2019         compared to November 2019

  2.3%
  Change for the 12 months
                                 2.2%
                                 Change for the 12 months
                                                                  2.7%
                                                                   Change for the 12 months
                                                                                                   11.7%
                                                                                                   Change for the 12 months
  to November 2020               to November 2020                  to October 2020                 to November 2020

Total New Zealand dairy        Australia dairy exports          EU (including UK) dairy          US dairy exports
exports increased by 8.7%,     increased by 6.9%, or            exports decreased by 9.5%,       decreased 3.1%, or 6,189 MT, in
or 32,823 MT, in November      4,415 MT, in November            or 49,277 MT, in October         November compared to the
compared to the same           compared to the same             compared to the same             same period last year.
period last year.              period last year.                period last year.                Exports volumes decreased
Record volumes of WMP to       This was primarily driven by     This was driven by decreases     for the first time in over a year.
China and South East Asia of   increased demand for fluid       in SMP to Saudi Arabia,          This was led by lower demand
31,421 MT led this increase.   milk products and WMP, up        infant formula to Hong Kong      for SMP from South East Asia
This was offset by decreases   a combined 6,329 MT, and         and Russia and butter to         and for cheese by Mexico.
in butter and fluid milk       partially offset by decreases    the United Arab Emirates         Demand for whey from
products, down a combined      in infant formula, down          and Morocco.                     China continued to increase,
6,852 MT.                      2,306 MT.                                                         attributable to recovering
                                                                Exports for the 12 months        hog herds.
Exports for the 12 months      Exports for the 12 months        to October were up 2.7%, or
                                                                                                 Exports for the 12 months
to November were down by       to November were down            152,175 MT, on the previous
                                                                                                 to November 2020 were
2.3%, or 81,486 MT, on the     2.2%, or 16,430 MT, on the       comparable period. Fluid
                                                                                                 up 11.7%, or 262,870 MT, on
previous comparable period.    previous comparable period.      milk products, cheese, butter,
                                                                                                 the previous comparable
This was primarily driven by                                    whey and WMP were the
                               Declines were recorded                                            period driven by SMP, whey
butter, infant formula, SMP,                                    main drivers of this growth,
                               across a broad range of                                           and WPC, up a combined
and cheese.                                                     up a combined 299,504 MT.
                               products with infant formula,                                     248,998 MT.
                                                                It was partially offset by a
                               cheese, WMP, SMP, down
                                                                large decline in SMP down
                               a combined 35,353 MT,
                                                                163,387 MT.
                               partially offset by fluid milk
                               products, up 11,099 MT.

                                                                                                                                  3
Global Dairy UPDATE - Amazon AWS
OUR MARKETS
Global Imports

                                               China imports continue to
                                               increase and Latin America
                                               monthly imports also up.
                                               Decline in Middle East and
To view a chart that
illustrates year-on-year
                                               Africa and Asia imports
changes in imports –

      CLICK HERE

LATIN AMERICA                                  ASIA                             MIDDLE EAST & AFRICA            CHINA

  2.6%
   Change for October 2020
                                                 4.0%
                                                  Change for October 2020
                                                                                  12.0%
                                                                                  Change for October 2020
                                                                                                                  10.0%
                                                                                                                  Change for November 2020
   compared to October 2019                       compared to October 2019        compared to October 2019        compared to November 2019

  2.2 %
   Change for the 12 months
                                                 3.0%
                                                  Change for the 12 months
                                                                                  3.8%
                                                                                   Change for the 12 months
                                                                                                                  10.4%
                                                                                                                  Change for the 12 months
   to October 2020                                to October 2020                  to October 2020                to November 2020

Latin America dairy                            Asia (excluding China)           Middle East and Africa          China dairy import
import volumes¹ increased                      dairy import volumes¹            dairy import volumes¹           volumes increased by 10%,
2.6%, or 3,941 MT, in October                  decreased 4.0%, or 15,381 MT,    decreased 12.0%, or             or 28,565 MT, in November
compared to the same period                    in October compared to the       31,383 MT in October 2020       compared to the same
last year.                                     same period last year.           compared to the same period     period last year.
                                               Decreases were recorded for      last year.                      Import volumes of fluid milk
This was driven by higher
volumes of WMP to Brazil                       WMP to Vietnam, Hong Kong        Decreases were driven           products, up 23,401 MT, from
but partly offset by lower                     and Singapore, and whey to       principally by lower volumes    Germany and New Zealand
shipments of SMP to Mexico.                    Indonesia. This was partially    of infant formula and SMP       continued to increase as
                                               offset by an increase in         to Nigeria and fluid milk       dairy consumption is widely
Imports for the 12 months to                   cheese to Japan.                                                 promoted to boost immunity.
                                                                                products to Kenya.
October were down 2.2%,
                                               Imports for the 12 months to                                     Whey imports were also up
or 38,998 MT, compared                                                          Imports for the 12 months
                                               October were down 3.0%, or                                       19,739 MT, primarily from the
to the same period the                                                          to October 2020 were
                                               147,838 MT, compared to the                                      US as China continues to
previous year.                                                                  down 3.8%, or 149,867 MT,
                                               same period the previous year.                                   rebuild its hog herds using
                                                                                compared to October last
Decreases were driven                          Decreases were recorded                                          whey as feed.
                                                                                year driven by decreases in
primarily by SMP, infant                       across WMP, SMP and                                              Imports for the 12 months to
                                                                                fluid milk products, infant
formula and butter, down                       fluid milk products, down a                                      November were up 10.4%, or
                                                                                formula and cheese, down
a combined 58,702 MT and                       combined 187,680 MT, and                                         325,647 MT, driven by whey,
                                                                                a combined 331,774 MT, and
partly offset by increased                     offset partially by increased                                    fluid milk products, butter
                                                                                partially offset by increases
volumes of cheese and WMP.                     volumes of lactose, up                                           and lactose.
                                                                                in SMP.
                                               48,282 MT.
1 Estimates are included for those countries that have not reported data.

                                                                                                                                              4
OUR MARKETS
Fonterra Milk Collection

                                  New Zealand Milk Collection
                                                             90

                                  VOLUME (M LITRES/DAY)       75

                                                             60

                                                             45

                                                             30

                                                              15
To view a table that shows our
detailed milk collection in New
Zealand and Australia compared                                0
                                                                   JUN      JUL    AUG     SEP       OCT        NOV        DEC   JAN    FEB       MAR        APR     MAY
to the previous season –
                                                                         2020/21      2019/20         2018/19
     CLICK HERE

NEW ZEALAND                       NORTH ISLAND                                                   SOUTH ISLAND                          AUSTRALIA

  0.7%
  Change for December 2020
                                                          0.6%
                                                          Change for December 2020
                                                                                                   0.7%
                                                                                                   Change for December 2020
                                                                                                                                        1.3%
                                                                                                                                         Change for December 2020
  compared to December 2019                               compared to December 2019                compared to December 2019             compared to December 2019

  0.7%
  Season to date
                                                          0.6%
                                                          Season to date
                                                                                                  1.0%
                                                                                                   Season to date
                                                                                                                                        2.2%
                                                                                                                                         Season to date
  1 June to 31 December                                   1 June to 31 December                    1 June to 31 December                 1 July to 31 December

Fonterra's New Zealand            North Island milk                                              South Island milk                     Fonterra's Australia
collection for December           collection in December                                         collection in December                collection in December
was 183.1 million kgMS,           was 105.8 million kgMS,                                        was 77.3 million kgMS,                was 111.4 million kgMS, a
down 0.7% on December             down 0.6% on December                                          down 0.7% on December                 1.3% increase on December
last season.                      last season.                                                   last season.                          last season.
                                                                                                                                       Above average rainfall and
Season-to-date collection to      Season-to-date collection                                      Season-to-date collection
                                                                                                                                       cooler conditions, driven by a
the end of December was           was 560.9 million kgMS,                                        was 342.0 million kgMS,
                                                                                                                                       La Niña weather pattern have
902.8 million kgMS, down          down 0.6% on last season.                                      down 1.0% on last season.
                                                                                                                                       assisted milk production
0.7% on last season.                                                                             At the end of November,               moving into summer.
                                  Weather was mixed in
                                                                                                 season‑to‑date collection
The poor pasture conditions       December, with areas                                                                                 Season-to-date collections are
                                                                                                 was 264.6 million kgMS, 1.1%
experienced in some areas         in the top half of the                                                                               down 2.2% on last year due
                                                                                                 behind last season.
in early November turned          Island starting with above                                                                           to an unseasonally wet spring
around with production at         average temperatures and                                       Snow fell in some regions             and lower herd numbers which
near normal levels by later       dry conditions, whereas                                        mid-month, followed by a              hampered milk volumes across
in the month. December            southern parts were much                                       cold and wet spell for eastern        peak months.
saw a wide range of weather       wetter than average.                                           parts. The upper South
conditions across the                                                                            Island also saw some heavy
country but indications of                                                                       rain, before more settled
good levels of                                                                                   conditions prevailed for most
supplementary feed                                                                               areas as the month ended.
production across most
parts of the country.

                                                                                                                                                                       5
OUR MARKETS
Fonterra Global Dairy Trade Results

Fonterra GDT results at
last trading event
19 January 2021:
                                        5.1%                                        USD
                                                                                              3,629                             28.6000’ MT
                                        Change in Fonterra’s                             Fonterra’s weighted                    Fonterra product quantity
                                        weighted average product                         average product price                  sold on GDT
                                        price from previous event                        (USD/MT)

                                   AMF                                             SMP                                         BUTTER

                                   17.3%
                                   USD 5,398/MT
                                                                                   7.3 %
                                                                                   USD 3,295/MT
                                                                                                                               4.6%
                                                                                                                               USD 4,735/MT

                                   WMP                                             CHEDDAR

                                   2.2%
                                   USD 3,380/MT
                                                                                   0.1%
                                                                                   USD 4,082/MT

Fonterra GDT sales                                                                 LATEST AUCTION                              FINANCIAL
by destination:                                                                                                                YEAR‑TO‑DATE

                                             NORTH ASIA (INCLUDING CHINA)

                                             SOUTH EAST ASIA

To view more information,                    MIDDLE EAST AND AFRICA                                28,553                                387,575
including a snapshot of the                                                                          MT                                      MT
                                             LATIN AMERICA
rolling year-to-date results –
                                             OTHER

     CLICK HERE

  The next trading event will be held on 2 February 2021. Visit www.globaldairytrade.info for more information.

Dairy commodity
                                                  1,150                                                                                                 0.76
prices and New
Zealand dollar trend
                                                  1,075                                                                                                 0.71
The New Zealand dollar
                                    PRICE INDEX

                                                                                                                                                               NZD / USD

appreciated during November
                                                  1,000                                                                                                 0.66
and December driven by
broad-based US dollar
weakness and supported by                          925                                                                                                  0.61
robust commodity prices. By
early January the NZD peaked
                                                   850                                                                                                  0.56
above 73 US cents before                             JAN 19   MAR 19   MAY 19   AUG 19    OCT 19    JAN 20   MAR 20   MAY 20    AUG 20   OCT 20   DEC 20
settling just below 72 US cents.                          GDT PRICE INDEX        NZD/USD SPOT RATE

                                                                                                                                                                       6
Our Performance

Darfield site adds new   Strong global demand for           “We have great flexibility          “I grew up rural in
shift to meet cream      our cream cheese has seen          here at the plant that              Whakatane and knew the
                         Fonterra’s Darfield site in        enables us to dial up or down       culture and lifestyle of the
cheese demand            Canterbury hire a full shift       the firmness and consistency        industry would work for us as
                         of new recruits as the team        of cream cheese to meet             we have a young family.
                         ramps up production.               customer preference and
                                                                                                “The opportunity came up
                                                            the great job our farmers
                         Cream Cheese Plant                                                     in the cream cheese plant
                                                            are doing in delivering top
                         Manager, Blake Aston says,                                             and having spoken to a few
                                                            quality milk,” Mr Blake said.
                         “We have employed five                                                 people I was really excited
                         new employees for the shift,       Mr Blake said that with             to join the team. It’s a
                         and they’ll work alongside         COVID-19 bringing                   small team but a modern
                         the three other shifts at          uncertainty to the job              plant and a cool product
                         the plant.                         market, it’s great to see that      that I’m looking forward to
                                                            Fonterra is able to offer new       working with.”
                         “The team is seeing
                                                            opportunities for people
                         record monthly sales for                                               Fonterra's Darfield site
                                                            looking for work. One of
                         cream cheese. Demand is                                                was established in 2012
                                                            those new employees is
                         predominately coming from                                              and employs more than
                                                            Liam Fitzgerald, who spent
                         China as we continue to see                                            280 people.
                                                            eight years working as an
                         increased interest in pasture-
                                                            international pilot at Air
                         fed milk from New Zealand.”
                                                            New Zealand until COVID-19
                         The cream cheese is going          hit the aviation industry.
                         into a range of different
                                                            “About 15 years ago I worked
                         products, from cheese
                                                            for Fonterra at Edgecumbe.
                         lollipops to traditional
                                                            Recently, when my flying
                         Chinese pastry like
                                                            career came to a halt
                         moon cakes.
                                                            unexpectedly, I spoke to my
                                                            wife about returning to the
                                                            dairy industry.

                         New employee, Liam Fitzgerald and Cream Cheese Plant Manager, Blake Aston

                                                                                                                              7
Our Co-op

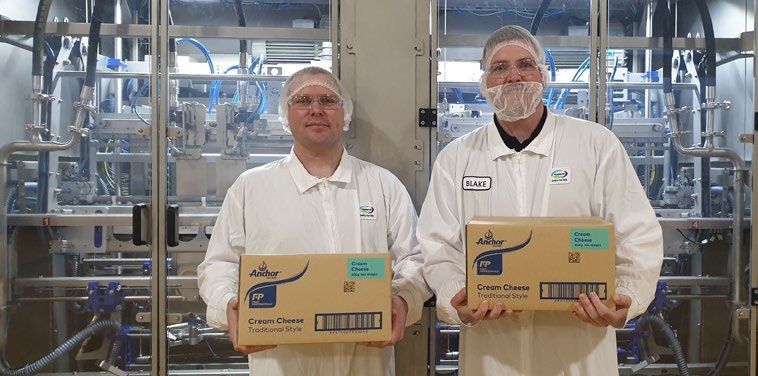
Promising plantain       Fonterra and Nestlé are          The new collaboration is          The project also focuses on
trial looking good for   teaming up with DairyNZ          helping to accelerate uptake      improving understanding of
                         to expand a promising            of Ecotain – a blend of           how farmers can implement
the planet               plantain trial to help improve   environmentally functional        Ecotain successfully and
                         waterways and reduce             plantain cultivars developed      engaging farmers through
                         on-farm greenhouse gas           by seed company Agricom.          workshops, events and a
                         (GHG) emissions.                 Currently, 50 Tararua farms       national farmer network to
                                                          have started to use plantain,     extend knowledge.
                         Incorporating certain
                                                          through DairyNZ’s Tararua
                         varieties of plantain into a                                       As the industry good
                                                          Plantain Project. With the
                         cow’s diet has been shown                                          body representing dairy
                                                          funding boost from Fonterra
                         to reduce the nitrogen                                             farmers, DairyNZ invests
                                                          and Nestlé, it’s expected
                         concentration in their urine,                                      significantly in sustainability
                                                          these farms and more will
                         which can leach through soil                                       research. DairyNZ’s General
                                                          increase the amount they
                         into groundwater. To test the                                      Manager for New Systems
                                                          grow, therefore maximising
                         benefits in local pastures,                                        and Competitiveness,
                                                          the benefits.
                         DairyNZ has been leading                                           David McCall, says the
                         the Tararua Plantain Project     Ecotain has been used in          dairy sector has a wide
                         in the lower North Island,       studies by DairyNZ, Agricom,      range of work underway
                         where farmers have been          Lincoln University, Massey        to reduce nitrates entering
                         growing the leafy herb for       University and AgResearch,        waterways and reduce
                         their cows. The Ministry for     with results showing it can       on‑farm emissions.
                         Primary Industries is also       significantly reduce nitrogen
                                                                                            “The seven-year Tararua
                         involved as a key contributor.   leaching. Preliminary studies
                                                                                            Plantain Project is a flagship
                                                          also show it has the potential
                         Now, Fonterra and Nestlé                                           project for the dairy sector.
                                                          to lower on-farm greenhouse
                         are helping expand the                                             It is delivering real, tangible
                                                          gas emissions through the
                         project further through                                            results valued by farmers.
                                                          reduction of nitrous oxide,
                         additional funding and by                                          The project has community
                                                          which is promising news
                         sharing expertise.                                                 at its heart as it seeks water
                                                          for farmers.
                                                                                            quality improvements,
                         “We’re all about finding
                                                          Nestlé, the world’s largest       while ensuring the dairy
                         ways to ensure Aotearoa
                                                          food company and a                sector continues as an
                         New Zealand has a thriving
                                                          customer of Fonterra’s, was       economic pillar within the
                         environment and a thriving
                                                          keen to be involved in the        local community.
                         farming economy,” says
                                                          Tararua project given the
                         Fonterra’s Director of                                             “It is excellent to have extra
                                                          commitments it has made
                         On-Farm Excellence                                                 support from Fonterra and
                                                          around sustainability.
                         Charlotte Rutherford.                                              Nestlé within the Tararua
                                                          “Working with our suppliers       catchment,” says Dr McCall.
                         “We can achieve more by
                                                          and others is critical for
                         partnering with others, so
                                                          achieving Nestlé’s target of
                         it’s great to join forces with                                     To view more information
                                                          net zero carbon emissions
                         DairyNZ and Nestlé. This                                           about the Tararua
                                                          by 2050. Reducing on-farm
                         is helping to speed up the                                         Plantain Project –
                                                          greenhouse gas emissions
                         adoption of plantain by
                                                          and protecting waterways
                         farmers. Ultimately it could
                                                          will help us get there and
                         be a real game-changer to
                                                          we’re pleased to partner with
                                                                                                 CLICK HERE
                         reduce nitrogen from cows
                                                          Fonterra and DairyNZ on
                         and help mitigate nitrous
                                                          this initiative,” says Nestlé’s
                         oxide emissions.”
                                                          Robert Erhard.

                                                                                                                              8
Supplementary Information

Global Dairy Market              PRODUCTION
The charts on the right                                   1,000
illustrate the year-on-year
changes in imports, exports                                800
and production for a range of
                                 LIQUID MILK (M LITRES)

countries that are important                               600
players in global dairy trade.
                                                           400
The absolute size of
the bars represents the                                    200
change in imports, exports
or production, relative                                      0
to the same period the
previous year.                                            -200
                                                                  JAN 20 FEB 20 MAR 20 APR 20 MAY 20             JUN 20   JUL 20 AUG 20 SEP 20 OCT 20 NOV 20 DEC 20
Averages are shown where
                                                                     NEW ZEALAND               EU/UK            UNITED STATES          AUSTRALIA                AVERAGE
data is complete for the
regions presented.               NOTE: Data for EU/UK and Australia to November; New Zealand and US to December.

 BACK TO SUMMARY                 EXPORTS
                                                           200

                                                           160

                                                           120
                                 MT (000s)

                                                            80

                                                            40

                                                             0

                                                           -40

                                                            -80
                                                                  DEC 19    JAN 20   FEB 20   MAR 20   APR 20    MAY 20   JUN 20   JUL 20    AUG 20   SEP 20   OCT 20   NOV 20

                                                                     NEW ZEALAND               EU/UK            UNITED STATES          AUSTRALIA                AVERAGE
 BACK TO SUMMARY                 NOTE: Data for EU/UK to October; New Zealand, Australia and US to November.

                                 IMPORTS
                                                            180

                                                            120

                                                            60
                                 MT (000s)

                                                             0

                                                            -60

                                                           -120

                                                           -180
                                                                  DEC 19    JAN 20 FEB 20 MAR 20 APR 20 MAY 20            JUN 20   JUL 20 AUG 20 SEP 20 OCT 20 NOV 20

                                                                     ASIA               CHINA            MIDDLE EAST & AFRICA               LATIN AMERICA               AVERAGE

                                 NOTE: Data for Asia, Middle East & Africa and Latin America to October; China to November.
 BACK TO SUMMARY
                                 SOURCE: Government milk production statistics/GTIS trade data/Fonterra analysis.

                                                                                                                                                                                  9
Supplementary Information

Fonterra milk                   MILK COLLECTION                                        DECEMBER DECEMBER MONTHLY                 SEASON-       SEASON-    SEASON-
                                (MILLION KGMS)                                             2020      2019 CHANGE                 TO-DATE       TO-DATE    TO-DATE
production                                                                                                                        2020/21       2019/20   CHANGE
The table on the right
                                Total Fonterra                                               183.1        184.3      (0.7%)           902.8       909.7     (0.7%)
shows Fonterra milk solids
                                New Zealand
collected in New Zealand
and Australia compared          North Island                                                105.8        106.4       (0.6%)           560.9       564.3    (0.6%)
to the previous season.
                                South Island                                                  77.3         77.9      (0.7%)           342.0       345.4     (1.0%)
 BACK TO SUMMARY                Australia                                                     11.4         11.3        1.3%            59.0        60.3     (2.2%)

Fonterra GDT results                                                                                        LAST TRADING EVENT                        YEAR-TO-DATE
                                                                                                               (19 JANUARY 2021)              (FROM 1 AUGUST 2020)
This table provides more
information on the latest       Quantity Sold on GDT                                                                       28,553                          387,575
results, including a snapshot   (Winning MT)
of the year-to-date results.
                                Change in Quantity Sold on GDT                                                            (10.3%)                           (8.9%)
                                over same period last year
                                Weighted Average Product Price                                                                3,629                          3,201
                                (USD/MT)
                                Change in Weighted Average                                                                    4.7%                          (5.3%)
                                Product Price over same period
                                last year
                                Change in Weighted Average                                                                     5.1%                                   –
                                Product Price from previous event

Fonterra GDT results                                              3,700                                                                                   39,000
                                WEIGHTED AVERAGE PRICE (USD/MT)

This chart shows Fonterra
GDT prices and volumes over                                       3,500                                                                                   34,000
                                                                                                                                                                   QUANTITY SOLD ( MT)

the past 12 months.
                                                                  3,300                                                                                   29,000

                                                                  3,100                                                                                   24,000

 BACK TO SUMMARY                                                  2,900                                                                                   19,000

                                                                  2,700                                                                                   14,000
                                                                      FEB 20 MAR 20 APR 20 MAY 20 JUN 20 JUL 20 AUG 20 SEP 20 OCT 20 NOV 20 DEC 19 JAN 21
                                                                            WEIGHTED AVERAGE PRICE     QUANTITY SOLD

                                                                                                                                                                          10
Glossary

AMF                              kgMS                           Season
Anhydrous Milk Fat.              Kilogram of milk solids, the   New Zealand: A period
                                 measure of the amount of       of 12 months to 31 May
BMP                              fat and protein in the milk    in each year.
Butter Milk Powder.              supplied to Fonterra.
                                                                Australia: A period of
DIRA                             MENA                           12 months to 30 June
                                                                in each year.
Dairy Industry Restructuring     Middle East – North Africa.
Act 2001 (New Zealand).
                                 MPC                            SMP
Farmgate Milk Price                                             Skim Milk Powder.
                                 Milk Protein Concentrate.
The price for milk supplied in                                  WMP
New Zealand to Fonterra by       Non-Reference Products
                                                                Whole Milk Powder.
farmer shareholders.             All dairy products, except
                                 for Reference Products,        WPC
Fluid Products                   produced by the NZ
                                                                Whey Protein Concentrate
The Fonterra grouping            Ingredients business.
of fluid milk products
(skim milk, whole milk           NZMP
and cream – pasteurised          New Zealand Milk Products.
or UHT processed),
concentrated milk products       Reference Products
(evaporated milk and             The dairy products used
sweetened condensed milk)        in the calculation of the
and yoghurt.                     Farmgate Milk Price, which
                                 are currently WMP, SMP,
GDT                              BMP, butter and AMF.
Global Dairy Trade, the
online provider of the twice
monthly global auctions of
dairy ingredients.

                                                                                           11
You can also read