K-12 Learning Progression: Data and Plan - Radnor Township School District Board Curriculum Committee March 16, 2021 - BoardDocs
←
→
Page content transcription
If your browser does not render page correctly, please read the page content below
K-12 Learning Progression: Data and Plan
        Radnor Township School District
         Board Curriculum Committee
                March 16, 2021
2
Data Review
K-5
Plan to address achievement/growth deficit areas
Supports, Services, and Summary Programming
Mr. Shawn Dutkiewicz, Director of Elementary Teaching and Learning
Dr. Tronya Boylan, Principal of Ithan Elementary
Ms. Nancy Ferguson, Principal of Wayne Elementary
Data Review
6-8
Plan to address achievement/growth deficit areas
Supports, Services, and Summary Programming
Meeting
Mr. Dan Bechtold, Director of Secondary Teaching and Learning
Dr. Dave Wiedlich, Principal of Radnor Middle School
Agenda Data Review
9-12
Plan to address achievement/growth deficit areas
Supports, Services, and Summary Programming
Social-Emotional Supports and Services (K-12)
Mr. Dan Bechtold, Director of Secondary Teaching and Learning
Ms. PT Kevgas, Principal of Radnor High School
Ms. Jenny LeSage, Director of Special Education
3
RTSD K-5 Learning Progression: Data and Plan
Mr. Shawn Dutkiewicz, Dr. Tronya Boylan, Ms. Nancy Ferguson
                                                              4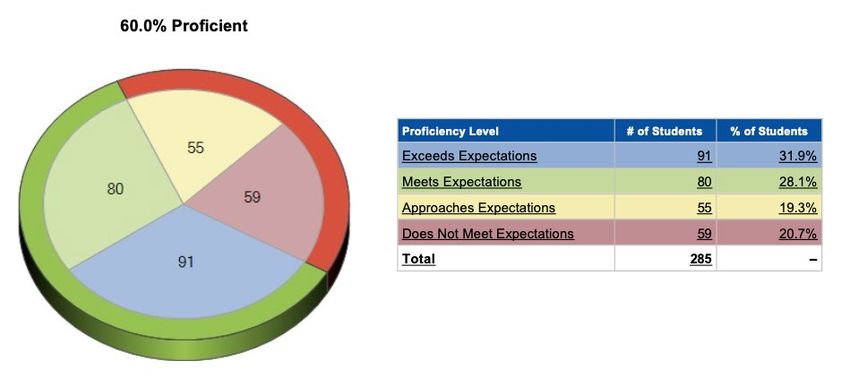
RTSD K-5 Learning Progression: Data and Plan
What does the data tell us?
What are we going to do with the data?
K-5 Full In-person Transition: Analyze and develop themes
March 1st 2021 Drill down and personalize
Develop plans to meet the needs of all students
The transition resulted in
the potential for 71 full-time The final trimester of 2020-2021
synchronous in-person student Student plans will be implemented
days until the end of the Formative Assessments will continue
school year
Summer 2021: Expanded programming and access
This represents nearly 40%
of the total school year ESY, ELD, Literacy, STEAM, Enrichment, Math Tutoring
5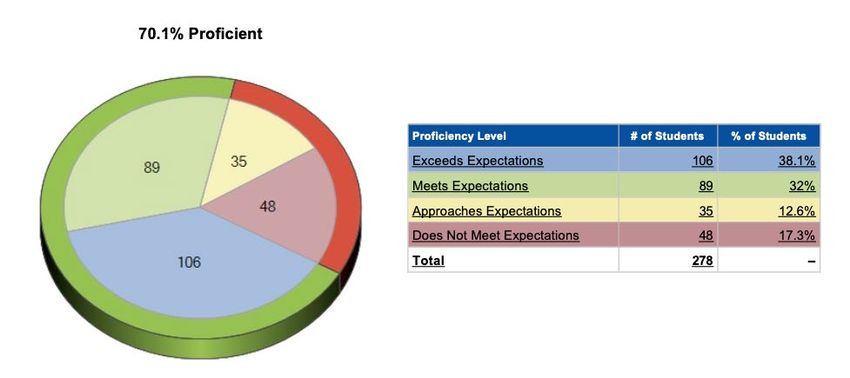
Context for RTSD Data
Our students' changing experiences over the past year directly contribute to the assessment results.
Each assessment provides one data point. We need to consider multiple data points to get a more
complete picture of each child’s performance level.
Hybrid and cyber students take assessments under different testing conditions.
Due to their scale re-alignment that NWEA conducted last year, the company advises against comparing
MAP Growth K–2 test scores from before July 2020, with scores after that date.
The following facts regarding the Literably reading assessment data should be noted:
Literably is a new assessment tool for RTSD that is being piloted this year.
Fall 2020 is a baseline: Kindergarten cannot be rated as “Does Not Meet.”
Expectation levels increase from fall to winter and from winter to spring, so they are not the same for each
administration.
6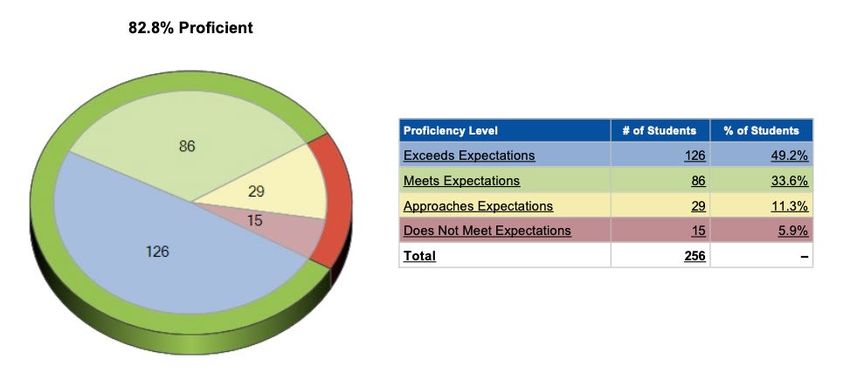
NWEA Measure of Academic Progress (MAP)

                                  When students finish their MAP Growth test, they receive a number called a RIT
                                  score for each area in which they were tested. The RIT (Rasch Unit) scale is used
                                  to help measure and compare academic growth. Specifically, the scale measures
                                  levels in academic difficulty.

                                  The RIT scale extends equally across all grades, making it possible to compare a
                                  student's score at various points throughout his or her education. For example, if
                                  a fourth-grade student and an eighth-grade student have the same RIT score in
                                  reading, then they are testing at the same level in that subject.
   Radnor Township School
District students in grades 1-8   Teachers can use MAP test results to monitor their students’ learning and plan
take the NWEA MAP Growth          their instruction. Data teams in each school also use the MAP test results as a
test in Reading and Math 2-3      source of information about student performance. MAP test scores do not
   times each school year.        affect student’s class grades.

                                                                                                              7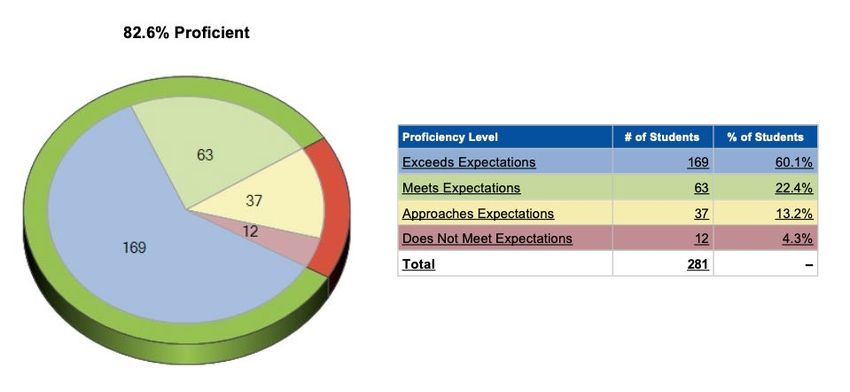
NWEA Measure of Academic Progress (MAP)
What are the characteristics of the RIT scales?
These RIT scales are stable, equal interval scales that use individual item difficulty values to
measure student achievement independent of grade level (that is, across grades). "Equal
interval" means that the difference between scores is the same regardless of whether a student
is at the top, bottom, or middle of the RIT scale. "Stable" means that the scores on the same
scale from different students, or from the same students at different times, can be directly
compared, even though different sets of test items are administered. A RIT score also has the
same meaning regardless of the grade or age of the student.
In summary, the RIT scale is:
Radnor Township School An achievement scale
District students in grades 1-8 Accurate
take the NWEA MAP Growth Equal interval
test in Reading and Math 2-3 Useful for measuring growth over time
times each school year. The same regardless of the grade or age of the student
Source: https://nwea.force.com/nweaconnection/s/article/What-is-the-RIT-scale?language=en_US
8
NWEA Measure of Academic Progress (MAP)

                                  Is there a max RIT score a student can earn on their test?

                                  There is no maximum or "perfect" score on a MAP Growth test. A student's score on any
                                  MAP Growth test is a function of both the proportion of questions answered correctly and
                                  the difficulty of the questions asked. The valid range for scores is between 100 and 350, but
                                  that does not mean that student scores "go to 350" or that a student may ever even receive
                                  the highest RIT item available on a test. The assessment adapts between RIT difficulties to
                                  generate a valid inferenced score.

                                  We recommend using RIT norm data in conjunction with the MAP reports and to think in
                                  terms of the skills found in the higher RIT ranges. For example, if it were your goal to help a
   Radnor Township School         student in 8th grade reach the top 95-99 percentile for their grade during winter testing in
District students in grades 1-8   math, you would see that a student in 8th grade who is scoring a 260-273 is in the upper 5%
take the NWEA MAP Growth          of the achievement percentiles. Although these are by no means the maximum scores
test in Reading and Math 2-3      possible, it does give you an idea of the upper levels of RIT scores.
   times each school year.
                                  Source: https://nwea.force.com/nweaconnection/s/article/Is-there-a-max-RIT-score-a-student-can-get?language=en_US

                                                                                                                                                 9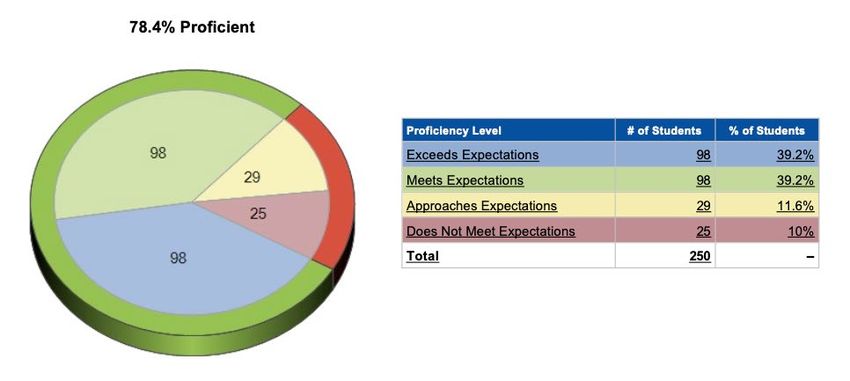
NWEA MAP Reading MEAN RIT Scores: 3 Year Comparison
                                                                           Winter to Winter Administration

                                                                                         Mean RIT
       Grade Level           2018-19 SY   2019-2020 SY   2020-21 SY   Cyber Cohort
                                                                                          Norm

1st grade NWEA Reading Avg     180.3         182.8         177.1         184.1              165.9

2nd grade NWEA Reading Avg     196.4         196.7         195.6         202.6              181.2

3rd grade NWEA Reading Avg     207.6         206.5         205.4         213.3              193.9

4th grade NWEA Reading Avg     214.9         214.7         214.4         217.2              202.5

5th grade NWEA Reading Avg     220.5          222          219.5         220.7              209.1

                                                                                                10
NWEA MAP Reading MEAN RIT Scores: 3 Year Comparison
MAP Reading Comparison
250
200
150
100
50
0
1st Grade 2nd Grade 3rd Grade 4th Grade 5th Grade
MEAN NORM 2018-2019 2019-2020 2020-2021 Cyber Cohort
112020-2021 K-5 MAP Reading Data
Reading MAP Assessment
% of students who scored in the average, high-average, and high ranges
Year 2019-2020 SY 2020-2021 SY
1st Grade 93% 89%
2nd Grade 90% 88%
3rd Grade 90% 86%
4th Grade 90% 88%
5th Grade 93% 88%
12NWEA MAP Math MEAN RIT Scores: 3 Year Comparison
Winter to Winter Administration
Mean RIT
Grade Level 2018-19 SY 2019-2020 SY 2020-21 SY Cyber Cohort
Norm
1st grade NWEA Math Avg 181.7 184.8 179.8 188.6 170.2
2nd grade NWEA Math Avg 204.4 205 192.8 198.8 184.1
3rd grade NWEA Math Avg 206.9 206.4 202.8 208.3 196.2
4th grade NWEA Math Avg 218.9 218.2 215.9 218.8 206.1
5th grade NWEA Math Avg 229.3 231.7 226.2 227.1 214.7
13NWEA MAP Math MEAN RIT Scores: 3 Year Comparison
MAP Math Comparison
250
200
150
100
50
0
1st Grade 2nd Grade 3rd Grade 4th Grade 5th Grade
MEAN NORM 2018-2019 2019-2020 2020-2021 Cyber Cohort
142020-2021 K-5 MAP Math Data
Math MAP Assessment
% of students who scored in the average, high-average, and high ranges
Year 2019-2020 SY 2020-2021 SY
1st Grade 93% 88%
2nd Grade 92% 88%
3rd Grade 90% 85%
4th Grade 91% 92%
5th Grade 92% 90%
15Literably Assessment
Literably is an online reading assessment that our students will take using a
Chromebook or iPad. Literably records students reading stories aloud and then asks
them comprehension questions. Literably employees listen to the recordings,
generate a transcript of each student's reading (that is sent back to teachers to
review), and calculates scores for accuracy, rate, and comprehension.
In previous years, Radnor Township has administered the Fountas and Pinnell (F&P)
Benchmark Assessment as a consistent measure of students’ reading levels. However,
we cannot administer the F&P assessment to students remotely. After investigating
Radnor Township School Literably with the Elementary Literacy Team, RTSD decided to pilot the program this
District (RTSD) is piloting the year and evaluate how well it helps the district meet our students’ needs.
program Literably during the
2020-2021 school year to Teachers have administered the Literably Assessment to elementary students in the
assess our Kindergarten fall and winter. Students will complete a final Literably assessment in the spring of
through grade 5 students' this year. Overall, Literably provides RTSD with a consistent benchmark of progress for
reading levels and growth. all students, whether in-person or remote.
16Literably Assessment
Grades and Levels All Students Cyber Program Cohorts
Estimated Instructional Level Kindergarten FALL 2020 MIDYEAR 2021 FALL 2020 MIDYEAR 2021
Does Not Meet Expectations -- 0% -- 0%
Approaches Expectations -- 23% -- 18%
Meets Expectations 72% 31% 60% 22%
Exceeds Expectations 28% 46% 40% 60%
Estimated Instructional Level 1st Grade FALL 2020 MIDYEAR 2021 FALL 2020 MIDYEAR 2021
Does Not Meet Expectations 21% 17% 11% 11%
Approaches Expectations 19% 13% 17% 10%
Meets Expectations 28% 31% 32% 32%
Exceeds Expectations 32% 39% 40% 47%
17Fall
Administration
Data Analysis
Summary:
Literably from
Fall to Winter
1st Grade
Winter
Administration
18Literably Assessment
Grades and Levels All Students Cyber Program Cohorts
Estimated Instructional Level 2nd Grade FALL 2020 MIDYEAR 2021 FALL 2020 MIDYEAR 2021
Does Not Meet Expectations 10% 6% 2% 1%
Approaches Expectations 11% 11% 7% 3%
Meets Expectations 39% 34% 48% 36%
Exceeds Expectations 39% 49% 43% 60%
Estimated Instructional Level 3rd Grade FALL 2020 MIDYEAR 2021 FALL 2020 MIDYEAR 2021
Does Not Meet Expectations 1% 3% 0% 0%
Approaches Expectations 23% 15% 20% 14%
Meets Expectations 40% 30% 34% 13%
Exceeds Expectations 36% 52% 46% 73%
19Fall
Administration
Data Analysis
Summary:
Literably from
Fall to Winter
2nd Grade
Winter
Administration
20Fall
Administration
Data Analysis
Summary:
Literably from
Fall to Winter
3rd Grade
Winter
Administration
21Literably Assessment
Grades and Levels All Students Cyber Program Cohorts
Estimated Instructional Level 4th Grade FALL 2020 MIDYEAR 2021 FALL 2020 MIDYEAR 2021
Does Not Meet Expectations 6% 5% 3% 3%
Approaches Expectations 18% 15% 17% 12%
Meets Expectations 34% 26% 40% 20%
Exceeds Expectations 42% 54% 40% 65%
Estimated Instructional Level 5th Grade FALL 2020 MIDYEAR 2021 FALL 2020 MIDYEAR 2021
Does Not Meet Expectations 3% 4% 0% 1%
Approaches Expectations 17% 13% 18% 12%
Meets Expectations 30% 23% 23% 15%
Exceeds Expectations 50% 60% 59% 72%
22Fall
Administration
Data Analysis
Summary:
Literably from
Fall to Winter
4th Grade
Winter
Administration
23Fall
Administration
Data Analysis
Summary:
Literably from
Fall to Winter
5th Grade
Winter
Administration
24Data Analysis Summary: Reading
Literably Assessment – Fall to Mid-Year Growth Comparison
All Students Cyber Cohort
Fall Mid-Year Growth Fall Mid-Year Growth
% of students who % of students who % of students who % of students who
met or exceeded met or exceeded % Growth met or exceeded met or exceeded % Growth
expectations expectations expectations expectations
Kinder Baseline 77% -- Baseline 82% --
1st 60% 70% +10% 72% 79% +7%
2nd 78% 83% +5% 91% 96% +5%
3rd 76% 82% +6% 80% 86% +6%
4th 76% 80% +4% 80% 85% +5%
5th 80% 83% +3% 82% 87% +5%
25Data Analysis Summary: Reading
What does the data tell us?
MAP Assessment Data:
Overall, student achievement and growth on the MAP Reading Assessment is comparable with
previous school years (mean average)
Student cohorts have demonstrated growth from year to year
1st grade data is slightly below
Cyber data is slightly above
Literably data:
All grades demonstrated growth from the fall to winter
Cyber data is slightly above district averages in each grade level
Pacing:
Based on our district scope-and-sequence and past practices within English-Language Arts, our
Elementary Vertical Team (K-5) is reporting that some sections may be 1-2 weeks behind, but the vast
majority are on pace with typical school year pacing.
26Data Analysis Summary: Math
What does the data tell us?
MAP Assessment Data:
Overall, student achievement and growth on the MAP Math Assessment is lower
than previous school years
Cyber data is closer to previous year averages (lower in 2nd and 5th; on par in 3rd
grade, and higher in 1st and 2nd grades)
In most cases, student cohorts demonstrated growth from year to year
NWEA MAP Research aligns with RTSD current findings
Pacing:
Based on our district scope-and-sequence and past practices within Mathematics,
our Elementary Vertical Team is reporting that although some grades/sections are on
pace, the majority of grades and sections are behind a typical school year by
approximately 1-3 weeks.
27Data Analysis: NWEA Research
In fall 2020, NWEA researched 4.4 million students’ MAP reading and math achievement and growth scores.
Like RTSD, students showed growth but performed better in reading than math. Here are NWEA’s key
findings:
In fall of 2020, students in grades 3–8 performed similarly in reading to same-grade students in fall
2019, but about 5 to 10 percentile points lower in math.
In almost all grades, most students made some learning gains in both reading and math since the
COVID-19 pandemic started. However, gains in math were lower on average in fall 2020 than prior
years, resulting in more students falling behind relative to their prior standing.
This fall, students scored better than NWEA’s projections in reading, while math scores were in line
with our projections for grades 4–6 and slightly above our projections in grades 7–8.
Source: https://www.nwea.org/content/uploads/2020/11/Collaborative-brief-Learning-during-COVID-19.NOV2020.pdf
28Elementary Support Systems
Each building has an MTSS Team that works to identify and address student academic and
social-emotional challenges
Each school has a full-time dedicated counselor focused on social-emotional health and
responsive classroom practices
Each school has a full-time dedicated MTSS Facilitator and Instructional Coach focused on
supporting academic needs and instructional interventions in the classroom setting
Each school has a full-time Reading Specialist to support students who are achieving below
grade level expectations
All students have Wellness Teachers as one of their five special-area classrooms; there is a
focus on student well-being and healthy habits of mind and body
29Elementary Support Systems
All schedules have a defined Intervention and Enrichment block (both in-person
and cyber) for students access special services and support
Fall 2020: School wide SEL assembly (Dr. Troy Brindle)
RTSD Social Worker check-ins with parents
Caron Foundation support
Lakeside Counseling support
Investigating the use of ESSER funds to support longer-term professional
development and training for teachers and staff
303rd Trimester Plan
School Data Teams will analyze all relevant data (MAP, Literably, and curriculum
assessments) to address individual learning and progress in accordance with
existing/emerging achievement gaps.
School, grade level, and student remediation plans will be designed
More specifics – Dr. Tronya Boylan
K-5 Full In-person
Transition: March 1st 2021 Instructional Practices:
Full in-person instruction: 72 school days
The transition resulted in Cyber program continues; data comparison is “complex”
the potential for 71 full-time Supports and services are available for in-person and cyber students
synchronous in-person student
The MAP Assessment and Literably Assessment will be administered again in April-June
days until the end of the
school year Summer Programming Opportunities
Investigation of online tools for optional summer practice
This represents nearly 40%
A Board update regarding achievement will be planned for Fall 2021
of the total school year
31K-12 Summer Programming
Cost to
Summer Programs Format(s) / Location(s) Access Criteria
Parents
In-person Special Education IEP Plans +
Extended School Year (ESY) No cost
WES Extended ESY
English Language In-person / Remote
ELD Levels / WIDA Assessment No cost
Development (ELD) WES
K-3 Literacy In-person / Remote Reading Progress
No cost
Consider 4-5 (based on needs) WES (Literably and curriculum assessments)
Remote Cyber /
Math Remediation Tutoring Math Progress No cost
Small Group Synchronous
Remote Cyber
Enrichment Camps All Access No cost
Asynch / Synch
STEAM In-person / RMS All Access $ TBD
32Questions: K-5 Data and Plan
33RTSD 6-12 Learning Progression: Data and Plan
Mr. Dan Bechtold, Dr. Dave Wieldlich, Ms. PT Kevgas
34RTSD 6-12 Learning Progression: Data and Plan
Radnor Middle School (RMS) Achievement Data
Current RMS Support System
Radnor High School (RHS) Achievement Data
Current RHS Support System
Social/Emotional Data
Social/Emotional Supports
Summer Programming
Next Steps
35Radnor Middle School – Dr. Dave Wieldlich
36RMS Algebra I Keystone Exams
Spring of 2019 Fall of 2020
100% Proficient or Advanced 100% Proficient or Advanced
85 Rostered students assessed 41 Rostered students assessed
37RMS Science Classroom Diagnostic Tool (CDTs)
8th Grade Assessment
Year Advanced Proficient Basic Below Basic
2019-2020 9.5% 58.7% 31.4% 0.4%
2020-2021 11.6% 66.5% 21.9% 0%
38NWEA MAP Math MEAN RIT Scores: 3 Year Comparison
Mean RIT
Grade Level 2018-19 SY 2019-2020 SY 2020-21 SY
Norm
6th grade NWEA Math Avg 232.5 233.1 232.3 219.6
7th grade NWEA Math Avg 241.4 240.8 238.7 224
8th grade NWEA Math Avg 250.7 248.4 246.5 228.1
39NWEA MAP Math MEAN RIT Scores: 3 Year Comparison
MAP Math Comparison
250
200
150
100
50
0
6th Grade 7th Grade 8th Grade
MEAN NORM 2018-2019 2019-2020 2020-2021
402020-2021 RMS MAP Data
Math MAP Assessment
% of students who scored in the average, high-average, and high ranges
Year 2019-2020 SY 2020-2021 SY
6th Grade 91% 89%
7th Grade 91% 89%
8th Grade 81%* 90%
* 62 students
41NWEA MAP Reading MEAN RIT Scores: 3 Year Comparison
Mean RIT
Grade Level 2018-19 SY 2019-2020 SY 2020-21 SY
Norm
6th grade NWEA Reading Avg 222.9 224.3 225.1 213.8
7th grade NWEA Reading Avg 228.2 229 228.6 217.1
8th grade NWEA Reading Avg 233.3 230 231.5 220.5
42NWEA MAP Reading MEAN RIT Scores: 3 Year Comparison
MAP Reading Comparison
250
200
150
100
50
0
6th Grade 7th Grade 8th Grade
MEAN NORM 2018-2019 2019-2020 2020-2021
432020-2021 RMS MAP Data
Reading MAP Assessment
% of students who scored in the average, high-average, and high ranges
Year 2019-2020 SY 2020-2021 SY
6th Grade 88% 91%
7th Grade 91% 89%
8th Grade 73%* 87%
* 63 students
44RMS Marking Period Failures
Quarter Year Total F’s Issued Students
2019-2020 30 25 (2.9%)
MP 1
2020-2021 61 40 (4.8%)
2019-2020 32 26 (3%)
MP 2
2020-2021 75 45 (5.4%)
45RMS Marking Period Failures by Grade
1st 2nd
Year Students Year Students
Quarter Quarter
2019-2020 4 2019-2020 6
6th 6th
2020-2021 6 2020-2021 8
2019-2020 3 2019-2020 10
7th 7th
2020-2021 14 2020-2021 16
2019-2020 18 2019-2020 10
8th 8th
2020-2021 20 2020-2021 21
46Example RMS Struggling Student
Academic Social/Emotional
Teacher reaches out to parent to discuss concerns Employee or parent submits a Student Assistant
Program (SAP) Referral
Teacher communicates with counselor, teammates and School Counselor communication with parent about
counterparts to gather data concerns
The School Counselor communicates with the student; SAP team discusses supports
the classroom teacher puts academic interventions in
place
The Counselor communicates with administration Counselor check-ins with the student are established
regarding rostering the student for MTSS courses
(rolling admission)
The MTSS teacher, core teacher and school counselor Counseling through Lakeside and/or Caron Foundation
communicate about student progress initiated
47RMS Support Systems
Multi-Tiered System of Support (MTSS) and Data Team
Meetings
Students rostered for MTSS courses
Remediation and enrichment built into daily schedule
Increased communication with parents/guardians
School Counselor meetings with struggling students
48RMS Support Systems
Relaxed due dates and extensions provided
Team/Counselor/Administration meetings with
parents/guardians
Parent/Guardian access to Home Access Center
Professional reflection on grading/assessment practices
After school tutoring program established
49RMS Support Systems
Daily personalized attendance calls for unaccounted
class/school day absences
School Attendance Improvement Plans (SAIPs) initiated for
students with attendance challenges
Drop-in elective area centers established
Teacher office hours on asynchronous days
50RMS Support Systems
Student and parent/guardian focus groups
Emphasis on student self-care and social-emotional well-being
School wide SEL assembly (Troy Brindle)
RTSD Social Worker check-ins with parents
Caron Foundation support
Lakeside Counseling support
51Radnor High School – Ms. PT Kevgas
52RHS Algebra I Keystone Exams
Spring of 2019 Fall of 2020
81.3% Proficient or Advanced 96.1% Proficient or Advanced
262 Rostered students assessed 51 Rostered students assessed
53RHS Biology Keystone Exams
Spring of 2019 Fall of 2020
89.5% Proficient or Advanced 70.4% Proficient or Advanced
294 Rostered students assessed 226 Rostered students assessed
54RHS Marking Period Failures
Quarter Year Total F’s Issued Students
2019-2020 43 31 (2.5%)
MP 1
2020-2021 136 94 (7.8%)
2019-2020 117 66 (5.5%)
MP 2
2020-2021 162 109 (9.1%)
55RHS Marking Period Failures by Grade
1st 2nd
Year Students Year Students
Quarter Quarter
2019-2020 9 2019-2020 16
9th 9th
2020-2021 32 2020-2021 31
2019-2020 3 2019-2020 11
10th 10th
2020-2021 28 2020-2021 30
2019-2020 7 2019-2020 20
11th 11th
2020-2021 15 2020-2021 15
2019-2020 12 2019-2020 19
12th 12th
2020-2021 19 2020-2021 33
56Example RHS Struggling Student
Student is identified by…
Eligibility checker or attendance Employee or parent who submits
Teacher who reaches out to parent
screener used to catch struggling Student Assistant Program (SAP)
to discuss concerns
students referral
School Counselor or administrator reaches out to parent
SAP team discussion of student data and potential supports
Academic Social/Emotional
Math and Writing Centers
Check-ins with School Counselors
Extended Learning Program
Lakeside Mental Health Counseling
ASC and Essentials Classes
Caron Foundation Counseling
Student Attendance Improvement Plan (SAIP)
57RHS Support Systems
Troy Brindle student presentation on stress and anxiety to
grades 9-11
Senior Seminar Speaker Series
COVID-19 Student Group
Parent webinar on strategies to support children suffering
from stress and anxiety
58RHS Support Systems
Teacher webinar on coping skills and stress/anxiety
management
Lakeside mental health counseling for students
Virtual Math and Writing Centers
Free after school tutoring for all students
Special Education teacher added to after school tutoring
program
59RHS Support Systems
Extension of Incomplete “I” deadline for marking period
grades
Asynchronous days with dedicated drop-in teacher office
hours
Elimination of mid-terms and final exams
Weekly Home Access Center (HAC) updates pushed out to all
parents
60RHS Support Systems
Bi-weekly email reminders to parents to check HAC for updated
student grades
Mid-quarter progress reports and first semester report cards mailed
home
Letter sent home to parents/guardians if a student is failing one or
more course
Teacher communication to parents if a student’s grade drops below
60% for the quarter
61RHS Support Systems
Peer Mentorship Program
Academic Success Center
Academic Success Center with Executive Functioning Strategies
Essentials Classes
Student Intervention Meetings
Student Assistance Program Meetings
62RHS Support Systems
Teaching and Learning
Hubs
Ongoing Professional
Development
63n
K-12 Social / Emotional Supports
Ms. Jenny LeSage 64Levels of Support
Student Assistance Program
• Team meeting
• School Counselor
• Lakeside/Caron
504
• 504 Coordinator
• Accommodations/Modifications
IEP
• IEP team meetings
• Direct Instruction (strategies)
65Social/Emotional District Data
Student Assistance Program - Number of Referrals
SAP Fall Semester SAP Fall Semester Lakeside/Caron Lakeside/Caron
Building
2019-2020 2020-2021 2019-2020 2020-2021
WAYNE ELEMENTARY
6 10 9 7
ITHAN ELEMENTARY 7 6
6 17
23 - Group 6 - Group
RADNOR ELEMENTARY 3
7 5 6
14 - Group
RADNOR MIDDLE SCHOOL
36 45 24 20
RADNOR HIGH SCHOOL
59 87 44 43
66Crisis Team Approach
Comprehensive School Threat
Crisis Assessment Assessment Guideline (CSTAG)
Team based assessment Team based assessment
process when a process when student is
student presents with self- a threat to harm self/
harming behavior others/or school
environment
67Social/Emotional District Data
Crisis Crisis
CSTAG CSTAG
Building Risk Assessment Risk Assessment
2019-2020 2020-2021
2019-2020 2020-2021
WAYNE ELEMENTARY 0 0 1 0
ITHAN ELEMENTARY 3 1 0 0
RADNOR ELEMENTARY 1 1 0 0
RADNOR MIDDLE SCHOOL 6 2 0 0
RADNOR HIGH SCHOOL 6 7 0 1
68Supports for Students
Multiple meetings
Mental Health Counseling
Virtual tutoring
Virtual Counseling
Class schedule changes/additions
Other placement options
Transition Plans
Check ins with case managers/school
counselor
69Next Steps
Students in school full-day; 5 days per week
RMS and RHS will maintain current supports
Additional Lakeside Counselors
Therapy dogs for RMS and RHS
Mindfulness workshops for students
Districtwide School Counseling Coordinator to oversee student academic
and SEL supports
Free summer enrichment and skills-based programming
70Next Steps - Assessments
MAP Assessment: Spring
Administration (1-8 grades)
PSSA (3rd – 8th, 11th grade):
Math, English-Language Arts, Science
Keystone Exams (Secondary)
71Counseling Services Coordinator
Oversee Academic and Social Emotional Learning Supports for
students impacted by COVID-19
Academic support liaison
Parents and student workshops
Coordination of wellness services/supports
Mirrors existing position in other local districts
Funding via ESSER grant
72Questions: 6-12 Data and Plan
73You can also read