RESULTS Q2 2021 ANALYST CONFERENCE CALL CEWE STIFTUNG & CO. KGAA AUGUST 10, 2021 - CEWE IR
←
→
Page content transcription
If your browser does not render page correctly, please read the page content below
Results Q2 2021
Analyst Conference Call

CEWE Stiftung & Co. KGaA

August 10, 2021

This presentation contains forward-looking statements that are based on current assumptions and
    forecasts of the management of CEWE. Known and unknown risks, uncertainties and other factors
    could lead to material differences between the forward-looking statements given here and the actual
    development, in particular the results, financial situation and performance of our Company. The
    Company assumes no liability to update these forward-looking statements or to conform them to future
    events or developments.

    All numbers are calculated as exactly as possible and rounded for the presentation. Due to this,
    rounding differences might occur.

2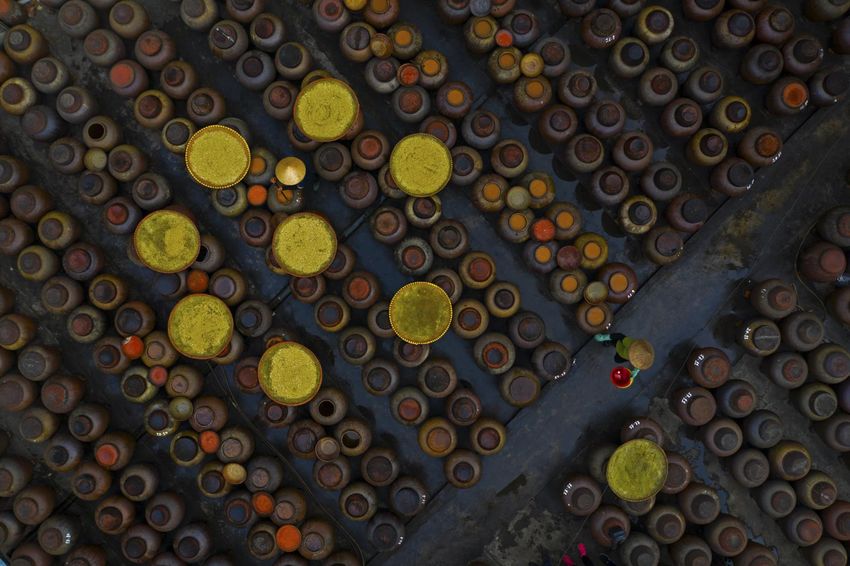
Dr. Olaf Holzkämper   Dr. Christian Friege
    CFO                   CEO

3
Agenda
    1. Corporate Development by Business Segments

      1.1 Photofinishing
      1.2 Retail
      1.3 Commercial Online-Print
      1.4 Other

    2. Group Results

    3. Financial Details

    4. Outlook

    5. Q&A-Session

4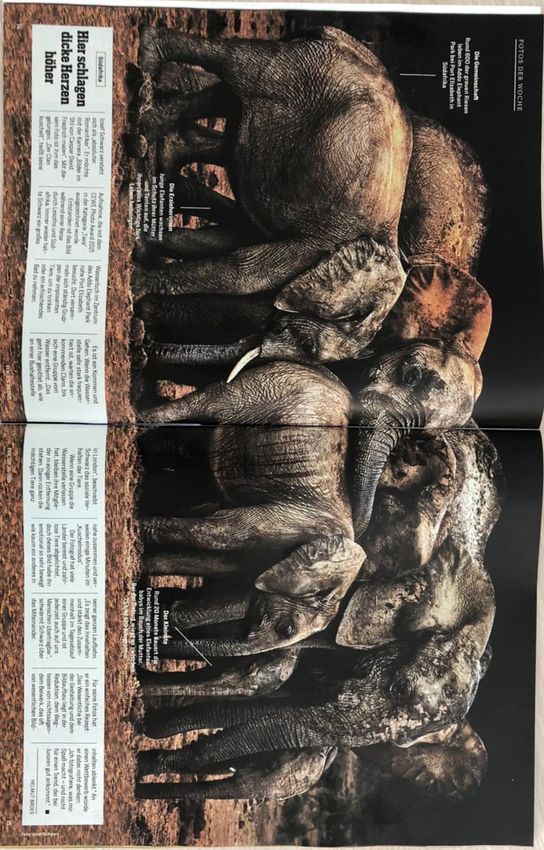
CEWE Photo Award: The world's largest photo competition with a
record number of 606,289 photos submitted from over 170 countries

Soy Sauce making
    Azim Khan Ronnie
    (Bangladesh)

    Winner Category
    „Aerial Photos“

6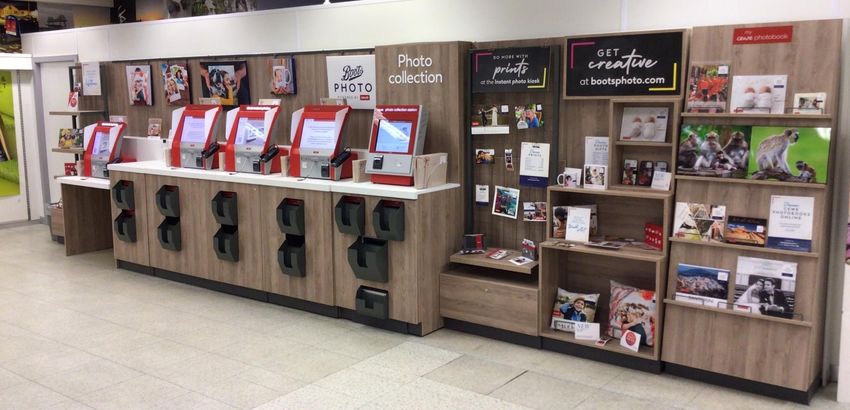
Rainy Season
    Hartmut Schwarzbach
    (Germany)

    Winner Category
7
    „People“
Turtle Watch
    Siegfried Claeys
    (Belgium)

    Winner Category
8
    „Travel & Culture“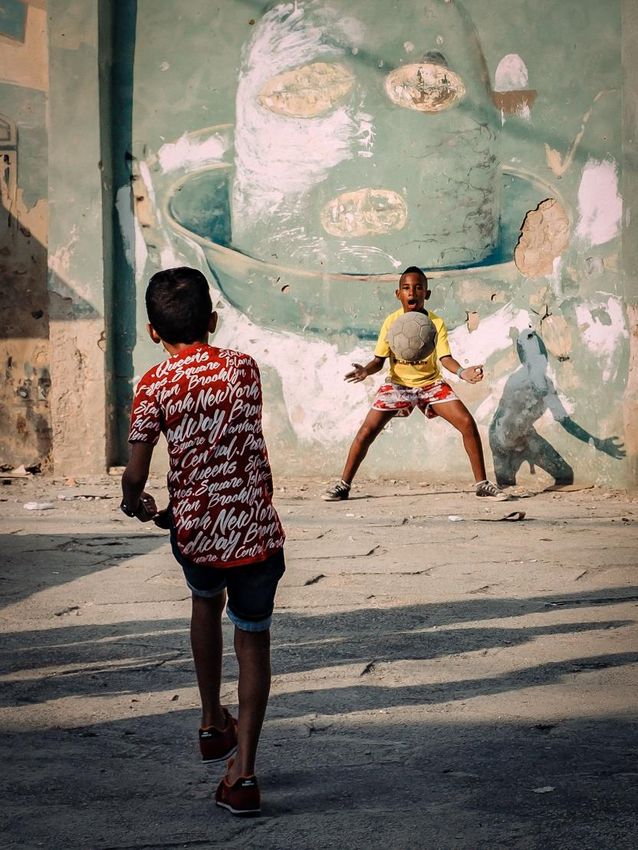
Egg Phone
    David Weimann
    (Germany)

    Winner Category
9
    „Cooking & Food“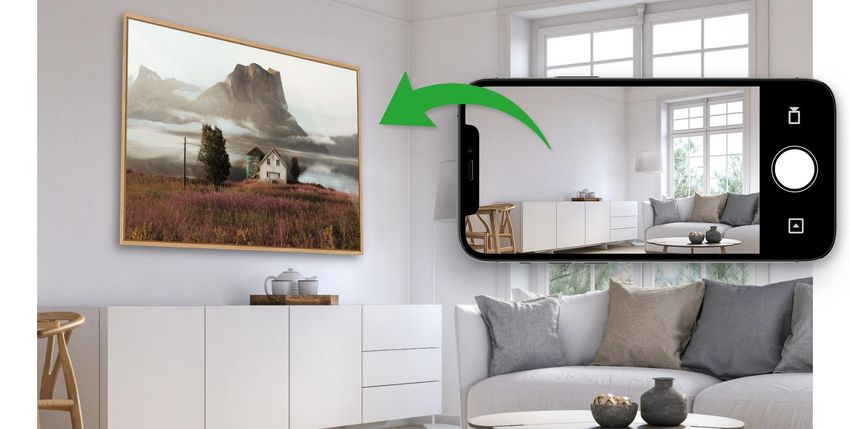
ICE Train
Cor Boers
(Netherlands)

Winner Category
„Architecture
& Technology“
Red Image
     Hans Lahodny
     (Austria)

     Winner Category
11
     „Hobby & Leisure“
Frozen Lighthouse
Manfred Voss
(Germany)
Winner Category
„Landscapes“
12Little Dandelion
Umbrella
Petra Jung
(Switzerland)
Winner Category
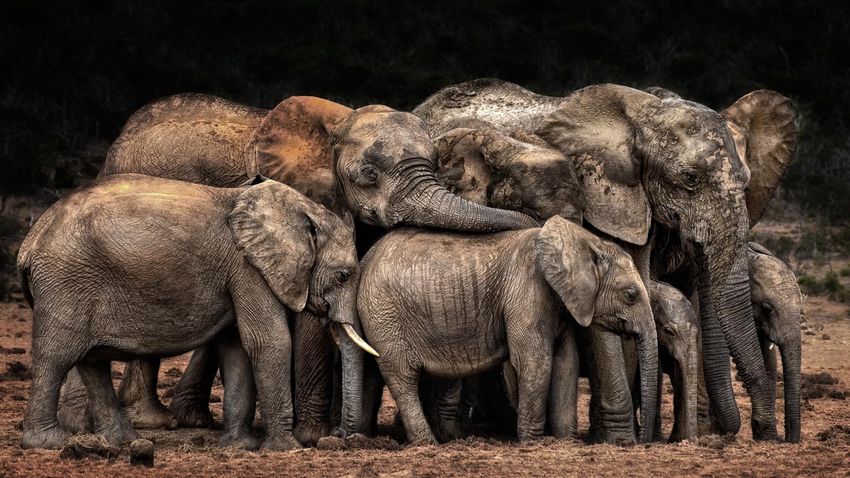
13 „Nature“The Clan cuddles Josef Schwarz (Germany) Winner Category „Animals“
Street Football
Andreas Bauer
(Germany)

Winner Category
„Sport“
PR-Clippings: CEWE Photo Award 2021

 16
17
18
CEWE after H1 with a head start in earnings vs. 2020
Changes of Corona-lockdowns and -easings impact demand behavior

EBIT in Euro millions             Q1                          Q2                Even if negative on group
                                                                                level: Photofinishing business
                                                                                segment (in contrast to typical
                                                                                CEWE seasonality) with EBIT
       2020             „Non-Corona-Quarter“         „Corona-Lockdown“          of 9.8 million euros – the best
                                                                                Photofinishing-EBIT in the
                        FF    KOD    EH              FF   KOD    EH             company's history
                                               2.0                       -1.0
                                                                                   Business Segments
                                                                                   PF: Photofinishing
                                                                                   COP: Commercial Online-Print
       2021             „Corona-Lockdown“            „Corona-Easings“              RT: Retail
                         FF   KOD    EH              FF   KOD    EH
                                               8.6                       -6.4        Increase in demand

                                                                                     Decrease in demand

                                                                                   Rounding differences
                                                                                   may occur.

  Δ 2021 vs. 2020                +6.6                        -5.5

  19
            CEWE after H1 with a head start in earnings of +1.1 million euros
Results Q2: Photofinishing as expected weaker, COP improved
▪ Photofinishing is developing weaker in Q2 than in a normal non-corona year: With the first Corona easings
in Q2, people catch up on things that were not possible in lockdown and order fewer photo products.
Turnover decreased by -15.4% to 93.6 million euros, EBIT is reduced accordingly to -5.6 million euros.
▪ Commercial Online-Print benefits from the Corona easings in Q2 with sales growth and significantly
improved earnings. The optimized production and cost structure sustainably improves the earnings situation.
Turnover increased by 25.8% to 13.7 million euros, EBIT improved by 2.6 million euros to -0.2 million
euros.
▪ Hardware Retail improves results in Q2 with optimized point-of-sale-structure: Despite 40 shops less
turnover reached previous year's level with 7.6 million euros. EBIT improved by 2.9 million euros to -0.3
million euros (mainly due to restructuring costs in the previous year).
▪ In total, the growth in sales in Commercial Online Print cannot virtually offset the decline in Photofinishing,
with Group turnover, at 116.7 million euros, falling short of that of the previous year by -10.6%. The Group
EBIT is reduced accordingly to -6.4 million euros, driven by the core business segment of photofinishing.
201.1 Photofinishing
CEWE honored twice with TIPA World Award for the first time

 22
TIPA World Award for CEWE Calendar A2 Gold Edition

  23
TIPA World Award for CEWE Photo Center

 24
TIPA World Award for RoomView Function

25
10 TIPA World Awards for CEWE and WhiteWall

 26
New products: Cooperation with Faber-Castell

     Faber-Castell colored pencils in an individual photo metal case from CEWE
27
Vaccination @ CEWE
CEWE Oldenburg
CEWE Poland CEWE Eschbach WhiteWall
28CEWE is a great place to work 29
Number of prints and turnover Photofinishing Q2
 Total prints                               Value per photo                          Turnover Photofinishing
 in millions                -20.4%                                       +6.2%       in Euro millions                      -15.4%
                           Target 2021:     Turnover / photo
                            -2% to +3%                                                                       110.6
                                            (Euro cent / photo)
                                                                             25.25
                                                                                                    97.2
                                                                     23.78                                                 93.6
                                                             21.46                          85.9
                                                                                     82.1
                                                     19.85
                                             19.36

                    453    465
     424      432
                                      371

     2017    2018   2019   2020      2021   2017     2018    2019    2020    2021    2017   2018   2019       2020        2021
                                                                                                     Rounding differences may occur.

            After a long time first Corona easings in Q2: people catch up on things that were not possible
            in the lockdown and order fewer photo products (and even less multi-photo-products)
30          Turnover per photo increases with + 6.2%
Number of prints and turnover Photofinishing H1
-8.5%
Total prints Target 2021:
Value per photo +6.0% Turnover photofinishing -3.0%
in millions -2% to +3%
Turnover / photo in Euro millions
225.3 218.5
959 973 (Eurocent / photo)
24.54
898 891 23.15 200.8
862
20.93 180.3
19.46 20.07
167.7
2017 2018 2019 2020 2021 2017 2018 2019 2020 2021 2017 2018 2019 2020 2021
Rounding differences may occur.
Q2 decline in demand also visible in the first half of the year: people catch up
on things that were not possible in lockdown and order fewer photo products
31
Turnover per photo increases with + 6.0%CEWE PHOTOBOOK Q2 and H1
CEWE PHOTOBOOK Q2 CEWE PHOTOBOOK H1
in thousands in thousands
-18.2%
Target 2021:
-2% to +3%
2,732
2,566
2,279 2,369
2,235
-34.1%
Target 2021:
-2% to +3%
1,369
1,232
1,120 1,121
902
2017 2018 2019 2020 2021 2017 2018 2019 2020 2021
Rounding differences may occur.
The extraordinary development in the Corona lockdown in Q2 of the previous year (catch
up of many photo books, even with older image material) is not repeated, and (after a long
time, the first) corona easings in the current Q2 reduced demand additionally
Above all, the classic multi-photo product feels the temporary lack of images due to
vacation restrictions
32As expected, the previous year’s extraordinary
development in Photofinishing did not repeat
Photofinishing EBIT in Q2 in million euros
First hard corona lockdown triggers extra- 2020
ordinary development in Photofinishing 5.1
+7.1
2013 2014 2015 2016 2017 2018 2019
e2020 e2021 2021
-0.3 -10.8 million euros
-0.6
-1.1
-1.9 -2.1 -1.8 -2.0 -2.0
-2.2
Long-term, Corona-unaffected trend of a continuously
slightly negative Q2 operating result of approx. -2.0 m € -3.7
-5.7
The first lockdown easing after a long time lead to an
additional decline in demand and earnings in Photofinishing
33▪ Last year customers used the time spent at home during the first
Business Segment Photofinishing Q2 lockdown to place orders, including orders for photo products from
old photos taken some time ago (“clean-up-effect"). As expected
in Euro millions this extraordinary development was not repeated in Q2 this year.
▪ On the contrary: The current easing of coronavirus restrictions (the
Turnover first one in a long time) also dampened demand: people caught up
-15.4% with things they hadn't been able to do during lockdown and this
resulted in fewer orders for photo products.
82.1 85.9 97.2 110.6 93.6 ▪ Additionally (pre) Easter business this year was in Q1 (March) and
not in Q2 (April) as last year. Nor was there much post-Easter
business this year, since less travelling/fewer Easter holiday trips
2017 2018 2019 2020 2021 overall clearly meant that far less photo material was available to
people.
EBIT
▪ The decline in business resulting from the relaxing of coronavirus
regulations led to a weaker photofinishing EBIT than in a "normal"
0.2 5.1
non-coronavirus year prior to 2020
-1.8 -1.1 -5.7 ▪ Only remaining 0.4 million euros in social insurance payments in
the form of short-time work allowances helped offset some of the
2017 2018 2019 2020 2021 personnel costs incurred without work performed (Q2 2020: 0.7
million euros)
Q2 photofinishing weaker than in a normal non- ▪ Q2 2021 special effects: - 1.0 million euros
coronavirus year: as soon as coronavirus easing was − Effects resulting from the Cheerz purchase-price allocation: - 0.5 m. euros
implemented in Q2 people caught up with things they − Effects resulting from the WhiteWall purchase-price allocation: - 0.5 m. euros
couldn't do in lockdown, hence ordering fewer photo ▪ Previous-year special effects Q2 2020: - 1.1 million euros
products − Effects resulting from DeinDesign purchase-price allocation: - 0.1 m. euros
− Effects resulting from Cheerz purchase-price allocation: - 0.5 million euros
34 Rounding differences may occur.
− Effects resulting from WhiteWall purchase-price allocation: - 0.5 million eurosBusiness Segment Photofinishing H1
in Euro millions ▪ In 2021, demand for photo products and as a result photofinishing
sales is showing a completely different profile from the one in 2020:
Q1 2020 was the last so far largely "normal" (non-corona) quarter,
Turnover Q1 2021 on the other hand was a period strongly affected by the
-3.0% lockdown, just like Q2 in 2020. In contrast, the current Q2 2021 was
impacted by easings of coronavirus regulations.
180.3 200.8 225.3 218.5 ▪ While the ongoing lockdown situation in Q1 generated growing
167.7
online business to significantly benefit the development of sales and
earnings, in Q2, as soon as initial coronavirus lockdown easing
2017 2018 2019 2020 2021 began, people caught up with what had not been possible during
lockdown, thus generally ordering fewer photo products.
EBIT
▪ The Q1 rise in earnings in photofinishing was absorbed in Q2 due to
8.4 4.1 the change in demand: EBIT declined to 4.1 million euros
1.6 1.8
▪ Only remaining 0.6 million euros in social insurance payments in the
-0.4
form of short-time work allowances helped to offset some of the
personnel costs incurred without work performed (H1 2020: 0.7
2017 2018 2019 2020 2021
million euros)
▪ H1 2021 special effects: -2.1 million euros
Switching between coronavirus lockdown and the easing − Effects resulting from the Cheerz purchase-price allocation: - 1.0 million euros
− Effects resulting from the WhiteWall purchase-price allocation: -1.1 million euros
of coronavirus restrictions has changed demand-related
▪ Previous year H1 2020 special effects: -2.2 million euros
behaviour in Q1 and Q2 in comparison to the previous − Effects resulting from the DeinDesign purchase-price allocation: - 0.2 m. euros
year and hence likewise the earnings situation − Effects resulting from the Cheerz purchase-price allocation: - 1.0 million euros
− Effects resulting from the WhiteWall purchase-price allocation: -1.0 million euros
35 Rounding differences may occur.Photofinishing-Turnover by Quarter
Estimated seasonal distribution: CEWE 2017 to 2021 – Share in turnover by quarter as a million
283.0
251.1
218.3
195.4
125.0 110.6 116.2 110.4
103.5 114.7 97.2 93.6 96.3 100.5
85.6 94.5 82.1 85.9
2017 2018 2019 2020 e2021 2017 2018 2019 2020 e2021 2017 2018 2019 2020 e2021 2017 2018 2019 2020 e2021
Q1 Q2 Q3 Q4
Turnover target 2021 Q1 target Q2 target
approx. 600 to 660 m€* 114.0 to 125.4 m€ 102.0 to 112.2 m€ The extraordinary development in the Corona
lockdown in Q2 of the previous year is not
repeated, on the contrary (after a long time) the
Q1 actual
125.0 m€ ✓ Q2 actual
93.6 m€ first corona easings in the current Q2 reduced
demand and turnover
36 * group turnover w/o segments retail, commercial online-print and other Rounding differences may occur.Photofinishing-EBIT by Quarter
Estimated seasonal distribution: CEWE 2017 to 2021 – EBIT by quarter in Euro million
2017 2018 2019 2020 e2021 2017 2018 2019 2020 e2021
80.0
64.3
55.6
48.3
9.8 4.1
5.1 2.6 0.8 0.2
1.3 1.4 3.0 3.3 0.2
-1.8 -1.1 -5.7 2017 2018 2019 2020 e2021 2017 2018 2019 2020 e2021
Q1 Q2 Q3 Q4
EBIT target 2021 Q1 target Q2 target The extraordinary development in the Corona
73 to 85 m€* +3.7 to +4.3 m€ -1.5 to -2.0 m€
lockdown in Q2 of the previous year is not
repeated, on the contrary (after a long time) the
first corona easings in the current Q2 reduced
✓
Q1 actual Q2 actual
+9.8 m€ -5.7 m€ demand and turnover
* group EBIT w/o targets of segments retail, commercial online-print and other. Rounding differences may occur.
371.2 Retail
Retail with focus on photofinishing business

                                               ▪ Own retail stores in NO, PL, CZ, SK
                                               ▪ Strategic focus on photofinishing and
                                                 online business
                                               ▪ EUR 34.1 million revenue (2020) with
                                                 photo-hardware (cameras, lenses, …)

      Retail segment contains hardware revenue only, photofinishing business is
      shown in photofinishing segment
39
Business Segment Retail* Q2
in Euro millions ▪ Hardware retailing also benefited from coronavirus easing
measures in the second quarter, achieving turnover at the same
level as that of the previous year, at 7.6 million euros, in spite of
Turnover * having 40 stores fewer (corresponds to more than ¼ of the
previous 140 stores)
+0.2% ▪ Due to a focus on photofinishing and online business and to
refraining from low-margin hardware business, the active
13.2 12.4 10.6 reduction in turnover before the onset of the coronavirus crisis
7.6 7.6
was at around a strategic -10% to -15%
2017 2018 2019 2020 2021
▪ The EBIT reported for retailing improved significantly by 2.9 million
EBIT * euros.
▪ In Q2 of the previous year, around 1.7 million euros in
restructuring provisions and 1.5 million euros in allowances for
inventories of stocks were accrued on the basis of the store
-0.1 -0.2 -0.3 -0.3 structure optimisation announced
-3.2 ▪ Only remaining 0.2 million euros in social insurance payments in
2017 2018 2019 2020 2021 the form of short-time work allowances helped to offset some of
the personnel costs incurred without any work being performed
(Q2 2020: 0.8 million euros)
▪ Q2 2021 special effects: none
Hardware retailing improves with an ▪ Previous-year special effects Q2 2020: -3.2 million euros
− Restructuring provisions for retailing: -1.7 million euros
optimised store structure earnings in Q2 − Allowances for inventories of stocks: - 1.5 million euros
* only hardware, no photofinishing
40 Rounding differences may occur.▪ In Q1, retailing saw sales dropping by 16.8%, as a result of
Business Segment Retail* H1 the ongoing lockdown situation and in a comparison with the
pre-coronavirus period. A focus on photofinishing and online
in Euro millions business and refraining from low-margin hardware business
actively reduced turnover before the onset of the coronavirus
crisis by around a strategic -10% to -15%. In Q2, also against
Umsatz * the background of coronavirus easing and in spite of around
40 stores fewer (corresponds to more than ¼ of the previous
-8.3% 140 stores), retailing also achieved turnover at the same
level as in the previous year
25.0 23.3 21.0 15.1 ▪ By that the retail segment can somewhat slow down the
13.8
decline in sales in the first half of 2021 to -8.3%
2017 2018 2019 2020 2021
▪ The EBIT reported for retailing improved significantly by 2.9
EBIT * million euros
▪ In H1 of the previous year, around 1.7 million euros in
restructuring provisions and 1.5 million euros in allowances
-0.4 for inventories of stocks were accrued on the basis of the
-0.7 -0.7 -0.7
store structure optimisation announced
-3.7 ▪ Only remaining 0.7 million euros in social insurance
2017 2018 2019 2020 2021 payments in the form of short-time work allowances helped
to offset some of the personnel costs incurred without any
work being performed (H1 2020: 0.9 million euros)
▪ H1 2021 special effects: none
Hardware retailing improves with an
optimised store structure earnings in H1 ▪ Previous year H1 2020 special effects: -3.2 million euros
− Restructuring provisions for retailing: -1.7 million euros
− Allowances for inventories of stocks: - 1.5 million euros
* only hardware, no photofinishing
Rounding differences may occur.
411.3 Commercial Online-Print
Commercial Online-Print

     Service focus           Cost leader in industrial online printing   Metropolitan area
                                                                              Berlin

             Business and advertising prints: flyers, business cards,
             stationery, packaging, promotional items, etc.
43
Business Segment Commercial Online-Print Q2
in Euro millions
▪ Easing of coronavirus restrictions and the resulting revival of
business life is seeing a rise in demand for printed advertising
Turnover
+25.8% material. COP in B2B printing business has increased sales by
25.8% in comparison to the same quarter of the previous year
which was clearly weakened by the coronavirus lockdown
24.7 25.0
19.9
10.9 13.7 ▪ Thanks to this turnover and the optimised cost structure, COP
improved its quarterly earning by a pleasing 2.6 million euros
▪ The ongoing strict cost management in conjunction with a
2017 2018 2019 2020 2021
generally more efficient production and cost structure back up
EBIT
this improvement in earnings
▪ Only remaining 0.3 million euros in social insurance payments
in the form of short-time work allowances helped to offset
some of the personnel costs incurred without any work being
performed (Q2 2020: 0.8 million euros)
-0.3 -1.1 -0.2
-1.5
-2.8
2017 2018 2019 2020 2021 ▪ Q2 2021 special effects: -0.1 million euros
− Effects resulting from the Laserline purchase-price allocation: - 0.1
million euros
COP benefits from the easing of coronavirus rules with
▪ Previous-year special effects Q2 2020: -0.1 million euros
increasing turnover − Effects resulting from the Laserline purchase-price allocation: - 0.1
million euros
The optimised production and cost structure is
sustainably improving the earnings situation in COP
44 Rounding differences may occur.Business Segment Commercial Online-Print H1
in Euro millions ▪ In Q1, COP was strongly impacted by the coronavirus in a B2B
printing business, with a 43.2 % drop in sales during lockdown in
comparison to a virtually coronavirus-free first quarter in 2020. In
Turnover Q2, the easing of coronavirus restrictions and the resulting revival
-20.8% of business life is perceivable and is seeing a rise in demand for
printed advertising material: COP increased by 25.8% against the
40.5 49.1 50.2 second quarter of 2020 which was weakened by the coronovirus
33.4 26.5
lockdown
▪ The COP thus achieved a total turnover of 26.5 million euros in
2017 2018 2019 2020 2021
the first half of 2021 and reduced the accumulated decline in
turnover to -20.8%
EBIT
▪ The ongoing strict cost management in conjunction with a
generally more efficient production and cost structure resulted in a
clear improvement in earnings in the amount of 2.6 m. euros
-0.2 ▪ Remaining 0.9 million euros in social insurance payments in the
-1.8 -1.4 -0.8
-3.4 form of short-time work allowances helped offset some of the
2017 2018 2019 2020 2021 personnel costs incurred without work performed (H1 2020: 0.9
million euros)
▪ H1 2021 special effects: - 0.1 million euros
The optimised production and cost structure is − Effects resulting from the Laserline purchase-price allocation: - 0.1 m. euros
▪ Previous year H1 2020 special effects: -0.2 million euros
sustainably improving the earnings situation in COP − Effects resulting from the Laserline purchase-price allocation: - 0.2 m. euros
45 Rounding differences may occur.1.4 Other
Business Segment Other Q2
in Euro millions
                                                                        Structural and corporate costs and profits arising
                                                                        from real estate property and company investments
Turnover                                                   +28.5%
                                                    1.9                 are shown in the "other" business segment.
                                         1.5
                              1.3
                   1.0
        0.7
                                                                    ▪   futalis continues to develop strongly and increases
                                                                        turnover in the other business segment by 28.5%
       2017       2018       2019       2020       2021

 EBIT
                                                                    ▪   The EBIT contribution of the segment is mainly due to
                                                                        the costs for the Annual General Meeting (in the previous
                                                                        year only in October) at EUR -0.3 million, around EUR
        -0.9       -0.6       -0.9       -0.1       -0.3                150 thousand less than in the previous year (Q2 2010:
                                                                        EUR -0.1 million)
                                                                    ▪   With a slightly positive result above the break-even level,
        2017       2018      2019       2020       2021                 futalis continues to make a very gratifying contribution to
                                                                        the segment result

        Segment for Other business continues to increase turnover

                                                                                         Rounding differences may occur.
  47
Business Segment Other H1
in Euro millions
Structural and corporate costs and profits arising
from real estate property and company investments
Turnover are shown in the "other" business segment.
+19.8%
3.7
2.6 3.1
1.4 1.8
▪ futalis continues to develop strongly and increases
turnover in the other business segment by 19.8%
2017 2018 2019 2020 2021
EBIT ▪ The segment's contribution to EBIT is slightly weaker
than in the previous year, mainly due to the costs for
the Annual General Meeting (last year only in
October)
▪ With a slightly positive result above the break-even
-1.0 -1.2 -0.3 -0.4
-1.4 level, futalis continues to make a very gratifying
2017 2018 2019 2020 2021 contribution to the segment result
Segment for Other business continues to increase turnover
Rounding differences may occur.
482. Group Results Q2 2021
Group Turnover Q2
in Euro millions
                                                                            -10.6%
                                                                          fx-adj.: -10.6%
                                                                           Target 2021:
                                                                            -2% to +6%
                                  134.2          130.6
                    123.9          1.3
       116.0                                      1.5             116.7
                     1.0           10.6           7.6
        0.7                                                       1.9
                     12.4                         10.9
       13.2                        25.0                           7.6
                                                                                            Retail:            Retailing ended Q2 at the same level as last year in spite
                      24.7                                        13.7                      +0.2%
       19.9                                                                                                    of having fewer stores
                                                                                            (fx-adj.:-2.0%)

                                                                                            Commercial         COP benefited from the easing of the coronavirus rules,
                                                 110.6                                      Online-Print:      with turnover clearly exceeding that of the coronavirus-
                                   97.2                           93.6                      +25.8%
                                                                                                               related weak quarter in the previous year
       82.1           85.9                                                                  (fx-adj.:+25.9%)

                                                                                            Photofinishing:    As expected, the extraordinary development in the first
                                                                                            -15.4%             coronavirus lockdown was not repeated; on the contrary,
                                                                                            (fx-adj.:-15.3%)
                                                                                                               current coronavirus easing, carried out after a long time,
       2017          2018         2019           2020             2021                                         is now reducing demand

                                                                                                                                               Rounding differences may occur.
        Pho tofinishing   Comme rci al O nline-P rint    Retail     Other

               The extraordinary development in photofinishing last year was not repeated as
               expected; easing of restrictions additionally reducing demand and turnover
50
               COP turnover clearly raised and retailing at the same level as last year
Group Turnover H1
in Euro millions -5.2%
fx-adj.: -5.0%
Target 2021:
-2% to +6%
274.6 277.0 262.6
234.6 254.5 2.6 3.1
1.8 15.1 3.7
21.0
1.4 13.8
23.3 33.4 Retail: Q1 with corona lockdown (turnover -16.8%) and Q2 with corona
50.2 26.5 -8.3%
25.0 easing (turnover +0.2% despite less stores) slows retail turnover
49.1 (fx-adj.: -9.2%)
decline in H1 to -8.3%
40.5
Commercial Q1 with corona lockdown still with a -43.2% decline in turnover,
Online-Print: Q2 turnover increase with corona easing 25.8% and allows COP
-20.8%
225.3 218.5 to close the first half of the year with a -20.8% decline in turnover
200.8 (fx-adj.: -20.7%)
167.7 180.3
Photofinishing: Change from corona lockdown and easing: Q1 with 9.0%
-3.0% turnover growth and Q2 with -15.4% decrease leads to H1
(fx-adj.: -2.7%) turnover decrease of -3.0% in photofinishing
2017 2018 2019 2020 2021 Rounding differences may occur.
Pho tofinishing Comme rci al O nline-P rint Retail Other
Q2 decline in turnover in photofinishing
also perceivable at a Group level in H1
51EBIT
in Euro millions
2.1
Q2 H1 1.0
Photofinishing
-0.1 -0.3 Photofinishing -0.4 -0.3 -0.4
-0.9 -0.6 -0.9 -0.3 -1.0
-1.0 -0.2 -1.0 -0.2 -1.4 -1.2
-1.5 -0.7 4.1
-0.1
-0.3 -0.3 Commercial Online-
0.2 1.6 -0.7
-1.5 -1.1
Commercial Online- -0.4 -0.7 -0.8 Print
-3.2 -0.2
Print -3.7
1,8
-1.1 Retail -1.8 -1.4 Retail
-1.8
5,1 -5.7 -0.4 8,4
-3.4 Other -3.8 Other
-4.1 -2.8
-3.4
-6.4
2017 2018 2019 2020 2021 2017 2018 2019 2020 2021
Q2 Group EBIT: corona-driven decline in With a head start in Q3: Group EBIT in
photofinishing earnings greater than H1 better by 1.1 million euros than in the
improvement in earnings in COP and retail previous year
523. Financial details
Consolidated income statement Q2

Figures in millions of euros                           Q2 2020 % Turnover   Q2 2021    % Turnover   ∆ as %     ∆ as m€    (+) Commercial Online-Print and Retail
Turnover                                                 130.6    100.0%      116.7       100.0%     -10.6%       -13.8   (-) Photofinishing (extraordinary development 2020 + Corona easing 2021)
Increase / decrease in finished and unfinished goods        0.1      0.1%        0.0         0.0%        62%       -0.1
Other own work capitalised                                  0.4      0.3%        0.3         0.2%      -33%        -0.1   (+) Release of provisions for allowances, sale of fixed assets
Other operating income                                      4.2      3.2%        6.3         5.4%     48.7%         2.1   (+) Income from recyclable residual production materials
Cost of materials                                         -33.5   -25.7%       -31.5      -27.0%      -6.1%         2.0
Gross profit                                             101.7     77.9%        91.8       78.7%      -9.7%        -9.9   (+) Business-driven reduction
Personnel expenses                                        -43.4   -33.3%       -45.0      -38.5%      -3.5%        -1.5   (+) Allowances for inventories in retail in the previous year
Other operating expenses                                  -45.4   -34.8%       -40.4      -34.6%      11.1%         5.0
EBITDA                                                     12.9      9.9%        6.5         5.5%    -49.8%        -6.4   (-) Exercise of stock option program, tariff adjustm., less short-time work
Amortisation/Depreciation                                 -13.8   -10.6%       -12.9      -11.1%        6.8%        0.9   (+) Reductions in Commercial Online-Print and Retail
Earnings before interest, taxes (EBIT)                     -1.0     -0.7%       -6.4        -5.5%      560%        -5.5
                                                                                                                          (+) Business-driven decline (especially mail order costs)
Rounding differences may occur.
                                                                                                                          (+) Restructuring provisions in Retail in the previous year

       54
Positive overall result:
Balance Sheet at 30 June +€ 58.6 m. and
dividends of
-€ 31.1 m lead to
Liabilities +€ 27.8 m.
Scheduled depreciation of
software and PPA assets in euro million Reduction of non-
as well as fixed assets current lease
including sales: liabilities: -€ 3.1 m.
-€ 13.9 m.
Pension provisions
Deferred tax assets: increase: +€ 1.9 m.
+€ 4.1 m.
508.7 491.4 487.8 508.7 491.4 487.8 Purchase price
Fair value valuation of payment for the
financial assets: +€ 3.6 m. acquisition of the
402.9 402.9 = 59.8% remaining Cheerz
shares: -€ 1.5 m.
235.9 Equity ratio
308.8 308.8 263.8 291.6
Trade payables as a
result of lower
381.8 366.9 361.2 = 53.7% business volume:
212.6
Non-current Equity -€ 9.5 m.
281.2 Equity ratio
assets 185.8 191.3 97.1 Purchase price
payment for
35.7 90.1 remaining Cheerz
Non-current 87.1 shares: -€ 6.4 m.
liabilities 29.7
154.6 175.7 Other short-term
123.0 121.6 126.9 124.5 126.6 137.5 109.1 liabilities (-€ 5.4 m.)
Current Current 87.8
mainly deferrals of
assets liabilities social security
contributions and
2017 2018 2019 2020 2021 2017 2018 2019 2020 2021 VAT.
The decline in liquid funds (-€ 6.9 million) especially influenced by again regular income tax prepayments (expiry of special
Corona measures, which increase the receivables from income tax refunds (+€ 6.8 m.)). Repayment of current
financial liabilities:
Stocks from a build-up of inventory in onsite photofinishing and COP, at the same time inventory reduction in retailing: +€ 2.6 m. -€ 4.0 m.
Decline in other
CEWE with a very strong equity ratio of 59.8% short-term provisions
due to utilization
through restructuring:
Expiry of Corona-related liquidity aid and Corona-related fewer supplier liabilities reduce -€ 2.2 m.
liabilities, while equity increases due to strong Christmas business of last year
55 Blue = Corona-related
Rounding differences may occur.From Balance Sheet to Management Balance Sheet
Balance Sheet Management Balance Sheet
Equity Equity
Non-current
Non-current assets assets
Non-current Gross financial
liabilities liabilities
Non-operating
Working Capital
liabilities
Current
Current assets
liabilities
Balance Sheet total: 397 Euro millions
The Balance Sheet total is reduced to capital
Balance Sheet total: 488 Euro millions elements "to be paid for" (by way of dividends or
Short-term operative debts/ interest) in the management balance sheet
non-interest-bearing liabilities:
91 Euro millions
56Management-Balance Sheet at 30 June
Scheduled depreciation of software and
PPA assets as well as fixed assets Positive overall
including sales: result: +€ 58.6 m.
-€ 13.9 m. and dividends of
-€ 31.1 m lead to
Deferred tax assets: +€ 4.1 m. +€ 27.8 m.
Fair value valuation of financial assets:
+€ 3.6 m.
Capital Employed Capital Invested Repayment of
in euro millions 402.2 377.4 397.3 Net operative working in euro millions 402.2 397.3 financial
capital 377.4 liabilities:
-€ 4.5 m.
Stocks from a build-up
of inventory in onsite
Decrease in
305.3 finishing and COP, at 305.3 lease liabilities
the same time
-€ 3.9 m., among
inventory reduction in
retailing: +€ 2.6 m.
235.9 other things as a
222.6 222.6 result of retail
263.8 291.6 restructuring.
Trade payables due to
Non-current 381.8 366.9 361.2 less business
-€ 9.5 m.
212.6
assets Equity
281.2 Pension
Other net working provisions
185.8 capital 191.3 +€ 1.9 m.
Short-term tax item due Gross financial 126.3
Cash to positive 71.8 63.4 Purchase price
development of
liabilities 58.8 payment for
Net 22.3 17.3
business: +€ 6.5 m. 2.4 Cheerz:
11.7 12.5 24.2 18.8 28.9 33.9 40.0 41.8 42.4 -€ 1.5 m.
Working 14.5 12.3 7.9 -13.6 Purchase price Non-operating
Capital 2017 2018 2019 2020 2021 payment for acquisition liabilities 2017 2018 2019 2020 2021
of the remaining
Cheerz shares reduces
financial debt: -€ 6.4 m.
Mainly deferrals of
social security
contributions and VAT:
-€ 5,4 m.
Capital employed increases due to the corona-related increase in net working capital
Blue = Corona-related
57 Rounding differences may occur.Decrease of € 8.8 m. due to lower operating investments, lower cash outflows for
Free cash flow Q2 consolidated shares and more inflows from investments in financial assets and
the sale of property, plant and equipment
Cash Flow from Outflow of funds from Free-Cash Flow
operating business investment aktivities in euro millions
Decrease of -€ 42.9 m. due to:: in euro millions in euro millions
-€ 4.1 m. earnings (total EBITDA
and non-cash effects) 2017 2018 2019 2020 2021 2017 2018 2019 2020 2021 2017 2018 2019 2020 2021
-€ 21.6 m. tax payments
(postponed or reduced in the 18.1
same quarter of the previous year
+ =
due to Corona)
7.3
4.5
-€ 11.4 m. other net working 1.0 0.7
capital (mainly lower increase in
sales tax liabilities due to lower
sales and last year’s deferral of
social security payments in -4.7
France in the same quarter)
-9.3 -10.5 -8.3 -9.8
-€ 5.8 m. operating net working
-13.5
capital (especially in the previous
year due to the corona-related -24.8
increase in trade payables)
-29.5
Acquisition of
WhiteWall -36.6
-€32.0 m
-43.9
Rounding differences may occur.
Corona-related postponements of income tax payments and the absence of positive effects from the
special Corona economy in Q2 2020 reduce cash flow from operating activities by 42.9 million Euro
Lower cash outflow from investing activities
Free cash flow in the second quarter fell by 34.1 million Euro as a result of various corona effects
58ROCE
Avarage capital
12-months-EBIT ROCE *
employes in the past 4
in euro millions quarters in %
in euro millions
80.8
20.6% 20.3%
16.4% 16.5%
56.1 59.3 383.1 399.0 15.5%
==
47.0 45.8 339.7
279.5
228.0
2017 2018 2019 2020 2021 2017 2018 2019 2020 2021 2017 2018 2019 2020 2021
Above all, earnings development of the 2020
Christmas business increases ROCE to 20.3%
* ROCE = EBIT / Capital Employed. Rounding differences may occur.
594. Outlook
Revenue e2021: CEWE should continue to grow
     Revenue (CONCEPTUAL)                                                        e2021: 710 to 770
                                                                                   Euro millions

                                                                Growth especially through
                                                                Digital Photofinishing

                                  Transformation phase
                                  Analogue / Digital

        Regional expansion on                                                                        Digital
        the analogue market                                                                          Photofinishing

                                                                                                     Commercial
                                                                                                     Online-Print

                                                                                                     Hardware-Retail
                Analogue                                 Digital
                Photofinishing                           Photofinishing                              Analogue
                                                                                                     Photofinishing
       1990 1992 1994 1996 1998 2000 2002 2004 2006 2008 2010 2012 2014 2016 2018 2020

61
EBIT development: e2021
in Euro millions
EBIT e2021:
84 72 to 84 Euro millions
79.7
72
56.8
55.7
49.2
47.0
36.4
32.6
27.2 29.4 28.3 28.9
17.9
11.2
2008 2009 2010 2011 2012 2013 2014 2015 2016 2017 2018 2019 2020 e2021
62H1 with a head start confirms CEWE Group Targets 2021
EBIT in Euro millions Q1 Q2 Q3 Q4 Full Year
2020 2.0 -1.0 -1.7 80.3 79.7
EBIT e2021
2021 8.6 -6.4
72 to 84
+6.6 -5.5
Δ 2021 vs. 2020
H1 +1.1
Rounding differences may occur.
63CEWE Group Targets 2021
Targets PY 2020 Target 2021 Change in %
Photos 1 billion photos 2.34 ~2.3 to ~2.4 -2 to +3
CEWE PHOTO BOOK millions 6.52 ~6.4 to ~6.7 -2 to +3
Operational Investments 2 Euro millions 35.6 ~48
Revenue Euro millions 727.3 710 to 770 -2 to +6
EBIT Euro millions 79.7 72 to 84 -10 to +5
EBT 3 Euro millions 76.4 70 to 82 -8 to +7
Earnings after tax 4 Euro millions 51.9 48 to 56 -8 to +7
Earnings per share Euro 7.20 6.60 to 7.73 -8 to +7
1 The number of photos is the sum of the images with which CEWE photo products were designed and refers to all images that are used in value-added products Rounding differences might occur.
(e.g. CEWE PHOTOBOOK, CEWE CARDS, CEWE CALENDAR, CEWE WALL PICTURES and other photo gifts)
2 Outflows from investments in property, plant and equipment and intangible assets, netted against inflows from the sale of property, plant and equipment and intangible assets; without acquisitions/company acquisitions
3 Without subsequent valuations of equity instruments
4 Based on the normalized group tax rate of the previous year
» The ranges of these 2021 targets reflect the uncertainty that is currently arising
from the pandemic and potential effects on CEWE's business development
645. Q&A-Session Analyst Conference Call Q2 2021
You can also read