DEVELOPMENT GUIDE 2018 mid-year update - Downtown Seattle Association
←
→
Page content transcription
If your browser does not render page correctly, please read the page content below
DEVELOPMENT
GUIDE
2018 mid-year update
The Downtown Seattle Association publishes two              has tracked comparable data since 2005. An explanation of
development guides each year to measure construction        criteria used in this analysis and a glossary of terms are
activity taking place within downtown Seattle. The first,   included at the end of this document. Except where otherwise
published each February, is an annual summary of all        noted, statistics in this update refer to projects currently
development activity for the previous calendar year. The    under construction.
February summary is followed by a mid-year update           For more information, please email
published in summer. Our downtown development database      info@downtownseattle.org or call 206-623-0340.

JUNE 2018                                                                                             DEVELOPMENT GUIDE   01
Introduction

Since the start of the current boom in 2010, Seattle has
grown at an unprecedented rate. Downtown is home to the
                                                              Key Findings
largest share of that growth.
                                                              ■■ Downtown  Seattle is seeing a historic level of investment
Impressive new towers are changing Seattle’s skyline and       with $5.6 billion worth of projects under construction,
raising the city’s profile internationally. Apartments         topping a previous high of $5 billion one year ago.
continue to lead the way, adding record numbers of new        ■■ Residential
                                                                           construction continues to dominate.
units in the past few years, much of that in the South Lake    Sixty percent of projects under construction include a
Union and Denny Triangle neighborhoods. Office space and       residential component — mostly apartments.
hotel rooms are also being constructed at unprecedented
rates. With dozens of projects still underway, this           ■■ Downtown  office construction has rebounded to nearly
construction boom continues to deliver. This continued         match its 2015 peak. In 2017, downtown Seattle saw more
investment shows a high level of confidence and                office construction than any other central business district
contributes to a vibrant and dynamic economy.                  in the U.S. In fact, Seattle represented 20 percent of all CBD
                                                               office construction in the nation.

                                                              ■■ Downtown will welcome a record 2,192 new hotel rooms
                                                               in 2018. This includes what will be the largest hotel
                                                               in Seattle upon completion: the 1,260-room Hyatt
                                                               Regency near the future home of the Washington State
                                                               Convention Center Addition.

JUNE 2018                                                                                                  DEVELOPMENT GUIDE   02
Rendering: Amazon
            Development
            Activity Overview
            Downtown Seattle construction
            boom continues

            A record $5.6 billion worth of projects were under construction downtown
            at the end of the second quarter of 2018. These investments reflect
            optimism and confidence in the future of downtown’s economy. The value
            of current construction is 27 percent higher than last year and nearly five
            times higher than in 2010 — the decade’s lowest point.

            Downtown represents 58 percent of the construction value for permits
            issued in Seattle over the 12 months between June 2017 and June 2018 (up
            from 50 percent for the same period last year).

JUNE 2018                                                                            DEVELOPMENT GUIDE                   03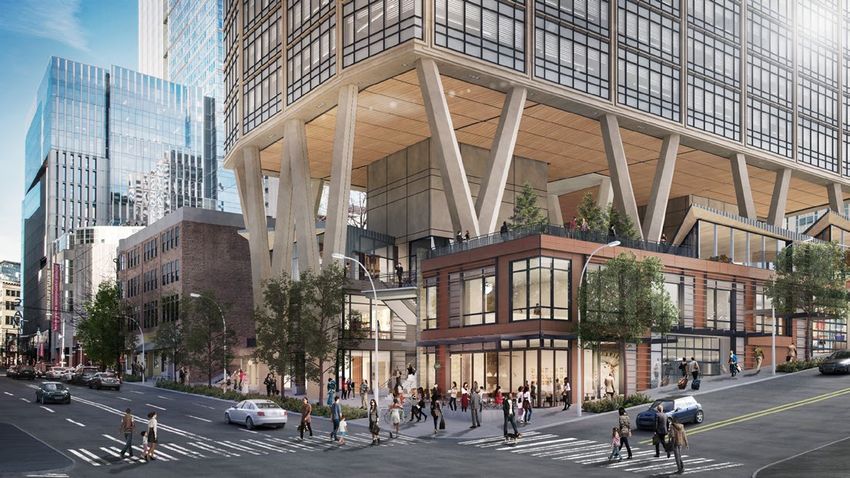
Construction Value for
                                                                              Permits Issued
                                                                              12 months ending June 2018

                                                                                                                                   $2.5
                                                                                                                                   BILLION

                                                                                                 $1.5
                                                                                                 BILLION

                                                                                Seattle
                                                                                Downtown

                                                                              Downtown represents 58 percent of the
                                                                              construction value for permits issued in
                                                                              Seattle during the past 12 months.

                                                                              Source: King County Assessor

  Project Cost
  Under construction mid-year (adjusted for inflation)

                $6.0

                $5.0

                $4.0

                $3.0
B I LLI O N S

                $2.0

                $1.0

                $0.0
                   2005   2006   2007   2008      2009   2010   2011   2012         2013        2014          2015         2016          2017          2018

                                                                                            Figures are in 2018 dollars. Construction cost does not include
                                                                                                   land or soft costs such as permitting and design work.

  JUNE 2018                                                                                                                  DEVELOPMENT GUIDE          04
Downtown Seattle has 224 projects
                                                                            currently in the pipeline — nearly as many as
                                                                            were completed in the previous eight years.

                                                                                                                                             Rendering: Populous
Of the 224 projects working their way through the pipeline,      the historic average of 44 projects delivered per year
65 are under construction. Seven are in demolition, shoring      since 2005. The largest share of scheduled deliveries is in
and excavation phases. Another 27 have land-use permits          2020 with 90 projects scheduled for completion. Even if
but are awaiting building permits. The largest share (125        half of those in predevelopment are canceled, delayed or
projects) is in predevelopment.                                  put on hold due to changes in the economy or other
                                                                 factors, annual deliveries through 2020 will be close to
From 2018 through 2020, an average of 52 projects are            the historic average.
scheduled for completion per year. This is slightly above

Buildings by Current Status
and Completion Year
For those with announced completion dates

                                                                                     Completed
       2010                       24
                                                                                     Currently Under Construction
        2011      7
                                                                                     Demolition, Shoring and Excavation
        2012                       25
                                                                                     Land Use Issued
       2013                            26
                                                                                     Predevelopment
       2014                                  30
                                                                                  The numbers next to each bar indicate the total projects
       2015                                       37                              completed or scheduled for completion that year.

       2016                             27

        2017                                                51

       2018                            26

       2019                                            41

       2020                                                                                      90

        2021      7

2022+ or TBD                                                           67

JUNE 2018                                                                                                                DEVELOPMENT GUIDE                         05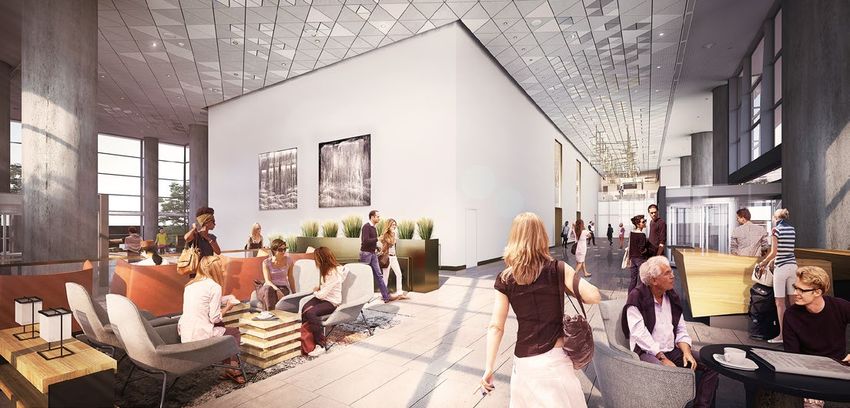
Residential development
      continues to outpace
      historic averages

In 2017, developers completed 5,672 residential units                  data, in the first quarter of 2018 downtown saw no
downtown. This is more than twice as many as the year                  year-over-year growth in average rents, higher vacancy
before and the highest number since tracking began in                  rates and more landlords offering concessions.1 This
2005. The majority (5,549) of these units are apartments.              suggests that additional housing supply can reduce
In the first half of 2018, there has been some evidence that           pressure in a heated housing market. While challenges
this new supply improved the outlook for affordability of              related to housing affordability remain, this dampening of
market-rate rental housing downtown. According to CoStar               a heated rental market is welcome news to renters.

Residential Units by Current Status
and Completion Year
For those with announced completion dates

                                                                                Completed
       2010          829
                                                                                Currently Under Construction
        2011   202
                                                                                Demolition, Shoring and Excavation
       2012                1,875                                                Land Use Issued
       2013                    2,446                                            Predevelopment
       2014                            3,292                                 The numbers next to each bar indicate the total completed or
                                                                             scheduled for completion each year.
       2015                              3,600

       2016                  2,199

        2017                                           5,672

       2018                                3,793

       2019                                    3,978

       2020                                                                                                                                      18,849

2021+ or TBD                                                   6,339
                                                                                                                           1. Custom CoStar query, June 2018

JUNE 2018                                                                                                                        DEVELOPMENT GUIDE        06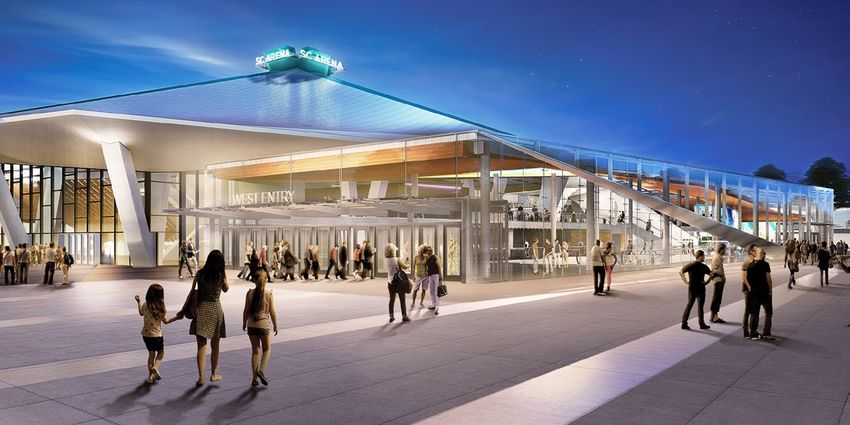
Residential Units
Under construction mid-year
10K

 8K

 6K

 4K

 2K

 0K
   2005          2006           2007       2008   2009   2010    2011     2012    2013     2014     2015      2016     2017      2018

   Apartment Units                   Condominium Units

The number of apartments under                            threat of lawsuits under the state’s condo       More than four times as
construction has decreased year-over-year                 defect liability law increases liability for     many apartment units
but is up from the end of 2017. There are                 developers. It also increases insurance and      are currently under
currently 6,883 apartment units under                     financing costs for each condo project. With     construction than in
construction, compared to 8,880 during                    high demand for condos, there has been a         2008 — the previous
the same period last year. While down                     slight uptick in recent development. Due         cycle’s peak.
year-over-year, this is well above both the               to the high cost of construction in Seattle,
apartment peak from the previous cycle                    new condominiums tend to be at the high          In 2018, Seattle tied
(2008) and the historic average.                          end of the market. The lack of recent condo      San Francisco for the
                                                          development is a factor in the high cost         highest expected
Despite high demand, the number of                        of home ownership compared to renting.           increases in construction
condominium units in production has                       Because of this, Seattle is now a renter-        costs in the nation.²
remained low since the last development                   majority city.
cycle ended during the Great Recession.
This is, in part, because current state law
discourages condo development. The

2. Puget Sound Business Journal,
  “‘Overheated’ Seattle and S.F. will
   have highest U.S. construction
   cost increases in 2018, report says,”
   May 17, 2018.

JUNE 2018                                                                                                            DEVELOPMENT GUIDE   07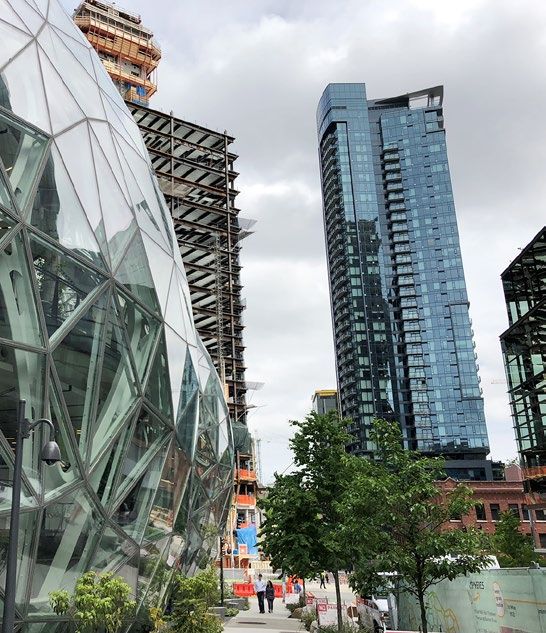
The role land use plays
in housing costs

By 2022, Seattle is expected to surpass its 2035
population growth projections that were set only a
few years ago. This is an extraordinary time in Seattle,
yet our land-use policies are rooted in the early part of
the 20th century, favoring single-family homes.
Current regulations allow just 20 percent of Seattle’s
residential zones to accommodate multi-family
homes. These constricted zones will face enormous
pressure to absorb hundreds of thousands of
newcomers in coming years. Confining development
will have a direct impact on the cost of land,
increasing rents and condo prices. With no significant
changes to those century-old zoning restrictions, we
can expect housing costs to continue to rise.

A look at our sister city, San Francisco, tells a
cautionary tale. San Francisco is well known for a
shortage of housing driving up prices. Many fear
Seattle is headed in a similar direction. However, a
density comparison between the cities shows we still
have room to grow.

How does density in Seattle compare
to San Francisco?³
Population density per square mile

                                     8,210
                                     Seattle                Since 2000
                                     18,584                 ■■ Seattleurban center and urban village density
                                     San Francisco            increased by 2,664 residents per square mile to
                                                              9,508 residents per square mile.

                                                            ■■ In
                                                                Seattle, density in single-family zones added only
While most land in Seattle is zoned for single-family
                                                              739 people per square mile to reach 6,404 residents
homes, designated urban centers and urban villages            per square mile.
in certain areas of the city allow for denser, transit-
rich development. San Francisco, with major barriers        ■■ SanFrancisco’s density increased only 12 percent,
to growth, is growing about as fast as Seattle’s              compared to 39 percent in Seattle’s urban centers
single-family zones. Seattle’s urban center and urban         and urban villages. Seattle population density grew
village zones are growing four times as quickly. In           22 percent citywide but only 13 percent in single-
2017, nearly 90 percent of new housing in Seattle was         family neighborhoods.
built on 18 percent of land zoned for residential.4 In
fact, more than half of all residential development in
Seattle was in the urban villages that make up greater
downtown Seattle.
                                                            3. Density, population and housing growth figures in this section are from Esri
From 2006 to 2017, Seattle netted 62,000 new housing           Community Analyst.
                                                            4. Seattle Times, “Rapidly growing Seattle constrains new housing through
units — double what San Francisco added during that            widespread single-family zoning”, May 3, 2018.
                                                            5. Sources: Seattle Department of Construction and Inspections, San
same period.5                                                  Francisco Department of Building Inspection.

JUNE 2018                                                                                                                   DEVELOPMENT GUIDE   08
Office development continues
                                                                           at a strong pace, outperforming
                                                                           downtowns nationally

                                                                           Seventy million square feet of commercial office
                                                                           space supports our vibrant downtown economy. This
                                                                           sector has grown tremendously over the past several
                                                                           years, adding 12 million square feet on net since 2010.
                                                                           Despite expanding inventory by 21 percent during
                                                                           this period, downtown occupancy increased from 86
                                                                           to 92 percent.6

                                                                           With 6.5 million square feet under construction, the
                                                                           pace of office activity continues to soar above the
                                                                           historical average. Current activity is slightly off
                                                                           from mid-2015, when 7.1 million square feet were
                                                                           under construction. However, current levels are 61
                                                                           percent more than the 4 million square feet under
                                                                           construction during office peak of the previous cycle
                                                                           in 2008.

                                       Downtown Seattle saw more office space completed in 2017 than any
                                       other U.S. downtown. In fact, downtown represented 20 percent of all
                                       central business district office construction completed in the nation.7

  Office Square Footage
  Under construction mid-year

                8.0

                7.0

                6.0

                5.0
M I LLI O N S

                4.0

                3.0

                2.0

                1.0

                0.0
                  2005   2006   2007   2008   2009    2010     2011    2012       2013          2014          2015          2016          2017         2018

                                                                                                                             6. Custom CoStar Query, June 2018
                                                                          7. JLL Research, cited in State of Center City 2018, Center City District, Philadelphia

  JUNE 2018                                                                                                                        DEVELOPMENT GUIDE          09
Rendering: Skanska
Office Square Footage by Status
and Completion Year in Millions
For those with announced completion dates
Completed
2010 1.2 M
Currently Under Construction
2011 1.6 M
Land Use Issued
2012 0.5 M
Predevelopment
2013 0.4 M
2014 0.1 M
2015 2.6 M The numbers next to each bar indicate the square
footage (in millions) completed or scheduled for
2016 2.5 M completion that year.
2017 3.8 M
2018 0.5 M
2019 3.3 M
2020 7.0 M
2021+ or TBD 3.5 M
Including space currently under construction, there is a Between 2010 and 2018, developers delivered
total of 14 million square feet of office space in the 13 million square feet of office space. More than
pipeline. This is the equivalent of 20 percent of the two-thirds of that was in the past three years.
current office inventory downtown. More than 10 million
of that is scheduled for completion by the end of 2020.
JUNE 2018 DEVELOPMENT GUIDE 10Rendering: LMN Architects
Downtown welcomes a
record number of new
hotel rooms in 2018
With nearly 15,000 rooms, downtown Regency near the future home of the
already has the highest hotel capacity in convention center addition. The 6,414 rooms in
the city. Seattle’s growing tourism various stages of
industry and the planned Washington A total of 6,414 new rooms are in the hotel
development represent
State Convention Center Addition are pipeline. That’s enough to increase
a potential 43 percent
expected to keep demand high. This downtown’s hotel inventory by 43 percent.
increase in downtown
strong development cycle comes after a This includes 2,390 under construction,
Seattle’s hotel capacity.
period of calm, where hotel development 925 with land-use permits and another
ground to a halt in 2011. No hotels were 3,099 in predevelopment stages.
completed for three years. Now, with room
The number of rooms under construction
demand and occupancy among the highest
are three times as many as the 10-year
in the nation, hotel developers are racing
average. They also represent an 81 percent
to make up ground. A record 2,192 rooms
increase over the peak of the previous
are scheduled for completion this year.
cycle for hotel construction.
This includes the 1,260-room Hyatt
Hotel Rooms by Completion Year
For those with announced completion dates
Completed
2010 408
Currently under construction
2011*
Land Use Issued
2012* Predevelopment
2013*
2014 119
2015 394
2016 158 The numbers next to each bar indicate the
total projects completed or scheduled for
2017 637 completion that year.
2018 2,192 *No hotel rooms completed from 2011–2013.
2019 236
2020 2,568
2021+ or TBD 1,935
JUNE 2018 DEVELOPMENT GUIDE 11Downtown is seeing
historically high levels
of construction
The number of projects currently
under construction downtown is
41 percent higher than the peak
number of projects during the
previous development cycle in 2008.
With some development statistics down year-over-year,
one might be tempted to call an end to the current Number of Projects Under Construction
development cycle. Construction will certainly reach
an apex at some point, but it is not clear we are there 2005 33
yet. With the number of projects currently under
32
construction, downtown Seattle will remain busy with
historically high levels of construction activity for at 2006 36
least the next two years. 42
2007 42
Last year, downtown development topped out at 74
51
projects. While down year-over-year, the number of
construction projects downtown is currently up to 65 2008 46
from 57 six months ago. It’s also above an apparent 44
peak at the end of 2014. One possibility for the 2009 40
appearance of peaks in 2014 and 2017 could be the 32
timing of significant legislation related to development. 2010 11
A framework for mandatory housing affordability
12
requirements applying to commercial and residential
development in downtown was proposed by the City of 2011 20
Seattle in 2015, with final legislation signed by the City 29
Council in 2017. This set into place height bonuses in 2012 37
exchange for the production of affordable housing 44
units, either onsite or with funds from a fee-in-lieu
2013 44
provided by developers.
45
Compared to the previous peak for each development 2014 50
category (office, residential, hotel, etc.) and 10-year 56
averages, it’s clear downtown’s level of construction is
2015 49
unusually high. All but three of the main metrics
tracked are significantly above the previous peak and
39
all are above their 10-year average. 2016 65
68
2017 74
57
2018 65
Q2 Q4
JUNE 2018 DEVELOPMENT GUIDE 12Comparison with Previous Peak
Under construction mid-year
Previous Cycle 2018 Mid-Year Previous Peak % from Peak
Peak Year
Apartment Units 2008 6,883 1,648 318%
Total Residential Units 2007 7,531 3,625 108%
Construction Costs 2008 $5.6 billion $3.1 billion 86%
(2018 dollars)
Hotel Rooms 2006 2,390 1,324 81%
Office (sq. ft.) 2009 6,459,000 4,000,000 61%
Total Projects 2008 65 46 41%
Retail (sq. ft.) 2005 383,328 596,000 -36%
Biotech/Medical (sq. ft.) 2008 584,000 1,208,000 -52%
Condominium Units 2007 648 2,272 -71%
Comparison with 10-year average
Under construction mid-year
Current (2018) 10-year Average Difference % from Average
from Average
Hotel Rooms 2,390 754 1,636 217%
Biotech/Medical (sq. ft.) 584,000 296,900 287,100 97%
Office (sq. ft.) 6,459,000 3,643,853 2,815,147 77%
Construction Costs $5.6 billion $3.4 billion $2.2 billion 65%
(2018 dollars)
Condominium Units 648 415 233 56%
Apartment Units 6,883 4,506 2,377 53%
Total Residential Units 7,531 4,920 2,611 53%
Total Projects 65 46 19.5 43%
Retail (sq. ft.) 383,328 287,515 95,813 33%
JUNE 2018 DEVELOPMENT GUIDE 13Numerous projects continue to work their way through the
development pipeline. In addition to the 65 projects under Number of Projects by Status
construction, seven are in the demolition, shoring and
excavation phase, 27 have land-use permits and an
Currently Under Construction 65
additional 125 projects are in the planning stages. More
than two-thirds of the 224 projects in the pipeline have a
planned completion date of 2020 or earlier. Some may Demolition, Shoring and 7
Excavation
adjust timelines due to the time it takes to secure permits
and other factors (including both regulatory barriers and Land Use Issued 27
economic cycles). Some of these projects may change as the
marketplace adjusts to the record levels of inventory Predevelopment 125
recently delivered. Even if some projects are delayed or
canceled this cycle, Seattle and downtown will continue to Total Pipeline 224
be a dynamic marketplace.
JUNE 2018 DEVELOPMENT GUIDE 14Conclusion
Historic investment in our center city’s tech companies, including Facebook,
core neighborhoods continues to drive Google and Apple are leveraging the local
a downtown boom. As of summer 2018, talent pool to rapidly expand. With 14
downtown has $5.6 billion worth of million square feet still in the pipeline,
building construction projects underway. downtown office construction appears
Developers are showing confidence in our poised for a continuing trend of historically
local economy, adding convention space, high levels of activity.
residential, commercial office and retail
space and the largest number of hotel Of all the categories explored in this
rooms under construction in a single year. report, the most unprecedented level of
construction is in hotels. A record number
With more people choosing to live near of rooms are expected to be completed
work and other amenities, residential this year. This is largely due to the new
construction continues to dominate Hyatt Regency Seattle, which will add
the current cycle. Almost two-thirds 1,260 rooms to downtown’s hotel inventory,
of buildings under construction have a making it the city’s largest hotel.
residential component. Most of these are
apartments. While the pace of residential Workers and residents are moving
construction slowed in the past year, it downtown for amenities only available
is still well above the historic average. in a healthy, vibrant urban core.
More than double the number of units Downtown provides access to jobs,
are under construction when compared convenient transportation options, and
to 2007 (the last peak for total residential recreational opportunities like shopping
units). With even more working their way and dining. Developers are responding
through permitting in the pipeline, the with an expansive building strategy that
current residential construction boom is is extending our economic growth. As
expected to continue. more people discover this amazing place
to live, work, shop and play, the boom
Development of office space continues will continue.
at a historically high rate. There are
currently 6.5 million square feet under With more employees, residents and
construction. This is 61 percent more than visitors downtown each year, it’s more
the office peak of the previous construction important than ever for investment in
cycle in 2008 and near the historic high downtown infrastructure and public space
of 7.1 million square feet of office space improvements such as light rail, more
under construction just three years ago. public spaces and parks, a bike network,
Downtown also makes a strong showing streetcar and a downtown school. If
against our peers across the nation. In 2017, Seattle continues to add 80 percent of new
downtown Seattle saw more office space residents into 20 percent of the residential
completed than any other central business land, those areas (including downtown)
district in the country. Amazon isn’t the need the amenities and infrastructure to
only source of growth, either. Other top support these populations.
JUNE 2018 DEVELOPMENT GUIDE 15Status of Downtown Development Projects
As of June 2018
BY PROJECT Completed Currently Under Demolition, Shoring Land Use Issued Predevelopment Total
CATEGORY January 2017–June 2018 Construction and Excavation
All Projects 58 65 7 27 125 282
Biotech/Medical 2 2 5 9
Cultural 2 6 3 11
Hotel 3 6 2 7 18
Hotel/Office 2 2
Hotel/Residential 1 3 16 20
Industrial 1 1
Mixed Use/ 2 1 3
Residential
Office 8 11 1 2 19 41
Office/Residential 1 3 1 4 9
Residential 40 33 6 16 67 162
Retail 1 2 3
Unknown / TBD 1 1
Transportation 1 1 2
BY SPACE USAGE Completed Currently Under Demolition, Shoring Land Use Issued Predevelopment Total
in 2017 Construction and Excavation
Apartment Units 6,429 6,883 2,938 3,288 14,790 34,328
Condo Units 123 648 352 299 851 2,273
Residential Units 736 1,294 2,030
(unknown type)
Hotel Rooms 1,154 2,390 925 3,099 7,568
Office (sq. ft.) 4,006,000 6,459,355 261,100 7,334,840 18,061,295
Biotech/Medical 584,000 250,000 860,509 1,694,509
(sq. ft.)
Retail (sq. ft.)* 182,490 383,328 199,514 147,507 512,866 1,425,705
*Most retail is a component of other project types (e.g. residential, office).
JUNE 2018 DEVELOPMENT GUIDE 16Notes on Criteria
Included in this report are downtown SOUTH
UPTOWN
Seattle projects with structural components
LAKE UNION
that have construction costs of $1 million or CAPITOL
more (occasional exceptions to this criteria HILL
are made for some high-profile projects). DENNY
Transportation projects are only included if TRIANGLE
BELLTOWN
they involve a building structure.
Infrastructure such as rail and roads are not
included. Parks and significant building WEST
renovations are included. EDGE
RETAIL
CORE FIRST
HILL
The geography used for this analysis is the
area within downtown Seattle. The
Downtown Seattle Association uses the WATERFRONT
following boundaries for downtown: South
Lake Union to the north to South Lander
PIONEER
Street to the south; Elliott Bay to the west SQUARE CHINATOWN-
INTERNATIONAL
and Broadway to the east. DISTRICT
SODO
Definitions of Development Project Status
Predevelopment Permit activity determines project status.
Project has no land-use or construction permits issued related to a Note that the criteria changed in 2016 to
allow for a more refined examination of
planned new building construction.
projects by status. In order to ensure
Land Use Issued accurate reporting, please contact DSA
before comparing this report’s numbers
Project has land-use permits issued but not building construction
to reports from previous years.
permits.
Demolition, Shoring and Excavation
Project has construction permits issued related to demolition or
shoring and excavation to prepare for construction of a new building.
Currently Under Construction
Project has building construction permits issued and passed
preconstruction and first ground disturbance inspections.
Completed
Final inspections related to the building permits are completed.
downtownseattle.org/devguide
JUNE 2018 DEVELOPMENT GUIDE 17You can also read