Preliminary risk analysis of 2019 novel coronavirus spread within and beyond China
←
→
Page content transcription
If your browser does not render page correctly, please read the page content below
January 25th, 2020 (Lunar New Year’s Day)

Preliminary risk analysis of 2019 novel coronavirus
spread within and beyond China

Shengjie Lai1*, Isaac I. Bogoch2, Alexander Watts3,4, Kamran Khan2,3,4, Zhongjie Li5,
Andrew Tatem1*

1
    WorldPop, School of Geography and Environmental Science, University of
Southampton, UK
2
    Department of Medicine, University of Toronto, Toronto, Canada
3
    Li Ka Shing Knowledge Institute, St. Michael's Hospital, Toronto, Canada
4
    Bluedot, Toronto, Canada
5
    Division of Infectious Diseases, Chinese Centre for Disease Control and Prevention

*Email: Shengjie.Lai@soton.ac.uk; A.J.Tatem@soton.ac.uk

As of January 25th, 2020 (Beijing time), China has reported 1409 confirmed cases,
2032 suspected cases, and 42 deaths of 2019 Novel Coronavirus (2019-nCoV)
infections, with most reported from Wuhan city, Hubei Province [1-3]. Nearly all
provinces have confirmed imported cases from Wuhan and secondary transmission
has been reported in some provinces. The spread of the virus could have been
exacerbated by the surge in domestic travel during the 40-day Lunar New Year
celebrations (from 10 January to 18 February 2020) – the largest annual human
migration in the world, comprised of hundreds of millions of people travelling across
the country.

We used de-identified and aggregated domestic population movement data from
2013 to 2015, derived from Baidu Location-Based Services (LBS) [4], and
international air travel data in 2018, obtained from the International Air Transport
Association (IATA) [5], to explore patterns of mobility of travellers from Wuhan to
other cities in China, and inform the risk of 2019-nCoV spreading across and beyond
the country during the Lunar New Year migration.

                                            1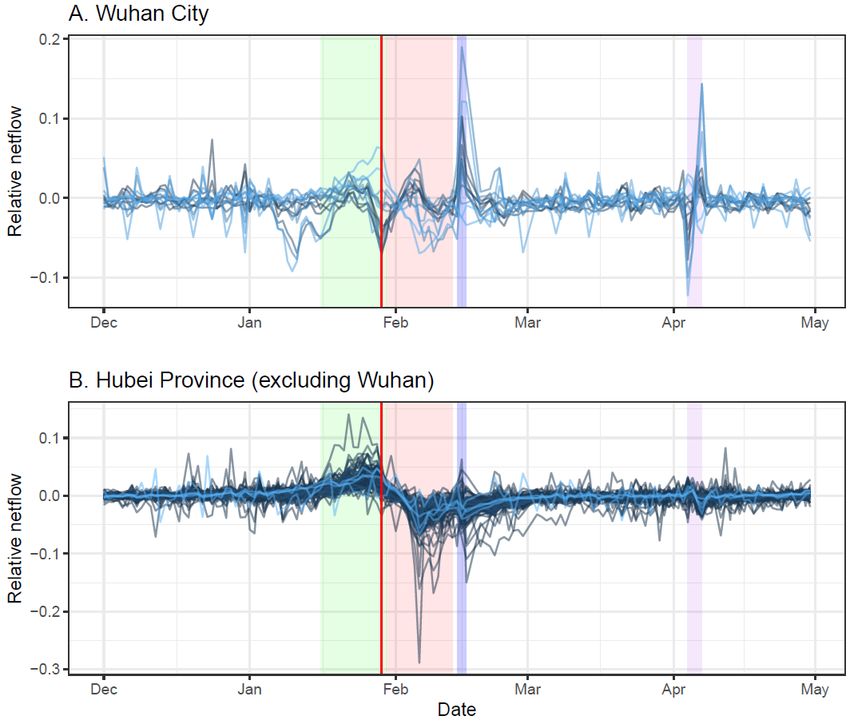
Using the 2013-2015 LBS data, we found that a large number of travellers were
likely departing Wuhan into neighbouring cities and other megacities in China before
Lunar New Year (Figures 1-3 and Tables 1-3). There was a high correlation between
the number of imported cases and the risk of importation via travellers from Wuhan
within the two weeks before Lunar New Year’s Day (Figure 4). Further, a high
proportion of cases travelled with symptoms at the early stage of the outbreak.
Although a cordon sanitaire of Wuhan and some cities in Hubei Province has been in
place since January 23rd, 2020, the timing of this may have occurred during the latter
stages of peak population numbers leaving Wuhan (Figure 1). Should secondary
outbreaks occur in the cities and provinces that receive high volumes of travellers
from Wuhan, e.g. Beijing, Shanghai, and Guangzhou, these could contribute to
further spread of infection to other highly connected cities within China via movement
after the 7-day public holiday (Figures 5-7). Additionally, based on historical air travel
data, the connectivity between high-risk cities in China and other countries was
defined for the three months around Lunar New Year holiday (Tables 4 and 5). We
have initially focussed on specific destination cities in Africa due to the weak
surveillance and health systems of this vulnerability region (Tables 6-7 and Figures
8-9), but will expand similar assessments to the rest of the World.

Given the current epidemic and limited understanding of the epidemiology of this
disease, our findings of travel patterns from historical data could help contribute to
tailoring public health interventions. However, it is important to highlight that our
analysis assumes “business as usual” travel based on previous non-outbreak years
and we are currently in unprecedented territory, with likely significant changes to
human travel behaviours across China. We are closely monitoring the epidemic, and
further analyses will be conducted to estimate the risk of onward domestic and
international spread of the virus during the Lunar New Year and the next few
months. Moreover, we will also attempt to evaluate the effectiveness of the transport
lockdown in Chinese cities, and the impact of movements of people returning from
holiday on the transmission of the 2019-nCoV virus.

                                            2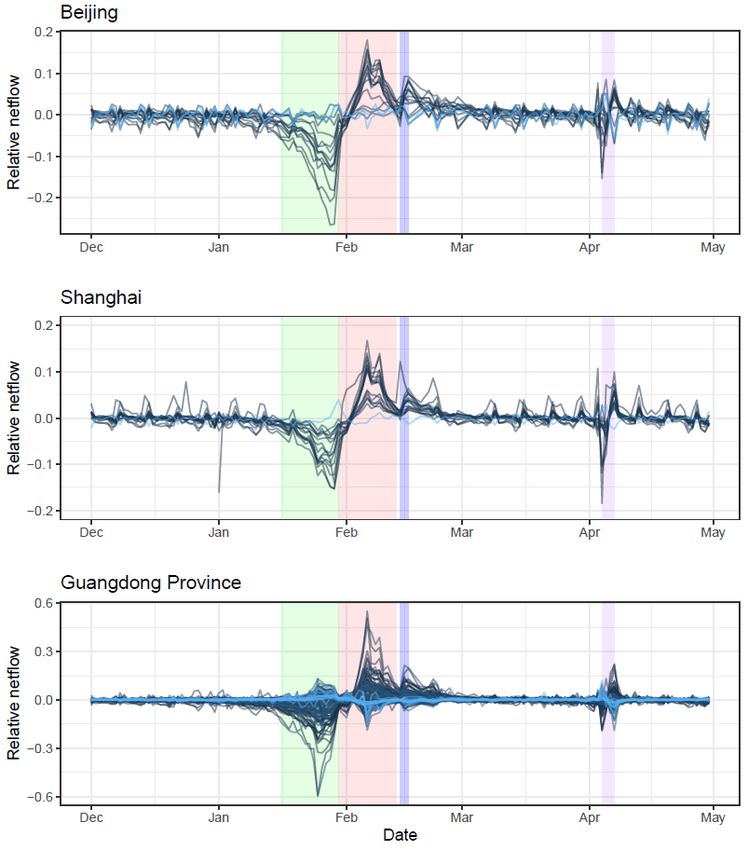
Reference
 1. Zhu N, et al. (2020) A Novel Coronavirus from Patients with Pneumonia in China, 2019. N Engl
     J Med. DOI: 10.1056/NEJMoa2001017
 2. Chan J, et al. (2020) A familial cluster of pneumonia associated with the 2019 novel coronavirus
     indicating person-to-person transmission: a study of a family cluster. Lancet. DOI:
     10.1016/S0140-6736(20)30154-9
 3. Huang C, et al. (2020) Clinical features of patients infected with 2019 novel coronavirus in
     Wuhan, China. Lancet. DOI: 10.1016/S0140-6736(20)30183-5
 4. Baidu Migration. http://qianxi.baidu.com/
 5. Bogoch I, et al. (2020) Pneumonia of Unknown Etiology in Wuhan, China: Potential for
     International Spread Via Commercial Air Travel. Journal of Travel Medicine, taaa008,
     https://doi.org/10.1093/jtm/taaa008

                                                  3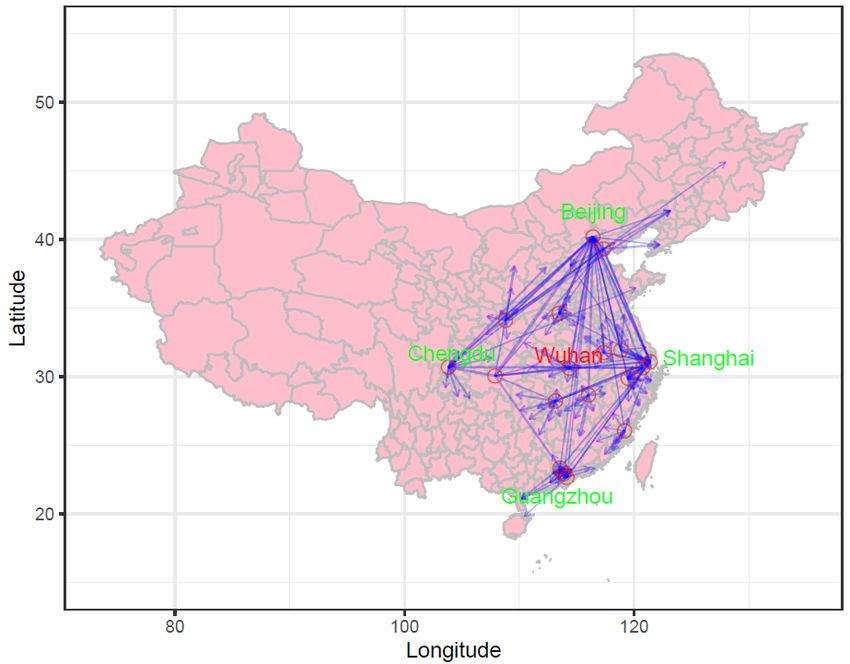
Section I. Domestic Travel
Figure 1. Patterns of daily human movement by county in Wuhan City
and Hubei Province across six months.
Shadow colours:
Green: 2 weeks before Lunar New Year’s Day;
Red: 2 weeks since Lunar New Year’s Day;
Purple: Lantern Festival;
Pink: Tomb Sweeping Day;
Red line: Lockdown day of cities in Hubei.
Relative netflow = (Inflow – Outflow)/population, based on the population movement
data in 2013-2014 from Baidu, Inc.
4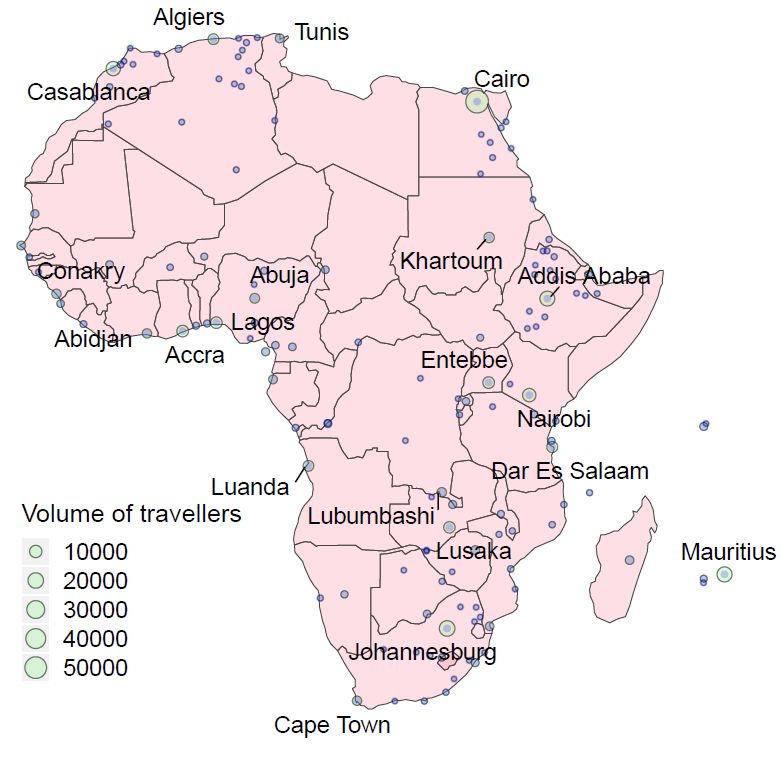
Table 1. Top 30 ranked cities in mainland China receiving travellers from
Wuhan during the two weeks before Lunar New Year’s Day.
  Rank                     City      Population (million)*         Province    Volume (%)**

      1               Jingzhou                         5.7            Hubei           7.26
      2               Xiangfan                         5.6            Hubei           7.11
      3               Xianning                         2.5            Hubei           6.17
      4                  Beijing                     21.7            Beijing          6.10
      5            Huanggang                           6.3            Hubei           5.94
      6                Yichang                         4.1            Hubei           5.86
      7               Huangshi                         2.5            Hubei           5.18
      8                Xiaogan                         4.9            Hubei           4.73
      9          Sheng Zhixia                          3.5            Hubei           4.62
     10                  Shiyan                        3.4            Hubei           4.14
     11               Shanghai                       24.2         Shanghai            3.52
     12                   Enshi                        3.3            Hubei           3.51
     13                Jingmen                         2.9            Hubei           3.06
     14                Suizhou                         2.2            Hubei           2.49
     15            Guangzhou                         14.0       Guangdong             2.45
     16             Zhengzhou                          9.6           Henan            2.22
     17                   Ezhou                        1.1            Hubei           1.93
     18                  Tianjin                     15.6            Tianjin          1.56
     19                  Jiaxing                       4.6         Zhejiang           1.25
     20              Hangzhou                          9.0         Zhejiang           1.23
     21              Changsha                          7.6           Hunan            1.13
     22                    Xi'an                       8.3         Shaanxi            1.02
     23                 Nanjing                        8.3          Jiangsu           0.97
     24              Shenzhen                        10.2       Guangdong             0.96
     25             Chongqing                        30.9        Chongqing            0.82
     26                 Fuzhou                         7.6            Fujian          0.58
     27              Nanchang                          5.4           Jiangxi          0.57
     28               Chengdu                        14.3          Sichuan            0.56
     29                    Hefei                       7.9            Anhui           0.52
     30              Dongguan                          8.3      Guangdong             0.45
                           Other                   1115.8                            12.09
                           Total                   1371.5                           100.00
* 2016 population, National Bureau of Statistics, P.R. China.
** Percentage of travellers leaving Wuhan city within 2 weeks before the Lunar New Year in
2014 and 2015. Data were obtained from Baidu, Inc., a Chinese technology company
specializing in Internet-related and location-based services with nearly 9 billion location
requests each day.

                                              5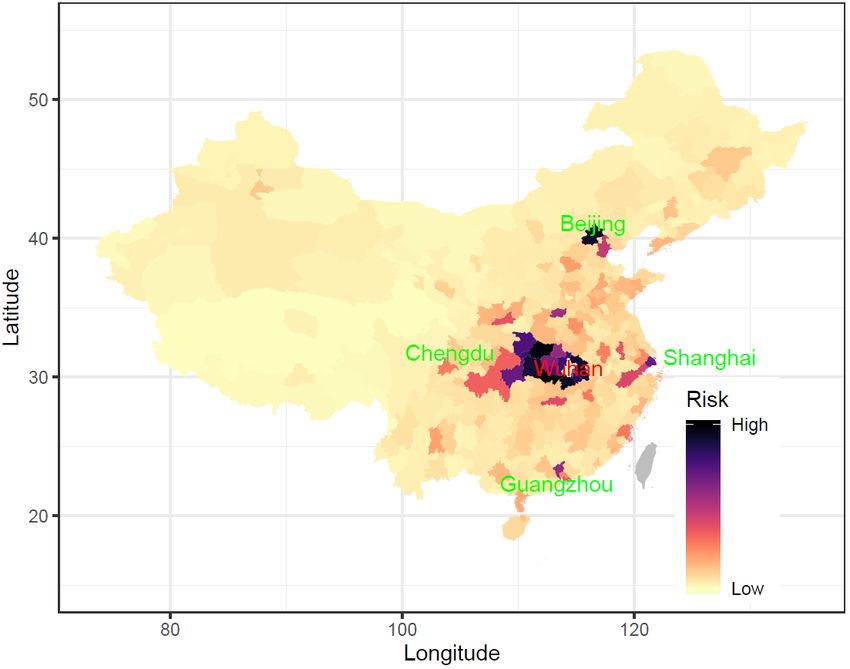
Table 2. Top 30 ranked cities in mainland China receiving travellers from
Wuhan during the two weeks since Lunar New Year’s Day.
  Rank                    City      Population (million)*           Province Volume (%)**
      1              Yichang                         4.1              Hubei             7.48
      2             Jingzhou                         5.7              Hubei             6.65
      3             Xiangfan                         5.6              Hubei             6.48
      4           Huanggang                          6.3              Hubei             5.91
      5                Beijing                      21.7             Beijing            5.56
      6              Xiaogan                         4.9              Hubei             5.16
      7             Xianning                         2.5              Hubei             4.25
      8         Sheng Zhixia                         3.5              Hubei             4.22
      9             Shanghai                        24.2          Shanghai              3.97
     10                Shiyan                        3.4              Hubei             3.89
     11              Jingmen                         2.9              Hubei             3.51
     12             Huangshi                         2.5              Hubei             3.46
     13           Guangzhou                         14.0         Guangdong              3.07
     14                 Enshi                        3.3              Hubei             3.01
     15              Suizhou                         2.2              Hubei             2.50
     16                 Ezhou                        1.1              Hubei             2.26
     17           Zhengzhou                          9.6             Henan              2.13
     18            Changsha                          7.6             Hunan              1.78
     19                Tianjin                      15.6             Tianjin            1.65
     20            Shenzhen                         10.2         Guangdong              1.24
     21                  Xi'an                       8.3            Shaanxi             1.24
     22               Nanjing                        8.3            Jiangsu             1.13
     23            Hangzhou                          9.0           Zhejiang             1.12
     24                Jiaxing                       4.6           Zhejiang             1.04
     25            Nanchang                          5.4             Jiangxi            0.83
     26            Chongqing                        30.9         Chongqing              0.82
     27               Fuzhou                         7.6              Fujian            0.82
     28                  Hefei                       7.9              Anhui             0.78
     29               Suzhou                        10.6            Jiangsu             0.51
     30            Dongguan                          8.3         Guangdong              0.47
                         Other                    1119.5                               13.04
                         Total                    1371.5                              100.00
* 2016 population, National Bureau of Statistics, P.R. China.
** Percentage of travellers leaving Wuhan city within 2 weeks since the first day of the Lunar
New Year in 2014 and 2015. Data were obtained from Baidu, Inc., a Chinese technology
company specializing in Internet-related and location-based services with nearly 9 billion
location requests each day.

                                              6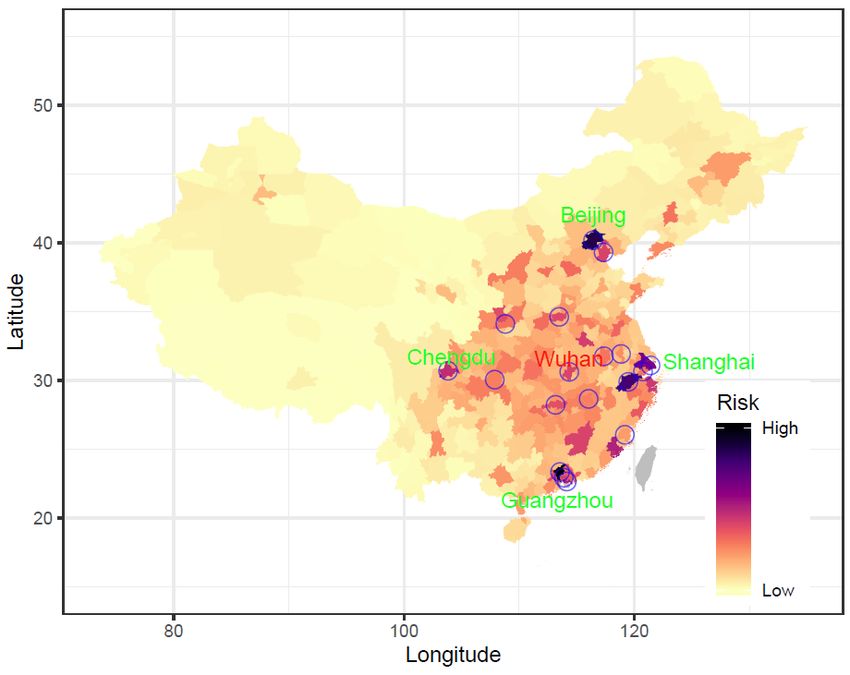
Table 3. The rank of provinces in mainland China receiving travellers
    from Wuhan city around Lunar New Year’s Day.

           Within 2 weeks before Lunar New Year           Within 2 weeks since Lunar New Year
                 Province*     Population      Volume           Province*      Population    Volume
Rank                             (million) a     (%) b                          (million) a     (%) b
   1                 Beijing           21.5     16.07              Beijing            21.5     13.50
   2            Guangdong            113.5      12.19         Guangdong             113.5      13.32
   3                 Henan             96.1       9.48          Shanghai              24.2       9.64
   4              Shanghai             24.2       9.25             Henan              96.1       7.95
   5               Zhejiang            57.4       8.19           Zhejiang             57.4       7.22
   6                Jiangsu            80.5       5.51            Jiangsu             80.5       6.81
   7                 Hunan             69.0       4.80             Hunan              69.0       6.29
   8               Shaanxi             38.6       4.54            Shaanxi             38.6       4.98
   9                 Tianjin           15.6       4.11             Tianjin            15.6       4.00
  10             Shandong            100.5        3.66         Shandong             100.5        3.89
  11               Sichuan             83.4       3.13              Fujian            39.4       3.70
  12                 Jiangxi           46.5       2.75              Anhui             63.2       3.27
  13                  Fujian           39.4       2.72             Jiangxi            46.5       2.90
  14                  Anhui            63.2       2.62            Sichuan             83.4       2.13
  15            Chongqing              31.0       2.15         Chongqing              31.0       2.00
  16                  Hebei            75.6       1.94              Hebei             75.6       1.74
  17                Yunnan             48.3       1.22           Liaoning             43.6       1.21
  18               Guangxi             49.3       1.10            Yunnan              48.3       1.08
  19               Liaoning            43.6       1.06           Guangxi              49.3       1.00
  20                 Hainan             9.3       0.58             Shanxi             37.2       0.62
  21                 Shanxi            37.2       0.54             Hainan              9.3       0.48
  22               Guizhou             36.0       0.47           Guizhou              36.0       0.46
  23           Heilongjiang            37.7       0.40       Heilongjiang             37.7       0.41
  24               Xinjiang            24.9       0.40            Xinjiang            24.9       0.33
  25                 Gansu             26.4       0.32                 Jilin          27.0       0.31
  26                    Jilin          27.0       0.31             Gansu              26.4       0.26
  27        Inner Mongolia             25.3       0.29     Inner Mongolia             25.3       0.25
  28                Ningxia             6.9       0.11            Ningxia              6.9       0.11
  29                Qinghai             6.0       0.07            Qinghai              6.0       0.10
  30                   Tibet            3.4       0.03               Tibet             3.4       0.03
    * All provinces except Tibet and Qinghai have reported imported or local confirmed cases, as
    of 08:20 on January 25th, 2020 (Beijing time).
    a   2016 population, National Bureau of Statistics, P.R. China.
    b Percentage of travellers leaving Wuhan city within 2 weeks since the first day of the Lunar
    New Year in 2014 and 2015. Data were obtained from Baidu, Inc., a Chinese technology
    company specializing in Internet-related and location-based services with nearly 9 billion
    location requests each day.

                                                    7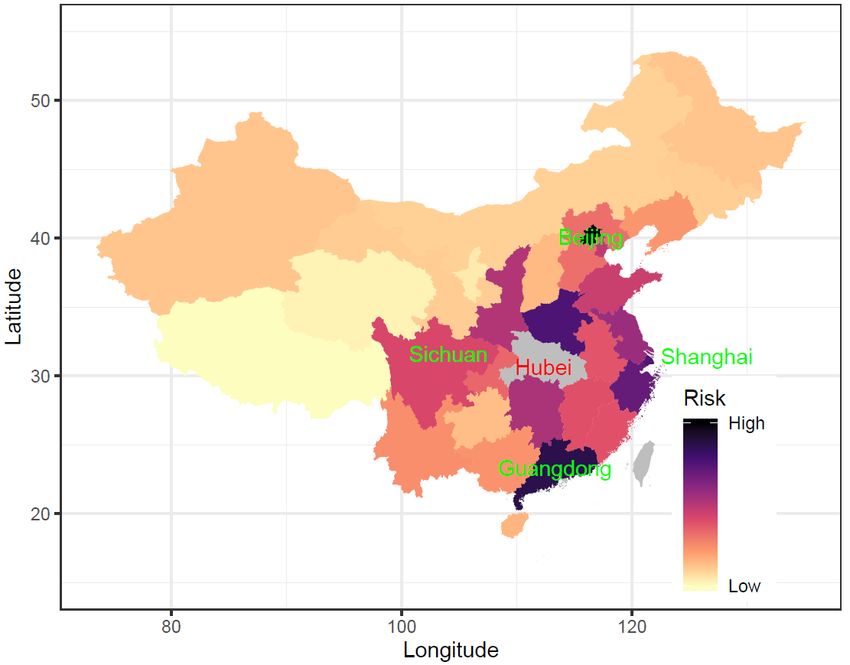
Figure 2. Risk of cities in mainland China receiving travellers with 2019-
nCoV infections from Wuhan during the Lunar New Year migration.
The risk of importation at city level was preliminarily defined as the percentage of
travellers received by each city out of the total volume of travellers leaving Wuhan
within 2 weeks before and since the first day of Lunar New Year, based on the
population movement data from Baidu, Inc.

                                           8
Figure 3. Risk of provinces in mainland China receiving travellers with
2019-nCoV infections from Wuhan during the Lunar New Year migration.
The risk of importation at provincial level was preliminarily defined as the percentage
of travellers received by each province out of the total volume of travellers leaving
Wuhan within 2 weeks before and since the first day of Lunar New Year, based on
the population movement data from Baidu, Inc.
9Figure 4. Time distributions of imported cases and correlation between
the number of imported cases and the risk of importation via travellers
from Wuhan within the two weeks before Lunar New Year’s Day.
(A)-(C) The time distribution of imported cases travelling from Wuhan, illness onset,
admission to hospital, and diagnosis by province. (D) correlation between the
number of imported cases reported in each province and the risk of importation via
travellers. The risk of importation at provincial level was preliminarily defined as the
percentage of travellers received by each province out of the total volume of
travellers leaving Wuhan within 2 weeks before and since the first day of Lunar New
Year, based on the population movement data from Baidu, Inc. The data on cases
as of January 24th, 2020, were obtained from the websites of Chinese National and
Local Health Commissions.
10Figure 5. Patterns of daily human movement by county in Beijing,
Shanghai, and Guangdong Province across six months.
Shadow colours:
Green: 2 weeks before Lunar New Year;
Red: 2 weeks since Lunar New Year;
Purple: Lantern Festival;
Pink: Tomb Sweeping Day
Relative netflow = (Inflow – Outflow)/population, based on the population movement
data in 2013-2014 from Baidu, Inc.
11Figure 6. Risk of cities in mainland China receiving travellers from 18
high-risk cities (blue circles) with 2019-nCoV infections or importations
during the next four weeks since Lunar New Year’s Day.
The risk of importation at city level was preliminarily defined as the averaged
percentage of travellers received by each city out of the total volume of travellers
leaving each high-risk city, based on the population movement data from Baidu, Inc.
18 high-risk cities include Wuhan and other 17 cities in other provinces receiving
high volume of travellers from Wuhan before the Lunar New Year: Beijing, Shanghai,
Guangzhou, Zhengzhou, Tianjin, Hangzhou, Jiaxing, Changsha, Xi’an, Nanjing,
Shenzhen, Chongqing, Nanchang, Chengdu, Hefei, Fuzhou, Dongguan.
12Figure 7. Estimated connectivity of cities in mainland China receiving
travellers from 18 high-risk cities (blue circles) with 2019-nCoV infections
or importations during the four weeks following Lunar New Year’s Day.
The arrows show the link and direction of the risk of importation at city level,
preliminarily defined as the percentage of travellers received by each city (top 10
ranked cities) out of the total volume of travellers leaving each high-risk city (18
cities), based on the population movement data from Baidu, Inc.
18 high-risk cities: Wuhan in Wuhan Province and 17 cities (Beijing, Shanghai,
Guangzhou, Zhengzhou, Tianjin, Hangzhou, Jiaxing, Changsha, Xi’an, Nanjing,
Shenzhen, Chongqing, Nanchang, Chengdu, Hefei, Fuzhou, Dongguan) in other
provinces receiving high volume of travellers from Wuhan before the Lunar New
Year.
13Section II. International Travel
Table 4. Top 30 ranked cities across the globe receiving airline travellers
from 18 high-risk cities (Figure 6) in mainland China over a period of
three months, representing 15 days before Lunar New Year’s Day and 2
and half months following Lunar New Year’s Day.
Rank City Country/region Volume (in thousands) Risk (%)*
1 Bangkok Thailand 1062.9 7.86
2 Hong Kong Hong Kong SAR, China 1001.7 7.41
3 Taipei Taiwan, China 857.5 6.34
4 Seoul South Korea 757.9 5.61
5 Tokyo Japan 714.3 5.28
6 Singapore Singapore 568.1 4.20
7 Phuket Thailand 492.8 3.65
8 Osaka Japan 434.1 3.21
9 Kuala Lumpur Malaysia 382.7 2.83
10 Macau Macau SAR, China 260.4 1.93
11 Denpasar Bali Indonesia 222.2 1.64
12 Sydney Australia 207.4 1.53
13 Chiang Mai Thailand 156.9 1.16
14 Melbourne Australia 154.5 1.14
15 Los Angeles United States 154.5 1.14
16 New York United States 145.9 1.08
17 Dubai United Arab Emirates 144.9 1.07
18 Nha Trang Viet Nam 143 1.06
19 London United Kingdom 142.1 1.05
20 Ho Chi Minh City Viet Nam 142 1.05
21 Nagoya Japan 140.1 1.04
22 Kota Kinabalu Malaysia 130.4 0.96
23 Phnom Penh Cambodia 127.5 0.94
24 Krabi Thailand 125.2 0.93
25 Manila Philippines 121.9 0.90
26 Siem Reap Cambodia 121.4 0.90
27 Paris France 119.5 0.88
28 Jakarta Indonesia 113.9 0.84
29 Kaohsiung Taiwan 107.6 0.80
30 Frankfurt Germany 103.3 0.76
Other 4158.2 30.77
Total 13514.9 100
*Relative risk was preliminary defined as the percentage of airline travellers received by
each city out of the total volume of travellers leaving high-risk cities (18 cities), based on air
14travel data from February to April 2018, obtained from the International Air Travel
Association (IATA).The Lunar New Year in 2018 started from February 16th, 2018.
Table 5. Top 30 ranked countries or regions receiving airline travellers
from 18 high-risk cities (Figure 6) in mainland China over a period of
three months, representing 15 days before Lunar New Year’s Day and 2
and half months following Lunar New Year’s Day.
Rank Country/region Volume (in thousands) Risk *
1 Thailand 2031.9 15.03
2 Japan 1563.3 11.57
3 Hong Kong SAR, China 1001.7 7.41
4 Taiwan, China 979.7 7.25
5 South Korea 936.6 6.93
6 United States 773.3 5.72
7 Malaysia 634.3 4.69
8 Singapore 568.1 4.20
9 Viet Nam 468.4 3.47
10 Australia 455.6 3.37
11 Indonesia 412.5 3.05
12 Cambodia 262.9 1.95
13 Macao SAR, China 260.4 1.93
14 Philippines 250.3 1.85
15 Germany 234.9 1.74
16 Canada 208.5 1.54
17 United Kingdom 190.7 1.41
18 United Arab Emirates 162.3 1.20
19 Italy 152.9 1.13
20 Russia 151.3 1.12
21 France 137.9 1.02
22 New Zealand 120.7 0.89
23 India 106.7 0.79
24 Spain 105.8 0.78
25 Turkey 66.5 0.49
26 Egypt 57.5 0.43
27 Sri Lanka 55.7 0.41
28 Maldives 50.7 0.37
29 Netherlands 44.9 0.33
30 Myanmar 43.3 0.32
Other 1025.6 7.59
Total 13514.9 100
*Relative risk was preliminary defined as the percentage of airline travellers received by
each city out of the total volume of travellers leaving high-risk cities (18 cities), based on air
travel data from February to April 2018, obtained from the International Air Travel
Association (IATA). The Lunar New Year in 2018 started from February 16th, 2018.
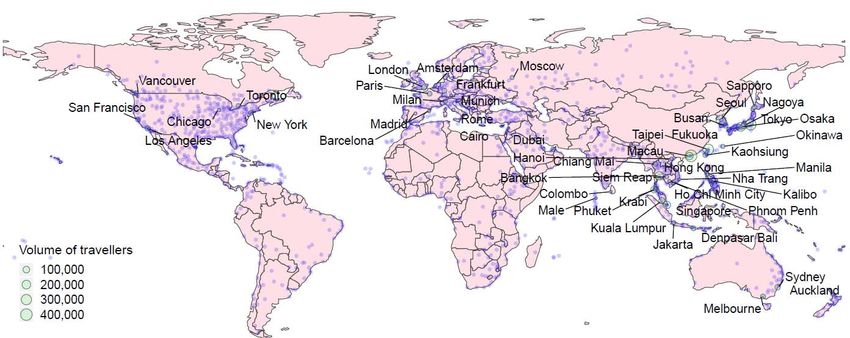
15Figure 8. Geographic distribution of cities across the globe receiving airline travellers from 18 high-risk cities
(Figure 6) in mainland China over a period of three months, representing 15 days before Lunar New Year’s Day
and 2 and half months following Lunar New Year’s Day. The volume of airline travellers of the top 30 ranked
cities is presented.
Based on air travel data from February to April 2018, obtained from the International Air Travel Association (IATA). The Lunar New
Year in 2018 started from February 16th, 2018.
16Table 6. Top 30 ranked cities in Africa receiving airline travellers from 18
high-risk cities (Figure 6) in mainland China over a period of three
months, representing 15 days before Lunar New Year’s Day and 2 and
half months following Lunar New Year’s Day.
Rank City Country/region Volume %*
1 Cairo Egypt 56735 20.49
2 Johannesburg South Africa 20530 7.42
3 Mauritius Mauritius 18297 6.61
4 Addis Ababa Ethiopia 17882 6.46
5 Casablanca Morocco 15787 5.70
6 Nairobi Kenya 12859 4.64
7 Entebbe Uganda 8246 2.98
8 Accra Ghana 8211 2.97
9 Lagos Nigeria 8087 2.92
10 Lusaka Zambia 7672 2.77
11 Dar Es Salaam Tanzania 6769 2.44
12 Algiers Algeria 6074 2.19
13 Luanda Angola 5994 2.16
14 Khartoum Sudan 5412 1.95
15 Abuja Nigeria 4193 1.51
16 Lubumbashi Congo (Kinshasa) 3546 1.28
17 Abidjan Cote D'Ivoire 3511 1.27
18 Cape Town South Africa 3461 1.25
19 Conakry Guinea 3455 1.25
20 Tunis Tunisia 2912 1.05
21 Libreville Gabon 2786 1.01
22 Harare Zimbabwe 2665 0.96
23 Dakar Senegal 2659 0.96
24 Maputo Mozambique 2560 0.92
25 Antananarivo Madagascar 2515 0.91
26 Nouakchott Mauritania 1955 0.71
27 Malabo Equatorial Guinea 1864 0.67
28 Mahe Island Seychelles 1850 0.67
29 Durban South Africa 1815 0.66
30 Ndola Zambia 1796 0.65
*The percentage of airline travellers received by each city in Africa out of the total volume of
travellers leaving high-risk cities (18 cities) into Africa, based on air travel data from February
to April 2018, obtained from the International Air Travel Association (IATA). The Lunar New
Year in 2018 started from February 16th, 2018.
17Table 7. African countries or territories receiving airline travellers from
18 high-risk cities (Figure 6) in mainland China over a period of three
months, representing 15 days before Lunar New Year’s Day and 2 and
half months following Lunar New Year’s Day.
Rank Country/region Volume %* Rank Country/region Volume %*
1 Egypt 57516 20.77 27 Seychelles 1863 0.67
2 South Africa 26405 9.54 28 Botswana 1627 0.59
3 Ethiopia 18393 6.64 29 Djibouti 1602 0.58
4 Mauritius 18297 6.61 30 Mali 1587 0.57
5 Morocco 16974 6.13 31 Congo (Brazzaville) 1500 0.54
6 Nigeria 13734 4.96 32 Chad 1425 0.51
7 Kenya 13185 4.76 33 Rwanda 1386 0.50
8 Zambia 9471 3.42 34 Sierra Leone 1330 0.48
9 Tanzania 8388 3.03 35 Namibia 1207 0.44
10 Uganda 8246 2.98 36 Malawi 1139 0.41
11 Ghana 8211 2.97 37 Benin 890 0.32
12 Algeria 7887 2.85 38 Togo 858 0.31
13 Angola 5994 2.16 39 Lesotho 853 0.31
14 Sudan 5433 1.96 40 Reunion 809 0.29
15 Congo (Kinshasa) 5248 1.90 41 Niger 790 0.29
16 Mozambique 3928 1.42 42 Liberia 711 0.26
17 Cote D'Ivoire 3511 1.27 43 South Sudan 711 0.26
18 Guinea 3455 1.25 44 Burkina Faso 406 0.15
19 Tunisia 2912 1.05 45 Gambia 365 0.13
20 Gabon 2786 1.01 46 Central African Rep 339 0.12
21 Cameroon 2734 0.99 47 Cape Verde 276 0.10
22 Zimbabwe 2716 0.98 48 Eritrea 246 0.09
23 Senegal 2659 0.96 49 Burundi 232 0.08
24 Madagascar 2515 0.91 50 Comoros 178 0.06
25 Mauritania 1955 0.71 51 Somalia 68 0.02
26 Equatorial Guinea 1864 0.67 52 Guinea-Bissau 52 0.02
*The percentage of airline travellers received by each city in Africa out of the total volume of
travellers leaving high-risk cities (18 cities) into Africa, based on air travel data from February
to April 2018, obtained from the International Air Travel Association (IATA).The Lunar New
Year in 2018 started from February 16th, 2018.
18Figure 9. Geographic distribution of African cities receiving airline
travellers from 18 high-risk cities (Figure 6) in mainland China over a
period of three months, representing 15 days before Lunar New Year’s
Day and 2 and half months following Lunar New Year’s Day.
Based on air travel data from February to April 2018, obtained from the International
Air Travel Association (IATA). The Lunar New Year in 2018 started from February
16th, 2018.
19About WorldPop
WorldPop (www.worldpop.org) at the University of Southampton works to ensure that
everyone is mapped and counted in decision making. Initiated in 2005, WorldPop develops
geospatial integration methods for the production of spatially detailed demographic datasets
in resource poor settings, with academic peer-review and publication of outputs. The group is
a producer of open spatial demographic datasets used by governments, international
agencies, academia, NGOs and the private sector. Close collaboration with UN agencies and
national statistical offices in low/middle income countries is a primary focus, ensuring that
research approaches are designed to maximise uptake and impact, with local capacity
strengthening a priority.
Major focus areas for development and implementation cover population distributions,
demographics and dynamics in resource-poor settings. The integration of traditional
demographic datasets from censuses and surveys with satellite, cellphone and other spatial
datasets is undertaken in geostatistical modelling frameworks. Outputs include high resolution
maps of population counts, age/sex structures, births, pregnancies, poverty, reproductive,
maternal and newborn health indicators, access to services, and vaccination coverage, among
other metrics. Moreover, modelling frameworks for the development of population mobility
maps, subnational migration flows, urban change and disease spread are developed.
WorldPop is made up of 30+ members of staff, including demographers, geographers,
ecologists, statisticians, epidemiologists and computer scientists. Principal funders and
collaborators include the Bill and Melinda Gates Foundation, UK Department for International
Development, the World Bank, the Wellcome Trust, UNFPA, UNICEF, WHO and the Clinton
Health Access Initiative.
20You can also read