Belgium's economy in a nutshell - Economic outlook of January 2019 - Economie.fgov
←
→
Page content transcription
If your browser does not render page correctly, please read the page content below
Titre brochure

Belgium’s economy
in a nutshell

Economic outlook of January 2019

FPS Economy, S.M.E., Self Employed and Energy                                 January 2019
Direction générale des Analyses économiques et de l’Economie internationale
Service Conjoncture et Développements sectoriels
Contents

    Introduction ............................................................................................................................................ 3
    1.     Belgium at a glance ........................................................................................................................ 4
    2.     Cyclical developments in the economy .......................................................................................... 8
    3.     Foreign Trade – Overview of Trade Flows ................................................................................... 16
    4.     The place of Belgium compared to the European Union ............................................................ 19
    5.     Macroeconomic forecasts ............................................................................................................ 23

    List of tables
    Table 1. Belgian share in EU exports and imports ................................................................................ 5
    Table 2. Share of national exports in world exports ............................................................................ 16
    Table 3. The share of Belgian exports going to the main geographical areas of the world ............. 16
    Table 4. GDP growth forecasts in the international environment ...................................................... 23
    Table 5. GDP growth forecasts in Belgium .......................................................................................... 23

    List of graphs

2   Graph 1. Competitiveness & digital rankings............................................................................................ 4
    Graph 2. Breakdown of the Belgian industry in 2017 ............................................................................ 6
    Graph 3. GDP per capita in PPS in 2017 ................................................................................................. 7
    Graph 4. GDP evolution in % and contribution of the different components “expenditures concept” 8
    Graph 5. Foreign trade according to the national concept ................................................................... 9
    Graph 6. GDP in % and contribution of the different components “production concept”. ................ 10
    Graph 7. Industrial production indices ................................................................................................. 11
    Graph 8. Business demography in Belgium......................................................................................... 12
    Graph 9. Employment rate and harmonized unemployment .............................................................. 13
    Graph 10. Number of unemployed jobseekers (UJS) .......................................................................... 14
    Graph 11. Harmonized consumer price index (HICP) evolution (in %) and contribution to inflation of
    the 5 major product groups .................................................................................................................. 15
    Graph 12. Most important export partners in 2017 ............................................................................. 17
    Graph 13. Most important import partners in 2017 ............................................................................. 17
    Graph 14. Breakdown of Belgian exports in 2017................................................................................ 18
    Graph 15. GDP in Belgium, the European Union and the euro area................................................... 19
    Graph 16. Production index in the industry and in the construction .................................................. 20
    Graph 17. Population and employment rate ........................................................................................ 20
    Graph 18. Unemployment rate ............................................................................................................. 21
    Graph 19. Inflation ................................................................................................................................. 22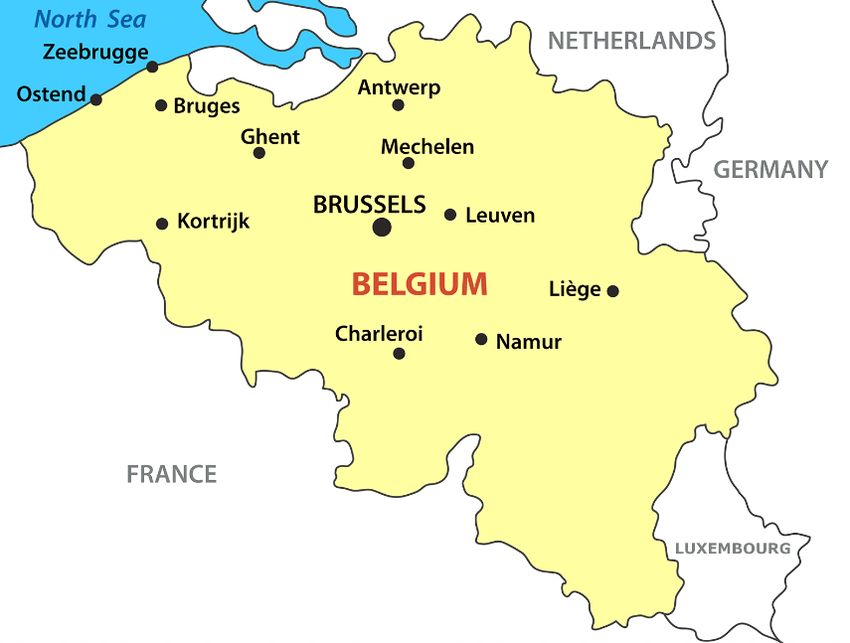
“Creating the conditions for a competitive, sustainable and balanced operation of the goods and services
market in Belgium.”

Introduction
Belgium, a small and open economy of 11.4 million inhabitants, is located in the heart of
Europe. The economy benefits from a strong communication infrastructure and a highly
qualified workforce. Nevertheless, foreign trade is essential for Belgium. Moreover, the
share of Belgian exports in the European Union exports to other European members amount
to 8.2 %, and to 5.7 % for countries outside the European Union. It is also important to note
that approximately 70 % of Belgian exports are intended for the European Union market. The
most significant trade partners for Belgium are its neighboring countries, namely Germany,
France and the Netherlands. Yet, its trade balance was negative in 2017.

In 2017, the products mainly exported by Belgian companies concerned the chemical
industries, as well as vehicles and transport equipment and finally machinery and equip-
ment.

At the same time, the chemical industry was the main value added creator, followed by
food and beverages and the pharmaceutical industry.

Recent cyclical developments indicate that GDP growth was relatively good in 2017 (1.7 %
year-on-year, compared to 1.5 % the previous year), thanks to a strong domestic demand
(excluding inventories changes) and more precisely, private consumption. However, GDP
growth was less robust in Belgium than in the European Union (2.4 %) or even in the Euro
area (2.3 %). Furthermore, during the third quarter of 2018, net exports were the main driv-
er of GDP growth.
                                                                                                           3
In 2017, GDP growth is almost entirely due to services activity, steadily increasing since 2014.

The production index in the manufacturing industry continued to rise during the first nine
months of 2018 as it did in 2017. The same trend is observed for the production in the con-
struction sector, albeit at a slower pace.

Business demography was also vigorous in 2017, even if it was less dynamic than in 2016,
with more creations than deletions, resulting in a better entrepreneurial dynamism.

Therefore, the employment rate rose up in 2017 while the unemployment rate decreased.
Despite this favorable development, progress still need to be done to reach Belgian Europe
2020 employment rate target of 73.2 % in 2020. This target amounts to 75 % in 2020 for the
European Union.

Finally, since many years, consumer prices have risen at a faster rate in Belgium than in its
main trading partners.

As regards the near-term growth prospects for Belgium, the National Accounts Institute
(NAI) forecasts a deceleration in GDP growth to 1.4 % in 2018 and 1.3 % in 2019, after 1.7 % in
2017, according to the economic budget published in February 2019.
1. Belgium at a glance
    Belgium is one of the six founding countries of the European Union. Located in the heart
    of Western Europe, its position undoubtedly constitutes a key aspect of its economy and its
    capital, Brussels, is home to a large number of European and international institutions.

    With a surface area of 31,000 km² and 11.4 million inhabitants, Belgium, along with the
4   Netherlands, has the highest population density in Europe.

    Belgium is divided into three Regions: the Brussels-Capital Region, Flanders and Wallonia.
    Its population is also broken down into three language groups (Dutch, French and German)
    and therefore Belgium has also three communities: the Flemish Community, the French
    Community and the German-speaking Community.

    The communication infrastructure is highly developed across the country in terms of major
    roads, railways, waterways, international airports (Brussels, Liege, Charleroi, Ostend, Ant-
    werp and Kortrijk) and sea ports (Antwerp, Zeebrugge, Ghent and Ostend). Belgium has one
    of the most developed “broadband” telecommunication networks in Europe.

    Graph 1. Competitiveness & digital rankings

    Source: IMD World Competitiveness Center.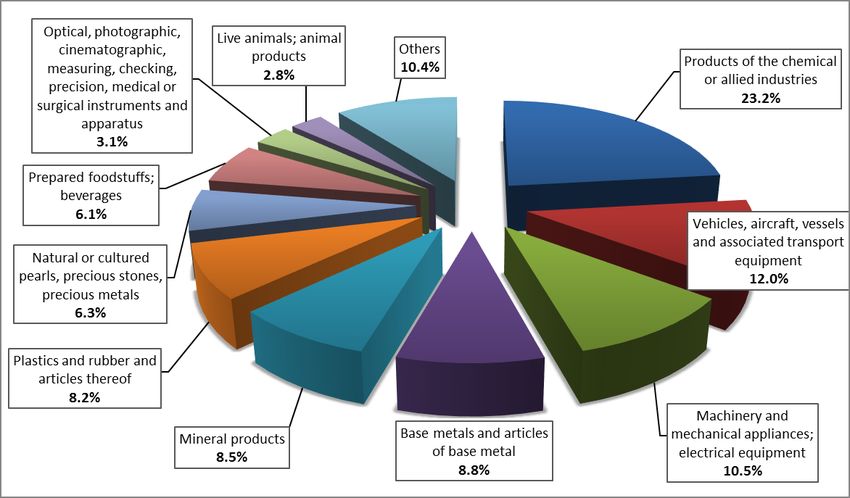
“Creating the conditions for a competitive, sustainable and balanced operation of the goods and services
market in Belgium.”
Furthermore, Belgium is ranked as the 26th most competi-
tive nations out of 63, according to the Institute for Manage-
ment Development (IMD World Competitiveness Yearbook
2018 Results 1) and is ranked 20th (out of 137) according to the
World Economic Forum (Global Competitiveness Report
2018 2). The three most problematic factors for doing business
in Belgium are the tax rates, the restrictive labor regulations
and the tax regulations.
Belgium has a highly-qualified workforce.
Indeed, Belgium benefits from a strong primary and higher edu-
cation as well as training, business sophistication and innova-
tion that are amongst the most competitive in the world.
Source: IMD World Competitiveness Center
It is a quintessential “small open economy”: “small”, with a gross domestic product (GDP) of
437.2 billion euro in 2017, accounting for 2.9 % of the total GDP of the European Union and
“open” with a level of openness3 of 84.7 % (82.3 % in 2016).
Table 1. Belgian share in EU exports and imports
(in %)
Area / Year 2008 2009 2010 2011 2012 2013 2014 2015 2016 2017
5
Share of exports Intra EU-28 9,0 9,1 8,8 8,7 8,6 8,7 8,5 8,4 8,3 8,2
(Belgium in EU-28) Extra EU-28 5,6 5,9 6,1 6,2 6,2 6,1 6,1 5,7 5,8 5,7
Share of imports Intra EU-28 8,3 8,3 8,2 8,2 8,3 8,2 7,8 7,1 7,2 7,1
(Belgium in EU-28) Extra EU-28 6,0 6,1 5,9 6,3 6,2 6,8 7,1 7,3 7,2 6,9
Source: Eurostat
The Belgian economy’s openness is reflected through its integration into the European Un-
ion as well as through its growing focus on the markets outside the European Union. From
2008 to 2012, the Belgian share of international trade has increased with countries outside
the European Union at the expense of the internal market trade, for both exports and im-
ports. This has been an ongoing trend for imports since then while for exports, this share has
decreased both inside and outside the EU.
The openness of the Belgian economy and its membership to a single monetary zone justify a
generally moderate inflation rate. Nonetheless, consumer prices have risen at a faster rate
in Belgium than in its main trade partners (France, Germany and the Netherlands) since
many years.
The Belgian economy, just like any modern industrialized economy, is characterized by the
growing importance of services: the share of market services (including wholesale and re-
tail, financial activities, insurance and energy) in the total gross value added represented
57,3 % in 2017, while this share amounted to only 14.4 % for industry and 5.2 % for construc-
tion. The balance is distributed between non-market services (including healthcare) and ag-
riculture.
1
https://www.imd.org/wcc/world-competitiveness-center-rankings/world-competitiveness-ranking-2018/
2
https://www.weforum.org/reports/the-global-competitveness-report-2018
3
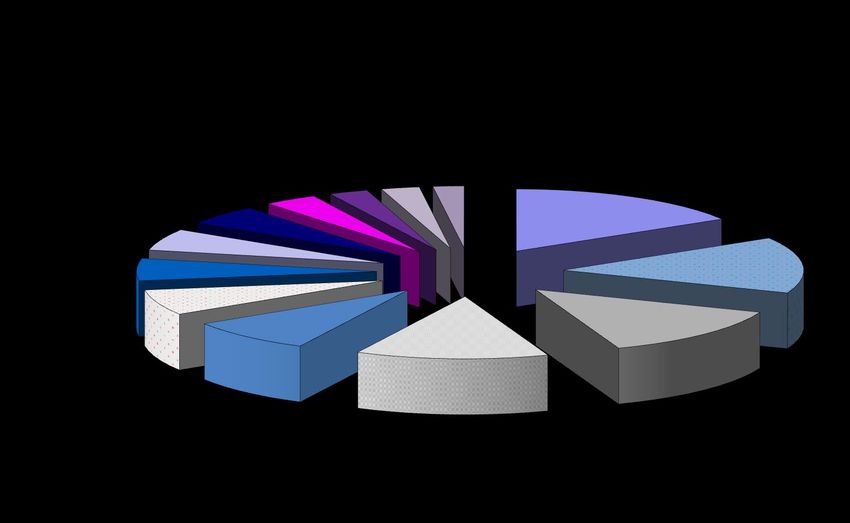
Average value of its imports and exports of goods and services divided by GDP, multiplied by 100.Graph 2. Breakdown of the Belgian industry in 2017
(gross value added as a % share of total industry)
Source: National Accounts Institute (NAI) - Distribution per activity branches (A38).
6 Despite its more limited size than before, the manufacturing industry is still key to the Bel-
gian economy because, in addition to the fact that it generates a large share of market ser-
vices, it also generates strong domestic value added by satisfying foreign demand thanks to
Belgian exports.
The strong sectors of the Belgian industry are:
• the chemical industry (16.4 % of the total manufacturing value added),
• the food industries and beverages (14.6 %),
• the pharmaceutical industry (13.5 %) and
• the manufacture of basic metals and fabricated metal products (12.9 %).“Creating the conditions for a competitive, sustainable and balanced operation of the goods and services
market in Belgium.”
Graph 3. GDP per capita in PPS in 2017
Source: Eurostat.
According to the European structural indicators from Eurostat, Belgium’s GDP per capita,
expressed in purchasing power standards, amounted to 117 in 2017 compared to the EU-28
7
average set equal to 100, and was not far from 121 (recorded in 2012), its best performance
over the last 10 years, even though this score is decreasing since then. Nevertheless, Bel-
gium is one of the richest countries in the European Union, ranking eighth, just behind Swe-
den.2. Cyclical developments in the economy
Graph 4. GDP evolution in % and contribution of the different components “expenditures con-
cept”
(percentage points, year-on-year)
8
Source: National Accounts Institute (NAI) and National Bank of Belgium (NBB).
• In 2017, the annual GDP growth in Belgium amounted to 1.7 %, against 1.5 % observed
in 2016. This growth is completely driven by domestic demand (excluding invento-
ries), which contributed by 1.1 percentage points to GDP growth. Unlike the previous
year, net exports contributed positively to economic growth (+0.6 percentage points) in
2017. The changes in inventories did not contribute to the economic growth in 2017.
• The GDP grew by 1.6 % during the third quarter of 2018 (year-on-year), a slight ac-
celeration compared to the growth observed in the previous quarter (1.4 %) or the one
noted in the same quarter of 2017 (1.5 %).
• The domestic demand (excluding inventories) has improved economic growth by 0.9
percentage points during the third quarter of 2018. This positive contribution to GDP
growth can be mainly explained by private final consumption, but also by government
expenditures and investments. The private final consumption supported economic
growth by 0.4 percentage points during the third quarter of 2018, while the support of
public consumption stabilized to 0.2 percentage points. The support of investments to
economic growth increased and reached 0.3 percentage points during the third quarter
of 2018 (compared to 0.2 percentage points during the previous quarter).
• Finally, during the third quarter of 2018, net exports have boosted economic activity for
the sixth time in a row and was the main growth driver during this period. Their contri-
bution to GDP growth reached 1.3 percentage points during the third quarter of 2018,
compared to a contribution of 0.8 percentage points during the second quarter of 2018.“Creating the conditions for a competitive, sustainable and balanced operation of the goods and services
market in Belgium.”
Graph 5. Foreign trade according to the national concept 4
(in billion euros)
Provisional data’s from 2015.
Source: National Accounts Institute (NAI) and National Bank of Belgium (NBB).
9
• According to the national concept and the overview table of the NBB, the data show a
slight improvement of the trade balance in 2017 compared to 2016, due to a greater
dynamism of exports than imports of goods.
• Belgian exports in value grew by 12.8 % during the third quarter of 2018, compared
to the same period of the previous year, reaching 72 billion euros (against 63.8 billion
euros a year earlier). This result is due to both intra-EU exports, which rose by 10.3 %
year-on-year, and extra-EU exports, which grew by 18.9 % over the same period of
time.
• Belgian imports increased to 73.2 billion euros in the third quarter of 2018 (+12.7 %
year-on-year), due to both stronger intra-EU imports (+10.4 %) and extra-EU imports
(+18.4 %).
• These results translate into a negative trade balance in the third quarter of 2018 (-1.2
billion euros). In addition, the net trade balance deteriorated compared to the previous
quarter (+0.1 billion euros) and compared to the one of the corresponding quarter of
the previous year (-1.1 billion euros).
4The national concept refers solely to cross-border movements of goods involving a resident business
counterparty. (Source: NBB).Graph 6. GDP in % and contribution of the different components “production concept”
(percentage points, year-on-year)
10 Source: National Accounts Institute (NAI) and National Bank of Belgium (NBB).
• In 2017, the economic activity continued to strengthen, reaching 1.7 % growth, year-
on-year. The industry growth (excluding construction) amounted to 0.2 % in 2017, as
well as in 2016, and thus did contribute to the economic growth by 0.1 percentage
points in 2017 (like in 2016). Therefore, services were the main driver of the economic
activity growth in Belgium in 2017. Increasing by 2.2 % compared to 2016, they sup-
ported economic growth by 1.5 percentage points in 2017, against 1.1 percentage
points the previous year. Agriculture dampened the economic activity by 0.1 percentage
points in 2017.
• During the third quarter of 2018, the activity in the industry (excluding construction)
contributed to GDP growth by 0.1 percentage points for the third time in a row.
• The activity in the construction sector improved during the third quarter of 2018, so
that the contribution of the construction sector to growth amounted to 0.1 percentage
points during the same period. The construction sector has not contributed to the eco-
nomic expansion since the first quarter of 2016.
• Finally, the contribution of services to GDP growth increased slightly, from 1.1 per-
centage points in the second quarter of 2018 to 1.2 percentage points in the third quar-
ter of the same year. As usual, services have almost entirely supported the growth of
economic activity. It should also be noted that the contribution of services to economic
activity growth (year-on-year) was lower in the first three quarters of 2018 than in the
corresponding periods of 2017.
• Business confidence kept decreasing during the third quarter of 2018 compared to
the previous quarter of 2018. It became negative. However, such business confidence
level is still higher than usual.“Creating the conditions for a competitive, sustainable and balanced operation of the goods and services
market in Belgium.”
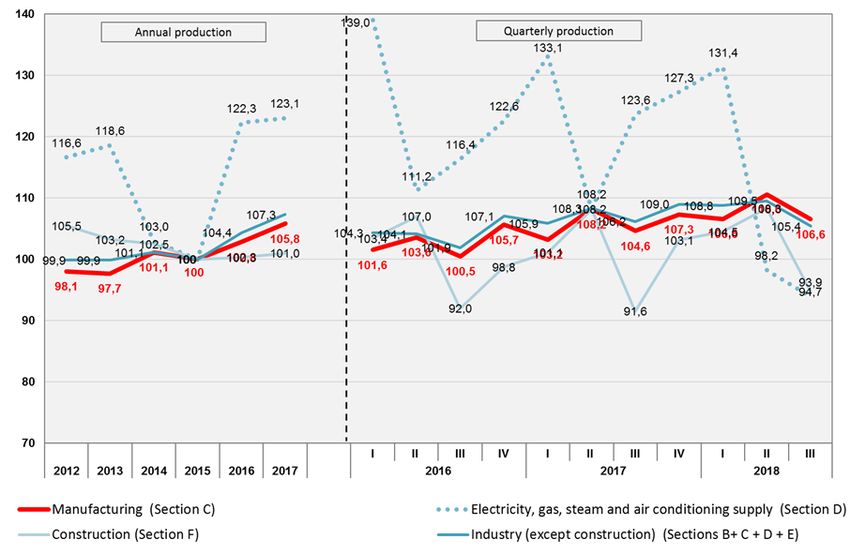
Graph 7. Industrial production indices
(2015 = 100)
Source: Statbel, Working-day adjusted indices. 11
• In 2017, production in the industry (excluding construction) increased by 2.9 % year-
on-year, compared to +4.4 % the previous year, due to a lesser growth in energy pro-
duction (+ 0.6 % vs 22,3 % in 2016).
• In the third quarter of 2018, production in the industry (excluding construction) de-
creased by 0.7 % compared to the corresponding quarter of 2017.
• With 0.7 % growth in 2017 year-on-year, activity in the construction sector continued
its slow recovery initiated in 2016. However, after having grown by 3.4 % in the first
quarter, year-on-year, the pace of growth slowed in the second quarter and then ac-
celerated to reach a 3.5 % increase in the third quarter of 2018.
• Lastly, the production of electricity, gas, steam and air conditioning supply grew
slowly in 2017 (+ 0.6 %) after the sharp acceleration observed in 2016 (+ 22.3 %, mainly
due to the reactivation of certain nuclear production units). In the third quarter of 2018,
energy production decreased by 24 % year-on-year, continuing its decline initiated in
the first quarter of 2018, mainly due to the unavailability of certain production plants.Graph 8. Business demography in Belgium
Source: Statbel.
12 • Entrepreneurial demographics showed a positive trend in 2017 compared to 2016 in
terms of new companies created, unlike the number of deletions. The number of new
enterprises increased by 2.5 % and the write-offs by 4.2 %. With 36,080 companies, the
net creation balance registered 157 companies less than in 2016.
• 23,316 new companies were set up in the third quarter of 2018, thus 948 enterprises
more than those registered in the third quarter of 2017 (+4.2 %).
• These new companies account for 87.6 % of first tax registrations (individuals for
51.8 % and legal entities for 35.9 %) and for 12.4 % of renewed tax registrations (indi-
viduals for 10.4 % and legal entities for 2.0 %).
• Conversely, 15,373 companies stopped their activity in the third quarter of 2018 (indi-
viduals for 67.63 % and legal entities for 32.47 %), thus 2,334 closures more than those
observed in the third quarter of 2017.
• The balance between “Business Creations” and “Business Closures” remains posi-
tive in the third quarter of 2018, reflecting entrepreneurial dynamism and accounting
for 7,943 companies (individuals: 51.5 % - legal entities: 48.5 %), which represents a
decrease of 14.9 % (-1,386 units) compared to the same quarter of 2017.“Creating the conditions for a competitive, sustainable and balanced operation of the goods and services
market in Belgium.”
Graph 9. Employment rate and harmonized unemployment
(in %)
Source: Eurostat. 13
• In 2017, the three selected labour market indicators showed a favorable evolution in
2017 compared to 2016. Thus, the employment rate increased by 0.8 percentage points,
from 62.3 % to 63.1 %, while the overall unemployment rate and the unemployment
rate for young people under 25 years-old fell respectively by 0.7 and 0.8 percentage
points, to attain 7.1 % and 19.3 %.
• Employment rate reached 65.0 % in the third quarter of 2018 (+1.6 percentage points
compared to the same quarter of 2017).
• Unemployment rate (raw data) reached 5.9 % and declined by 1.3 percentage points
on a year-on-year basis in the third quarter of 2018.
• Youth unemployment rate (raw data) amounted to 16.3 % in the third quarter of 2018
and has also decreased by 2.8 percentage points compared to the rate registered in the
same quarter of 2017 (19.1 %).Graph 10. Number of unemployed jobseekers (UJS)
Source: NEO.
14 • In 2018, the number of unoccupied job seekers (UJS) evolved favorably compared to
2017 (down by 5.8 %) as did the youth UJS which decreased by 7.8 %.
• The number of unemployed jobseekers (UJS) kept decreasing during the first four
quarters of 2018 (year-on-year). 488,274 UJS were registered in the fourth quarter of
2018, which means 4.4 % UJS less than those observed in the same period of 2017.
• The number of youth unoccupied job seekers (less than 25 years-old) (UJS) also de-
clined during the fourth quarters of 2018 (year-on-year). With 88,687 youth UJS record-
ed in the fourth quarter of 2018, there has been a year-on-year reduction of 6.5 % of
youth UJS.“Creating the conditions for a competitive, sustainable and balanced operation of the goods and services
market in Belgium.”
Graph 11. Harmonized consumer price index (HICP) evolution (in %) and contribution to inflation
of the 5 major product groups
(in percentage points)
Source: Statbel.
15
• Total inflation in Belgium, measured on the basis of the HICP, accelerated slightly in
2018 compared to 2017, from 2.2 % to 2.3 %.
• The rise in inflation can be explained by the prices of the main energy products, which
grew by 8.9 % on average over the year and contributed by 0.9 percentage points to to-
tal inflation, i.e. similar to that of 2017. This positive contribution is mainly due to the
year-on-year increase of petroleum products prices (liquid fuels and fuels) and, to a
lesser extent, gas prices, in particular because of an increase in global demand for en-
ergy products.
• Processed food prices rose by 3.4 % in 2018, contributing by 0.5 percentage points to
total inflation. The growth of unprocessed food prices accelerated over this period
(+1.5 % vs. 0.1 % in the previous quarter), bringing its contribution to 0.1 percentage
points.
• Due to its important weight in the consumer basket (over 40 %), rising prices for ser-
vices by 1.5 % pushed total inflation upwards by 0.6 percentage points.
• The fifth group of products, non-energy industrial products, recorded a slight in-
crease in inflation in 2018 from 0.8 % to 0.9 %, thereby fueling total inflation by 0.2 per-
centage points.3. Foreign Trade – Overview of Trade Flows
Table 2. Share of national exports in world exports
(in %)
2008 2009 2010 2011 2012 2013 2014 2015 2016 2017
EU 28 16.3% 16.9% 15.6% 15.6% 15.1% 15.8% 15.5% 15.6% 15.9% 15.8%
Russia 4% 3.3% 3.5% 3.7% 3.7% 3.6% 3.4% 2.7% 2.4% 2.7%
USA 11% 11.7% 11.1% 10.7% 10.8% 10.8% 11.1% 11.8% 12,0% 11.5%
C hina 12.1% 13.3% 13.7% 13.7% 14.3% 15.1% 16,0% 17.9% 17.3% 16.9%
Japan 6.6% 6.4% 6.7% 5.9% 5.6% 4.9% 4.7% 4.9% 5.3% 5.2%
India 1.5% 2,0% 1.9% 2.2% 2% 2.3% 2.2% 2.1% 2.1% 2.2%
Source: Eurostat.
• The share of the European Union as a whole (EU28) in the world trade exports has
slightly decreased between 2008 and 2017, in contrast to the growing importance of
China. Indeed, its export share in world exports has grown by more than one third over
the same period of time, rising from 12.1 % in 2008 to 16.9 % in 2017, even though it is
decreasing since 2016. Russia has followed an opposite path compared to China, with
a share of its national exports in world exports decreasing between 2008 and 2017,
from 4 % in 2008 to 2.7 % in 2017.
• Between 2016 and 2017, the share of the EU28, the USA, China and Japan exports in
world trade exports decreased.
16 Table 3. The share of Belgian exports going to the main geographical areas of the world
Total Belgian Exports - Classification by area
2014 2015 2016 2017
World (all entities) 100% 100% 100% 100%
European Union 70.0% 70.9% 70.0% 70.7%
Other European countries 5.0% 4.3% 4.7% 4.8%
Ukraine 0.2% 0.1% 0.2% 0.2%
Africa 2.9% 2.9% 2.6% 2.7%
America 7.1% 7.9% 8.8% 8.0%
United States 4.8% 5.7% 6.5% 5.5%
Asia 12.7% 12.2% 12.5% 12.2%
China 2.3% 2.0% 2.1% 2.4%
India 3.4% 3.2% 3.1% 2.8%
Japan 0.8% 0.8% 1.1% 0.9%
Australia and Oceania 0.5% 0.6% 0.6% 0.5%
Other 1.7% 1.3% 0.8% 1.1%
Source: National Accounts Institute (NAI), national concept.
• The European Union is the leading destination for Belgian exports of goods with a
share of 70.7 % of total Belgian exports of goods in 2017. This share remained relative-
ly stable since 2014. This stability is also observed in the trade relations with Ukraine,
accounting for 0.2 % of Belgian exports in 2017, as well as with other major geograph-
ical areas such as Africa and Australia.“Creating the conditions for a competitive, sustainable and balanced operation of the goods and services
market in Belgium.”
Graph 12. Most important export partners in 2017
(in billion euros)
Source: National Accounts Institute (NAI), national concept.
• In 2017, Belgian exports of goods went mainly to nearby countries. The first destination
was Germany, accounting for 45.4 billion euros, followed by France with 39.1 billion
euros and the Netherlands with 31.4 billion euros. Together, those 3 countries re-
17
ceived 42.9 % of total Belgian exports of goods.
• The United Kingdom comes in 4th place with approximately 19.7 billion euros of Bel-
gian exported goods to this country, which represents 7.3 % of total Belgian exports.
Graph 13. Most important import partners in 2017
(in billion euros)
Source: National Accounts Institute (NAI), national concept.
• Once again, the main partners for Belgian imports of goods in 2017 were the same
ones as those for its exports. Thereby, the first provider was the Netherlands, ac-
counting for 55.6 billion euros, followed by Germany with 41.2 billion euros and Francewith 29.4 billion euros. Together, those 3 countries supplied 45.5 % of total Belgian im-
ports of goods.
• Also, the United Kingdom appears in the top 10 (5th) of Belgian partners for its imports
of goods. Indeed, the United Kingdom delivered goods for an amount of 13.1 billion eu-
ros in 2017, which is equivalent to a share of 4.7 % of total Belgian imports.
Graph 14. Breakdown of Belgian exports in 2017
18
Source: National Accounts Institute (NAI), national concept.
In 2017, mainly four sectors dominated total Belgian exports of goods. These were chem-
ical products (23.2 % - 62.6 billion euros), vehicles and transport equipment (12 % -
32.3 billion euros), machinery and equipment (10.5 % - 28.3 billion euros) and base
metals (8.8 % - 23.8 billion euros). Together, those four sectors represented more than
half of total Belgian exports.“Creating the conditions for a competitive, sustainable and balanced operation of the goods and services
market in Belgium.”
4. The place of Belgium compared to the European
Union
Graph 15. GDP in Belgium, the European Union and the euro area
19
Source: Eurostat.
• Increase in the GDP since 2013 in Belgium and in the European Union and since 2014
in the euro area.
• Since 2015, GDP grows at a slower pace in Belgium than in in the two other areas.Graph 16. Production index in the industry and in the construction
(index 2010 = 100)
Source : Eurostat.
20 • Continuation of the persistent upward trend in the manufacturing industry production
index in Belgium but also in the other two areas.
• In Belgium, the production index in the construction sector grew for the second year
in a row in 2017, after a downward trend observed until 2015. The production continued
to grow more rapidly in the two other areas.
Graph 17. Population and employment rate“Creating the conditions for a competitive, sustainable and balanced operation of the goods and services
market in Belgium.”
Source: Eurostat.
• With 11.4 million inhabitants on 1 January 2017, Belgium’s population accounted for
3.3 % of the one in the euro area (339.9 million inhabitants) and for 2.2 % of the Euro-
pean Union’s population as a whole (511.5 million inhabitants).
• With 68.5 %, Belgium's employment rate in 2017 is close to the average rates regis-
tered in the euro area (71 %) and in the European Union (72.2 %). However, as Bel-
gium's employment rate is growing slower than in the other two regions, the gap is
widening.
Graph 18. Unemployment rate
21
Source: Eurostat.
• In 2017, Belgium’s unemployment rate (15-64 year-olds) pursued its downward path
and reached its lowest level on the analyzed period. This is also true for the euro area
and the European Union, even though the decline has been less pronounced in Belgium
and started later than in the two other zones. Compared with 2016, this rate is down by
0.6 percentage points in Belgium, by 0.9 percentage points in the euro area and by 1
percentage point in the European Union.
• The downward trend in the youth unemployment rate (15-24 year-olds) initiated in
2014 has continued in 2017: -1 percentage point in Belgium compared to 2016 (euro
area: -2.1; EU: -1.9). However, Belgium’s youth unemployment rate, higher than the
one of the European Union since a few years, becomes also higher than the one ob-
served in the euro area in 2017. Furthermore, the gap between Belgium and the Euro-
pean Union is wider in 2017 regarding the youth unemployment rate.Graph 19. Inflation
Source: Eurostat.
22 • Inflation in Belgium has risen faster compared to its main trade partners (France,
Germany and the Netherlands) and to the euro area since various years.
• The energy prices spread between Belgium and the euro area during the last two
years is clearly observable.“Creating the conditions for a competitive, sustainable and balanced operation of the goods and services
market in Belgium.”
5. Macroeconomic forecasts
Table 4. GDP growth forecasts in the international environment
(in %)
International environnement 2017 2018 (e) 2019 (e) 2020 (e)
World 3,8 3,7 3,5 3,6
United States 2,2 2,9 2,5 1,8
China 6,9 6,6 6,2 6,2
Euro area 2,4 1,8 1,6 1,7
Germany 2,5 1,5 1,3 1,6
France 2,3 1,5 1,5 1,6
The Netherlands 2,9 2,8 2,6 -
United Kingdom 1,8 1,4 1,5 1,6
(e) = estimate.
Source: IMF (World Economic Outlook, January 2019). No update for the Netherlands.
Table 5. GDP growth forecasts in Belgium
Belgium 2017 2018 (e)
(in %, unless otherwise indicated)
2019 (e)
23
GDP 1,7 1,4 1,3
Final consumption expenditure of
1,1 0,8 1,6
households and NPI
Final consumption expenditure of
0,6 1 1,1
general government
Gross fixed capital formation 1,8 2,1 2,3
Net exports (goods and services)
(contribution to growth, in p.p.)
0,6 0,7 -0,2
Total inflation (HICP) 2,1 2,1 1,6
Source: NAI (economic budget, February 2019).You can also read