Coca-Cola Bottlers Japan Holdings First Quarter 2018 Earnings Presentation - May 14, 2018 - NET-IR
←
→
Page content transcription
If your browser does not render page correctly, please read the page content below
Coca-Cola Bottlers Japan Holdings
                First Quarter 2018
           Earnings Presentation
                           May 14, 2018

                 Tamio Yoshimatsu, President
                             Vikas Tiku, CFO
                            Head of Transformation

                           (Released on May 11, 2018)
Q1 2018
Forward-looking statements
  The plans, performance forecasts, and strategies appearing in this material are based on the assumptions and judgment of the
  management of Coca-Cola Bottlers Japan Holdings Inc. (CCBJH) in view of data obtained as of the date this material was released.
  These forecasts may differ materially from actual performance due to risks and uncertain factors such as those listed below.
  Risks and uncertain factors are not limited to the items listed below. They are also included in our annual securities report, or “Yuka
  Shoken Houkokusho”.
    •   Agreements with The Coca-Cola Company and Coca-Cola (Japan) Company Limited.
    •   The quality and safety of products
    •   Market competition
    •   Natural environment, such as climate, disaster, water resources, etc.
    •   Legal environment
    •   Leakage or loss of information
    •   Change of economic conditions, such as personal consumption, currency exchange rates, prices of raw materials, fair value of
        assets, etc.
    • Business integration, streamlining and optimization of business processes, etc.
    • Uncertain factors other than those above
  The information in this presentation is provided for informational purposes and should not be construed as a solicitation of an investment
  in our securities.
  CCBJH undertakes no duty to update any statement in light of new information or future events. You should rely on your own
  independent examination of us before investing in any securities issued by our company.
                                                                                                                                               2
Coca-Cola Bottlers Japan Holdings Inc. (CCBJH)
First quarter (Q1) 2018 earnings presentation

   Q1 2018 summary and business update

   Q1 2018 financial results & integration progress

   Outlook for the rest of the year

   Q&A
                                                      3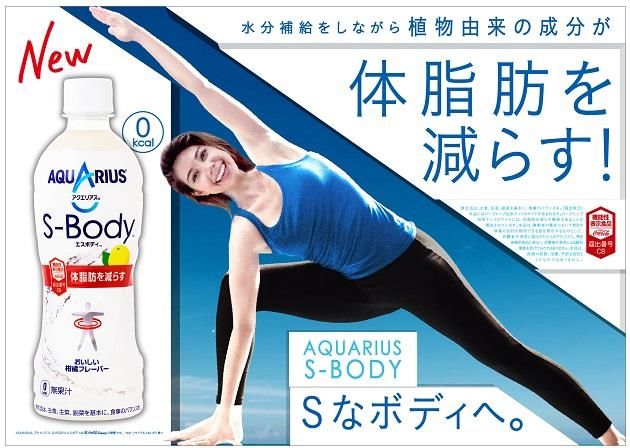
CCBJH
Q1 2018 summary and
  business update

                      4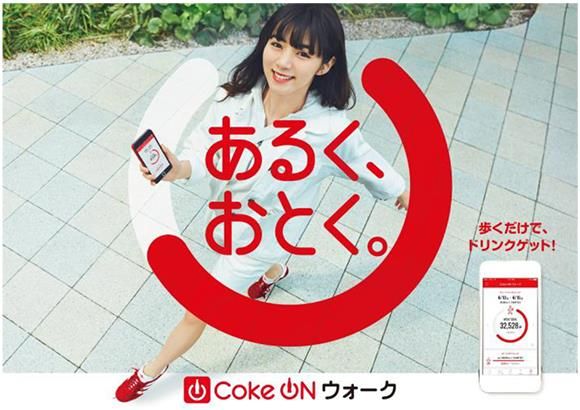
Q1 2018
2018: Pivoting from integration focus to growth mindset
Still early but gaining traction; Consistent focus on sustainable growth
                                  Executing segmented channel and category strategies
       National scale,            tailored for each region
       local presence             Community-focused and customer-centric commercial
                                  activities, leveraging the scale of CCBJH

                                 “Beverages for Life” product portfolio
                                 Enhanced engagement with customers and consumers,
         Innovation              driven by insights
                                 Leveraging digital technology across the value chain

                                  Continued disciplined synergy capture toward 2020
         Synergies                Prioritizing big bets
                                  Fuel to re-invest for sustainable growth

                                                                                              5
Q1 2018
Q1 2018 results highlights
Volume growth and strong synergy capture, yet competition intensifying
   First quarter volume growth of 1%. Solid start to the second quarter with
   encouraging April results.
   Market share growth in both value and volume terms, with value share
   growth ahead of volume. Consistently improving trends since integration.
   Reported revenue increased 116% due to the April 2017 integration.
      Pro-forma revenue declined 2%, due to negative channel mix and competitive
      pricing environment
   Reported operating income grew 46% versus prior year.
      Pro-forma operating income decreased 14%, primarily due to 1.4 billion yen
      goodwill amortization in Q1. Without integration-related goodwill amortization,
      pro-forma operating income growth was positive.                                   6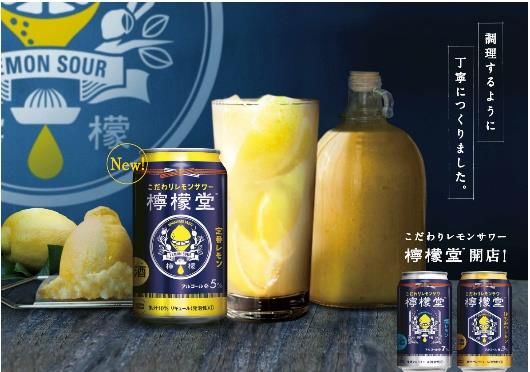
Q1 2018
Q1 2018 integration progress
Integrating with speed, implementing financial framework initiatives
    Generated 4 billion yen net integration synergies, mainly from supply chain
    and procurement – slightly ahead of plan
       On-track to deliver full-year synergy target of at least 8 billion yen. Integration
       investments to ramp up during year-to-go period.
    Solid progress in implementing financial framework for value creation
       Completed share repurchase of 8.28% of total outstanding shares
       Announced new dividend policy
       Introduced performance-oriented equity-based compensation program for
       directors and executive officers.
    Continued to simplify organizational and legal entity structure.
       Number of legal entities down from 25 on Day One to 14 on April 1, 2018.
                                                                                             7
Q1 2018
Strong Q1 Product and Marketing Schedule
Strategic innovation supporting our pivot from integration to growth
  Big bets in Q1                        January                               February                                      March
                              New Year Promo.                      Coke ON Cross Brand Promotion                     FIFA World Cup Coke ON Promo.
  • Coca-Cola Peach:                                      2018 Winter Olympic Promotion

    First in the world
  • Chaba no Amami:
    Cold brew, mild taste
    AyatakaTM green tea                  GEORGIA Fan Selection                          GEORGIA OTC Channel Promo. / GEORGIA Open Promo.
                                                       VM Lucky Cap Promotion                                   GEORGIA Coke ON Promo.
  • Kochakaden Craftea:
    Premium black tea with
    honey and juice from                ILohas Mileage Promotion
                                         Aquarius Promo.
                                                                                     ILohas Promo.         Ayataka Promo.         Craftea Promo.
                                                                              Girl’s Festival Qoo Promo.                           Real Gold Promo.
    Minute Maid oranges
  • THE TANSAN:
   Leveraging growing
   consumer preference for
   sparkling water. Highest
   CO2 gas volume in Japan
   Coca-Cola history
                                                                                                                                                      8
Q1 2018
Q1 2018 OTC market share and retail price trends
Sequential share improvement, value share focus in line with strategy
               OTC Market Share                                                                           OTC Retail Price
                                                                                                                                     Unit: JPY per bottle

                                                                                                                       Vs. Market
     Market Share (vs. PY, PP)          Value          Volume                          OTC Retail Price (YTD   2017)
                                                                                                                        Average
                                                                                                                                      Vs. PY

     Q1 2018                             +0.4             +0.2                         Small PET                              +0.5              -0.9
          Value      Volume                                                            Large PET (2L PET)                     -1.6              -3.9

                                                                                            Tougher near-term outlook due to new
                                                                                            products and cycling strong growth
                                                                                            initiatives from 2017
                                                                                            FOSHU and FFC supported small PET
                                                                                            premium versus market average
    Steady improvement since integration;
    Consistent focus on value over volume                                                   Strategic focus on value growth remains
                                                                                            unchanged
    Sparkling, teas, sports driving share gains
                                                                       Source: Intage SRI
                                                                                                                                                            9

            FOSHU: Food for Specific Health Usage (Government approved); FFC: Food for Functional Claim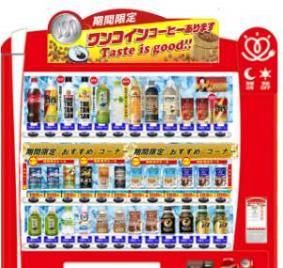
Q1 2018
Strategic product portfolio and pricing segmentation
Strongly committed to this strategy, but still a work-in-progress

      Profitability & competitiveness                                                              Teiban expansion
    Protect & maintain value of Core, with meeting                                             Increase profitability by
    competitive environment by-area, by-channel.                                               acquiring more Teiban shelf
                                                                                               presence of higher-value
    Consistent focus on profitability.                                                         SKUs (FOSHU & FFC)
                                                             Overall Category
          Core                                                Improvement

                                                                                                    Pricing & assortment
                          ×
                                                             Competitiveness
                                  Subs                                                              in vending
                                  Competition
                                                                Profitability                   Segmentation depending on
                                                                                                consumer needs &
     Protect & maintain
        profitability                                                                           competitive landscape

                                                                                                                                  10

              FOSHU: Food for Specific Health Usage (Government approved); FFC: Food for Functional Claim
Q1 2018
Channel volume performance (pro-forma)
Growth in OTC channels; Cycling Q1 2017 per-case revenue improvement
Supermarket, Drug & Discounter
Q1 2018 volume +1% Revenue • Volume growth in major categories led by tea,
vs. PY Volume per Case sparkling, water
(Yen)
Others • Growth in future consumption packages
1% Supermarket +6% -25
(SM) Convenience Store
R&F SM • Growth led by sparkling, non-sugar teas, FOSHU and
22%
Drug & FFC.
23%
Discounter +12% -16
• Coffee volume recovered to flat with improving selling
(D&D) price
D&D
12% Convenience +3% +8
VM Vending
Store (CVS)
26% CVS • Solid growth of sparkling, non-sugar teas and sports
16% Vending (VM) -6% -4 categories offset by weakness in coffee and water
Retail & Food Retail & Food
-1% -1
(R&F) • Revenue per case improved in food service, with
volume decline
11
Note: Some inconsistencies with the data provided in past presentations may be expected as a
result of standardization of volume and revenue calculation.
FOSHU: Food for Specific Health Usage (Government approved); FFC: Food for Functional ClaimQ1 2018
Vending transformation
Holistic end-to-end actions to address short- and long-term trends
Short-term Mid to Long-term
Selective price Deploying pilot actions to
support VPM
Digitalized
optimization on
Retail Model
competitive
environment
Assortment – New Leveraging Coke ON app to
launches, vending- Developing create new value
Connected
exclusive, high-value Consumers
products based on
consumer needs
Machine Initial proof-of-concept
placement/locations Innovation of underway
Filling Operation
Next-generation
Automated picking Data analytics communications
12Q1 2018
Category volume performance (pro-forma)
Growth in sparkling, tea, sports; Increased competition in coffee and water
Q1 2018 volume +1%
• Coca-Cola Peach and Coca-Cola Plus contributed to
volume growth of Coca-Cola in sparkling. The
vs. PY Volume
Juice TANSAN Strong and Lemon launched in first
7% Others
Sparkling +6% quarter
10% Sparkling
26% Non-sugar tea +6% • Launch of Ayataka Chaba no Amami drove non-
sugar tea growth across major channels
Sports +4%
Coffee • Sports category grew in D&D, CVS and VM
22% Non- Water -3% supported by PyongChang Olympic campaign, etc.
sugar tea
20% -7%
• Premium iLohas water volume lower due to cycling
Water Coffee prior year new products and ongoing competition. 2L
9% Sports
6% Juice even PET volume increased, cycling prior year declines
• Coffee category performance impacted by weak SOT
(Stay on tab) can packages
13
Note: Some inconsistencies with the data provided in past presentations may be expected as a
result of standardization of volume and revenue calculation.CCBJH
Q1 2018 financial results
and integration progress
14Q1 2018
Q1 2018 results vs. Q1 2017 pro forma
Revenue declined -2%, driven by channel mix and cycling strong revenue-per-case growth in 2017
Operating Income declined 14% mainly due to goodwill amortization; Excluding this impact, OI grew
25% with a strong focus on operational efficiency to generate synergies.
Net income grew 2%, cycling extraordinary integration expenses from before Day One (April 1, 2017)
Q1 2018 Q1 2017 YoY
(pro forma)
Revenue 213,828 218,081 -2.0%
Beverage business revenue 206,588 210,584 -1.9%
Beverage business sales volume (M cases) 111 110 +1%
Operating Income (OI) 3,162 3,690 -14.3%
Beverage business OI 2,272 2,843 -20.1%
Net Income 1,530 1,498 +2.1%
EBITDA 15,295 15,681 -2.5%
15
Unit: B JPY
Net Income: Net income attributable to owners of parent.Q1 2018
Q1 2018 operating income drivers
Price/mix pressure offset by strong synergy delivery; Ex-Goodwill, pro-forma OI +0.8B
Volume -0.3 +0.04
Price &
Mix
Integration
expenses
Healthcare
& Skincare
4.5 -1.4
Business
3.7 OI
Q1 2018
Manufac- +3.9
DME turing
OI before
goodwill
Goodwill,
etc.
3.2
-2.8
Manufacturing
• Volume +1% efficiencies,
• Cycling prior procurement
year low DME synergies, etc..
spending
Growth in
Other
OTC Opex
channel
-1.7 • Decrease of
offset by labor
decline of • Cycling of prior
Q1 2017 profitable Commodity, +2.4 year accounting Q1 2018
Pro-forma vending etc. harmonization
CCBJH OI
volume, etc. (residual value
CCBJH OI write off), etc.
-0.7
• 4B net synergies 16
Unit: B JPY, rounded off less than unitQ1 2018
Integration synergies, CAPEX, depreciation
Generating synergies and investing with focus on 2018 OI plan
Integration synergies CAPEX and depreciation
• 4B yen net synergies generated in Q1 • Investing for sustainable growth
• Supply chain • Expect higher CAPEX investment
• Procurement, etc. levels in rest of year relative to Q1
• Q1 results slightly ahead of plan to deliver at
least 8 B yen of full-year synergies Q1 2018 FY 2018
• Investments for synergy generation Actual Plan
expected to ramp up from Q2 Capex 7.3 65.9
Depreciation 10.3 43.5
Unit: Billion JPY
Pro-forma depreciation doesn’t include amortization of goodwill, etc.
17Q1 2018
Solid progress implementing financial framework for value creation
Dividend policy Equity-based incentive aligned with CCBJH’s mid- to
long-term performance targets
Prioritize paying a stable dividend while
allowing shareowners to benefit from profit Three-year stock-based compensation plan for
growth executive directors and executive officers
From 2019, after implementation of IFRS, Performance share units (PSU) based on achievement
target dividend payout ratio of 30% or of revenue growth and ROE targets
more Variable grant ratio depending on level of achievement
Targets:
2018 expected full-year dividend 50
Revenue growth: 2.0% (2017 to 2020 CAGR)
JPY/share, up 6 yen per share vs. 2017
2020 ROE: 6.6%
Share repurchase
Completed share buyback of 17,075,239 shares
(8.28% of total shares outstanding), amounting 55.9B
yen as of settlement date, April 13, 2018
18Q1 2018
Q1 2018 results (Reported)
Consolidated CCEJ into CCBJI from Q2 2017. First quarter 2017 CCW standalone.
Q1 2018 Q1 2017 YoY
Revenue 213,828 99,141 +115.7%
COGS 103,317 47,179 +119.0%
Gross Profit 110,511 51,962 +112.7%
SG&A 107,348 49,794 +115.6%
Operating Income 3,162 2,167 +45.9%
Income Before Tax 3,042 1,470 +106.9%
Net Income 1,530 942 +62.4%
EPS 7.49 8.63 -1.14
Beverage Health Care & Skin
Q1 2018 Q1 2017 YoY Q1 2018 Q1 2017 YoY
Business Care Business
Revenue 206,588 91,644 +125.4% Revenue 7,240 7,497 -3.4%
Operating Income 2,272 1,320 +72.1% Operating Income 890 846 +5.1% 19
Unit: Million JPY except EPS
Net Income: Net income attributable to owners of parent.CCBJH
Outlook for the rest of
the year 2018
20Q1 2018
2018 business plan (as announced 2/2018)
2017 Results YoY
2018 Plan
Pro-forma Pro-forma Reported
Volume Growth YoY +2% -1% - -
Revenue 1,007.3 991.6 +2% +15.4%
Operating Income 49.7 42.1 +18% +22.5%
Ordinary Income 47.9 41.3 +16% +20.2%
Net Income 28.8 25.8 +11% +14.1%
EBITDA 100.4 89.7 +12% -
EPS 149.66* - - +4.74
Beverage 2017 Results YoY Healthcare &
2018 Plan Pro-forma (Pro-forma) Skincare business
2018 Plan 2017 Results YoY
business
Revenue 975.7 961.8 +1% Revenue 31.6 29.7 +6.3%
OI 46.0 38.9 +18% OI 3.7 3.2 +15.8%
*EPS forecast changed reflecting movement of the number of average shares due to share buy back. 21
Unit: B JPY except EPS
Net Income: Net income attributable to owners of parent.Q1 2018
Product launch & marketing calendar ahead of summer
Innovating in new categories, regional limited launches for profitable revenue growth
Georgia Coca-Cola THE TANSAN Aquarius S-Body Lemondo Chu-Hi
Japan Craftsman Coffee Regional limited slim bottles
Apple Mint (FFC) Alcoholic beverage trial
“Ohenro” and more in Kyushu region
Coke ON Walk
Added step-count
feature to get loyalty
points
iLohas campaign 22
FOSHU: Food for Specific Health Usage (Government approved); FFC: Food for Functional ClaimQ1 2018
Making steady progress on 2018 goals, but much work remains
Volume growth, RGM Revenue +2%
Revenue growth initiatives, revenue-
rich innovation Volume +2%
Value share
Improve price/mix with
packaging, innovation,
VALUE ahead of
focus on value volume
Steady net synergy
Net synergies capture to meet 2020
target of 25 billion yen
8 billion yen
Operating income Growth mindset,
synergy capture,
49.7 billion yen OI
and OI margin reinvest in business OI margin 4.9%
Strong cash flow from
Dividend growth operations driving Full-year 50 JPY/share,
shareholder returns up 6 JPY
23Q1 2018
Key takeaways
Q1 volume growth of 1%. Solid start to Q2.
Taking appropriate competitive countermeasures as and where
necessary
Improving share trends since integration; value share growth
ahead of volume
Generated 4 B yen synergies, slightly ahead of plan; on-track to
deliver at least 8 B yen for full year.
Making steady progress on the financial framework for value
creation; (share repurchase, equity-based compensation)
24Q&A
25Appendix
26Q1 2018
We are part of the global Coca-Cola system
An enduring and effective partnership
Coca-Cola (Japan) Company
• Brands • Customer focus
• Innovation • Local expertise
• Global perspective • Best-in-class execution
• Consumer focus • Finished goods production
• Superior insight • Logistics and distribution
• Cost optimization
27Q1 2018
Glossary of key terms
DME Abbreviation of Direct Marketing Expenses. Sales promotion-related expenses, including advertisement, rebates, sales, sales
commissions, etc.
FC Abbreviation of Future Consumption. Purchase or sell beverage for future consumption in home, etc. It also means the
products / SKUs for FC (for example, single packages 1L or more and multi-pack of IC packages) and channels that consumers
purchase the beverages for FC. (for example, supermarket, drug & discounter channels, etc.).
HORECA Abbreviation of Hotel, Restaurants and Cafeteria. Generally means sales channels of these kinds.
IC Abbreviation of Immediate Consumption. Purchase or sell beverage for consuming it immediately. It also means the products
/ SKUs for IC (for example, single packages less than 1L as well as fountain) and channels that consumers purchase the
beverages for IC (for example, vending machines, convenience store channel, etc.).
OBPPC Abbreviation of Occasion, Brand, Package, Price, Channel. A segmentation strategy tailored to consumption opportunities to
drive revenue growth in five areas: occasion, brand, package, price and channel.
Pro forma Assuming the business integration of CCW and CCEJ from January 2017 and estimating the results, or compare 2018 results
with pro forma 2017 results.
PTC Abbreviation of Price, Terms and Conditions, an internal guideline for setting appropriate transaction conditions with
customers, frequently used in conjunction with RGM.
RGM Abbreviation of Revenue Growth Management, an overall strategy and process to achieve profitable revenue growth.
RTM Abbreviation of Route-to-Market. A framework, a process, a philosophy, a proven approach for driving profitable growth.
Vending Retail sales to consumers through vending machine
Channel Definitions
Supermarket Wholesale to supermarket chains customers
Drugstore & Discounter Wholesale to drugstore and discounter chains customers
Convenience Store Wholesale to convenience store chains customers
Retail & Food Wholesale to grocery store, liquor store, eating & drinking establishments
(HORECA), online sales channels customers, etc.
Others Wholesale to customers other than above 28Investor Relations
Coca-Cola Bottlers Japan Holdings Inc.
ir@ccbji.co.jp +81-3-5575-3797
https://en.ccbj-holdings.com/ir/
facebook: https://www.facebook.com/ccbji/
コカ・コーライーストジャパン株式会社You can also read