Execution of Vision 2020 fully on track - Joe Kaeser, President and CEO Bernstein Strategic Decisions Conference | New York, June 1, 2016 ...

Page created by Marion Lambert
 
CONTINUE READING
Execution of Vision 2020 fully on track - Joe Kaeser, President and CEO Bernstein Strategic Decisions Conference | New York, June 1, 2016 ...
Execution of Vision 2020 fully on track
Joe Kaeser, President and CEO
Bernstein Strategic Decisions Conference | New York, June 1, 2016

Unrestricted © Siemens AG 2016                                      siemens.com
Execution of Vision 2020 fully on track - Joe Kaeser, President and CEO Bernstein Strategic Decisions Conference | New York, June 1, 2016 ...
Notes and forward-looking statements

This document contains statements related to our future business and financial performance and future events or developments involving Siemens that may constitute forward-looking statements.
These statements may be identified by words such as “expect,” “look forward to,” “anticipate” “intend,” “plan,” “believe,” “seek,” “estimate,” “will,” “project” or words of similar meaning. We may also
make forward-looking statements in other reports, in presentations, in material delivered to shareholders and in press releases. In addition, our representatives may from time to time make oral
forward-looking statements. Such statements are based on the current expectations and certain assumptions of Siemens’ management, of which many are beyond Siemens’ control. These are
subject to a number of risks, uncertainties and factors, including, but not limited to those described in disclosures, in particular in the chapter Risks in the Annual Report. Should one or more of these
risks or uncertainties materialize, or should underlying expectations not occur or assumptions prove incorrect, actual results, performance or achievements of Siemens may (negatively or positively)
vary materially from those described explicitly or implicitly in the relevant forward-looking statement. Siemens neither intends, nor assumes any obligation, to update or revise these forward-looking
statements in light of developments which differ from those anticipated.
This document includes – in IFRS not clearly defined – supplemental financial measures that are or may be non-GAAP financial measures. These supplemental financial measures should not be
viewed in isolation or as alternatives to measures of Siemens’ net assets and financial positions or results of operations as presented in accordance with IFRS in its Consolidated Financial
Statements. Other companies that report or describe similarly titled financial measures may calculate them differently.
Due to rounding, numbers presented throughout this and other documents may not add up precisely to the totals provided and percentages may not precisely reflect the absolute figures.

Unrestricted © Siemens AG 2016
Page 2                 New York, June 1, 2016                                                                                                                    Bernstein Strategic Decisions Conference
Execution of Vision 2020 fully on track - Joe Kaeser, President and CEO Bernstein Strategic Decisions Conference | New York, June 1, 2016 ...
Siemens Vision 2020 – Stringent execution delivers results

 Value
                                                                                                       Scale up
                                                                                                       • Innovation initiative
                                                                                                       • Customer and market focus
                                                                                                       • Digitalization at work
                                                        Strengthen core
                                                        • Stringent capital allocation

                      Drive performance
                      • Cost reduction support functions (€1bn)
                      • Global footprint optimization
                      • Fix underperforming businesses

                                        Ownership culture drives high performance team

                            2015                 2016                   2017              2018               2019                      2020

 Strategic                       Operational                                      Accelerated growth
                                                        Optimization
 direction                       consolidation                                    and outperformance
Unrestricted © Siemens AG 2016
Page 3             New York, June 1, 2016                                                                        Bernstein Strategic Decisions Conference
Execution of Vision 2020 fully on track - Joe Kaeser, President and CEO Bernstein Strategic Decisions Conference | New York, June 1, 2016 ...
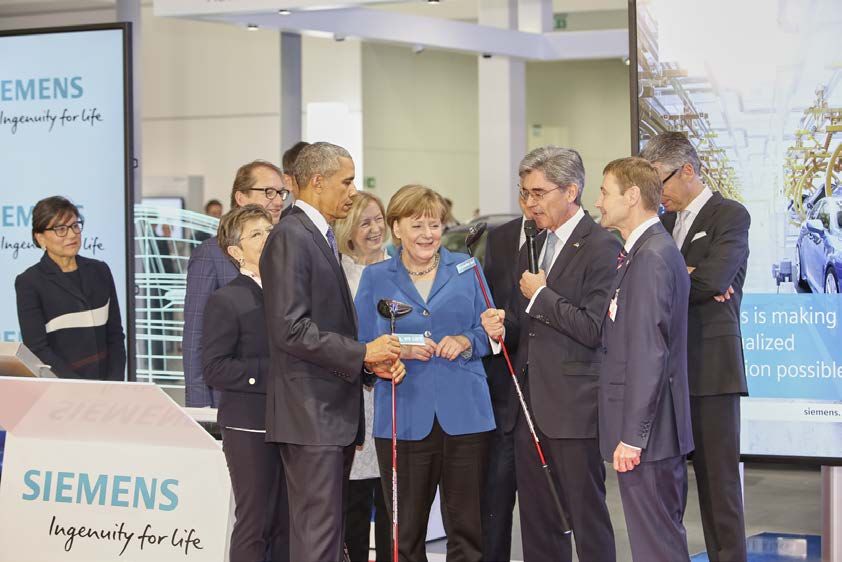
Executing Vision 2020
Capital allocation along strategic imperatives

                                  April 16        1| Areas of growth?                           January 16

                                                  2| Potential profit pool?   Closing of divestment to AtoS

 Closing of acquisition of CD-adapco for
                                                  3| Why Siemens?
 $970m to pursue industrial software
 strategy                                                                                       January 16
                                                  4| Synergetic value?
                                                                              Closing divestment of remaining
                                                  5| Paradigm shifts?         assets to EQT for €300m

                                               Strategic asset combination

                                             50/50 joint venture for powertrain
Unrestricted © Siemens AG 2016                     in E-cars announced
Page 4             New York, June 1, 2016                                                       Bernstein Strategic Decisions Conference
Execution of Vision 2020 fully on track - Joe Kaeser, President and CEO Bernstein Strategic Decisions Conference | New York, June 1, 2016 ...
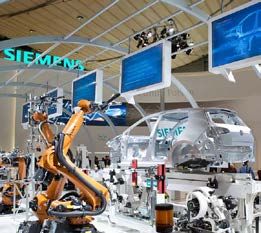
E-A-D: This system matters

 Digitalization                                            Vertical software           Digital services

                                                                ~€3.1bn                     ~€0.6bn             +~16%
                                                                                                                • Build on deep domain know-how
                                                           Revenue FY 2015              Revenue FY 2015         • Leverage M&A and R&D invest
                                                                                  ++                      +++
 Automation                                                Profitability                Profitability           • Roll-out of cross-divisional
                                                                                                                  Sinalytics platform
                                                                                                                • >300k connected devices
                                                         Enhanced automation            Classic services
                                                                                                                • 17 Terabytes of data per month

                                                                 ~€19bn                      ~€15bn
 Electrifi-
 cation                                                    Revenue FY 2015

                                                           Profitability
                                                                                  ++
                                                                                        Revenue FY 2015

                                                                                        Profitability
                                                                                                          +++   +~9%

                                                         Enhanced electrification (~€39bn)
Note: Figures based on Industrial Business (Growth FY 2015 vs. FY 2014 rebased)

Unrestricted © Siemens AG 2016
Page 5               New York, June 1, 2016                                                                              Bernstein Strategic Decisions Conference
Execution of Vision 2020 fully on track - Joe Kaeser, President and CEO Bernstein Strategic Decisions Conference | New York, June 1, 2016 ...
Hannover Fair 2016 – Not only for golfers!
“Ingenuity for life – Driving the Digital Enterprise“

                                             Digital Enterprise – Key innovations

                                                   Enhance Industrial software and automation portfolio

                                              1    • Integration of CD-adapco flow simulation
                                                   • Significant expansion of TIA-Portal and COMOS
                                                     Software suite

                                              2    Expand Industrial communication portfolio

                                              3    Provide holistic industrial security concept

                                                   Drive Industrial services
                                              4    • Launch of Mindsphere platform – the Siemens
                                                     cloud for Industry

Unrestricted © Siemens AG 2016
Page 6             New York, June 1, 2016                                         Bernstein Strategic Decisions Conference
Platforms lead products
Sinalytics connects more than 300,000 devices

                                                                     Sinalytics
  Productivity                                   Energy efficiency   Common technology platforms

  EM                                                          WP

                                                                           Data analytics
                                                              PG
  DF                                                          PS            Sinalytics
                                                                          Data visualization
                                 Sinalytics
                                                                          Modeling/Analysis
                                   Customer
                                 value through                            Data management
                                  applications
  PD                                                          MO
                                                                           Data integration
                                                                         Cloud/Connectivity
                                                                           Cyber Security
  HC                                                          BT

  Availability                                           Security

Unrestricted © Siemens AG 2016
Page 7             New York, June 1, 2016                                                      Bernstein Strategic Decisions Conference
MindSphere with “MindApps powered by Sinalytics” offers our customers a
strong foundation for new, data-based business models

                                             MindSphere – Siemens Cloud for Industry
              Data analytics
                                            MindApps
            Data visualization
                                                       by Siemens                 by OEMs    by end-customers
                                                Optimize the performance of assets, energy and resource consumption,
                                                                      maintenance, services …

                                                                                                 Data management
                                                          MindSphere –                             Data storage
                                                     Siemens Cloud for Industry
                                                                                                   Connectivity
                                                                    10       01             10              01
                                                                    01       00             01              00
                                                                    01       11             01              11
                                                                    11       00             11              00

Unrestricted © Siemens AG 2016
Page 8             New York, June 1, 2016                                                          Bernstein Strategic Decisions Conference
Appendix

Unrestricted © Siemens AG 2016
Page 9             New York, June 1, 2016   Bernstein Strategic Decisions Conference
Guidance FY 2016 – Outlook confirmed

 We confirm our financial guidance for fiscal 2016, although
 the market environment for our high margin short cycle
 business may not pick up materially in the second half.
 We still anticipate further softening in the macroeconomic
 environment and continuing complexity in the geopolitical
 environment in fiscal 2016.
 Nevertheless, we expect moderate revenue growth, net of
 effects from currency translation. We anticipate that orders
 will materially exceed revenue for a book-to-bill ratio
 clearly above 1.
 For our Industrial Business, we expect a profit margin of
 10% to 11%.
 We expect basic EPS from net income in the range of €6.00
 to €6.40.
 Additionally, it excludes charges related to legal and regulatory
 matters.

Unrestricted © Siemens AG 2016
Page 10            New York, June 1, 2016                            Bernstein Strategic Decisions Conference
One Siemens Financial Framework
Clear targets to measure success and accountability

                                                                                One Siemens
                                                                            Financial Framework
    Siemens

                       Growth:                                                   Capital efficiency                                             Capital structure
                   Siemens > most                                                         (ROCE2))                                           (Industrial net debt/EBITDA)
                relevant competitors1)                                                    15 – 20%                                                   up to 1.0x
                (Comparable revenue growth)                                 Total cost productivity3)                                      Dividend payout ratio
                                                                                   3 – 5% p.a.                                                   40 – 60%4)

    Profit Margin ranges of businesses (excl. PPA)5)

                    PG                                  EM                                   MO                                  PD                                SFS6)
                 11 – 15%                             7 – 10%                              6 – 9%                             8 – 12%                             15 – 20%

                    WP                                   BT                                 DF                                  HC
                  5 – 8%                              8 – 11%                            14 – 20%                            15 – 19%

1) ABB, GE, Rockwell, Schneider, Toshiba, weighted; 2) Based on continuing and discontinued operations; 3) Productivity measures divided by functional costs (cost of sales, R&D, SG&A expenses)
of the group; 4) Of net income excluding exceptional non-cash items; 5) Excl. acquisition related amortization on intangibles; 6) SFS based on return on equity after tax
Unrestricted © Siemens AG 2016
Page 11               New York, June 1, 2016                                                                                                           Bernstein Strategic Decisions Conference
Underperforming businesses show improvement

Underperforming businesses
 Unconsolidated Revenue FY 2015 in €bn
                                                                                                        2016e
             ~15                        ~1.2                                                             ~3%
                                                         ~14          Fiscal
                                                                                  2013    2014     2015        2017e         2020e
                                     Siemens                          Year
                                   Compressors

                                                                      Margin      -4%      -3%     +1%          ~6%           >8%

                                                                      • Tight monitoring of business plans
                                                                      • Footprint optimization
                                                                      • Sharpening business scope
     Underperforming                 Reverse          Remaining       • Partnering and divestitures an option
     businesses as of            integration into   underperforming
       Q2 FY 2015                                     businesses

Unrestricted © Siemens AG 2016
Page 12            New York, June 1, 2016                                                         Bernstein Strategic Decisions Conference
Measures for ongoing productivity improvement of 3 - 5% per annum
Example: Supply chain management

                                 Supply chain management - BOLD moves program 2020

                'Traditional' procurement levers
     Contract management & pooling
                                                                  +                       Cross-functional levers
                                                                       Demand/spend management
     Negotiations excellence                                          Core/non-core and footprint
     Digitalization – analytics & process optimization                Supplier innovation & optimization
     Global value sourcing (GVS)                                      Cost & value engineering1) (CVE) incl. design-to-cost

   GVS share of total purchasing volume (~€39bn)                      CVE coverage of total cost base

                        Target: GVS share >1/3                           Target: Significant increase of CVE-Coverage
                                                                       €bn

                                                     35%                                                                                     ~12
            26%                        27%
                                                                                 2.3                           3.2
           FY 2015                   FY 2016e    FY 2020 Target               FY 2015                      FY 2016e                   FY 2020 Target

                                                                  1) Cost and Value Engineering: Cost optimized design solutions in early phase including cost
Unrestricted © Siemens AG 2016                                    transparency along entire value chain
Page 13            New York, June 1, 2016                                                                                Bernstein Strategic Decisions Conference
Accelerated execution of cost reduction measures
Target achievement of ~€1bn well on track

Cumulated effects of savings

                                                                            €850m –
                                                                €800m –               €1bn              €1bn
                                                                             €950m
                                                                 €900m

                             €400m
          €150m –
           €200m

                 FY 2015                                              FY 2016e               FY 2017e

             View on distribution of savings as of Q4 FY 2015

             View on distribution of savings as of Q2 FY 2016

Unrestricted © Siemens AG 2016
Page 14             New York, June 1, 2016                                               Bernstein Strategic Decisions Conference
Continuing growth in orders, revenue and profitability

 Orders                                       Revenue                     Profit Industrial Business (IB)                  Net Income
 in €bn               +7%            Comp.           +5%                  in €bn                                           in €bn
                      (+7%)          (nom.)          (+5%)                                         +28%
                                                                                                                           BSH and
                                                                                                                                                3.9
               20.8           22.3                                                                            2.1          Audiology
                                              18.0           19.0                                                          €3bn
                                                                                                                                                              +~60%
                                                                                           1.7
                                                                                          9.6%               11.4%                                                      1.5
  B-t-B        1.15           1.17                                         Margin                            10.9%
                                                                                          9.0%

               Q2 15      Q2 16               Q2 15          Q2 16                      Q2 FY 15           Q2 FY 16                       Q2 FY 15                  Q2 FY 16

 EPS (“all-in”)                                                           ROCE (“all-in”)                                  Capital structure
 in €                                                                      BSH and                                                                     ≤1
 BSH and                                                                                 45.5%
                                                                           Audiology
 Audiology1)
                                                                           35%-points
 €3.61         4.70
                                     +~60%                                                                      15 – 20%
                                                                                                                                                                   1.1x
                                                 1.78
                                                                                                           14.9%                         0.3x

          Q2 FY 15                             Q2 FY 16                                 Q2 FY 15          Q2 FY 16                     Q2 FY 15                 Q2 FY 16
1) BSH and Audiology EPS-disposal-effects for FY 2015: €3.66
  x.x%    Margin as reported                          x.x%     Margin excl. severance

Unrestricted © Siemens AG 2016
Page 15                 New York, June 1, 2016                                                                                                  Bernstein Strategic Decisions Conference
Convinced customers – Reliable partner – Good business

 Megadeals in Egypt – execution on track                          Major offshore order in Wind Power

• €3.1bn orders for Burullus and New Capital power plants incl.                                 East Anglia ONE project
  long-term service contract
     • Fast track projects for 9.6 GW (16 H-class turbines)                                    • Customer: ScottishPower
     • Financial close in March 2016                                                             Renewables
• Project execution of Beni Suef – 4 out of 8 H-class turbines                                 • 714MW total capacity
  shipped                                                                                      • Largest order to date for 7MW
• Comprehensive transmission network study ongoing                                               direct drive turbine
• Contract for six substations signed                                                          • Five years service contract
• Training of 600 engineers and technicians has started                                        • Order volume ~€1.2bn
                                                                                               • Start of commercial operation
                                                                                                 in 2020
                                                                                               • Delivery out of new Hull and
                                                                                                 Cuxhaven factories in 2019

                                                                  7 MW Turbine (SWT-7.0-154)

Unrestricted © Siemens AG 2016
Page 16            New York, June 1, 2016                                                          Bernstein Strategic Decisions Conference
PG: Great performance in a challenging market environment
WP: Exceptionally strong

   Power and Gas (PG)                                                                         Wind Power and Renewables (WP)
                   Orders                                         Revenue                                     Orders                                     Revenue
 €bn                                                                                          €bn
                    +86%1)
                                                                    +15%1)
                                  6.2                                                                           +60%1)                                     +18%1)
            3.1                                             3.1                  3.9
                                                                                                       1.4                   2.1                   1.3                 1.5

        Q2 FY 15              Q2 FY 16                 Q2 FY 15                Q2 FY 16              Q2 FY 15              Q2 FY 16            Q2 FY 15             Q2 FY 16

                                  Profit & Margin                                                                              Profit & Margin
 €m         Target                                                       Incl. Iran effect:   €m                                                                  Target
                                                            535          Revenue: €174m                                                          137
            margin                                                                                                                                                margin
                                      382                                 Profit: €130m                                      -3.4%              9.6%
           11-15%                                                        Margin: ~280bps                                     -3.5%              9.4%               5-8%
                                    14.1%                 14.9%
                                    12.3%                 13.6%
                                                                                                                              -44
                                  Q2 FY 15              Q2 FY 16                                                            Q2 FY 15          Q2 FY 16

 • Ramp up of Egypt orders drive revenue; 16 LGTs shipped                                     • Major offshore order in UK incl. service of ~€1.2bn
 • Positive revenue and profit effects driven by ending or                                    • Significant revenue increase on high backlog conversion
   easing of Iran sanctions                                                                   • Improved operations drive margin
                                                                                                                                                Margin excl. severance (and excl.
 1) Comparable, i.e. adjusted for currency translation and portfolio effects                  x.x%    Margin as reported               x.x%
                                                                                                                                                integration cost D-R for PG only)
Unrestricted © Siemens AG 2016
Page 17                New York, June 1, 2016                                                                                                 Bernstein Strategic Decisions Conference
EM: Impressive turnaround through stringent execution
BT: Solid performance and great leadership

   Energy Management (EM)                                                                 Building Technologies (BT)
                   Orders                                         Revenue                                 Orders                                     Revenue
 €bn                                                                                      €bn

                      -0%1)                                          -1%1)
                                                                                                            +1%1)                                      +1%1)
            3.1                   3.0                       2.8                   2.7
                                                                                                   1.5                   1.5                   1.4                   1.4

        Q2 FY 15              Q2 FY 16                 Q2 FY 15                Q2 FY 16          Q2 FY 15              Q2 FY 16            Q2 FY 15            Q2 FY 16

                                  Profit & Margin                                                                          Profit & Margin
 €m                                                         172                Target     €m                                                                  Target
                                                                                                                                             111
                                                                               margin                                      95                                 margin
                                      93
                                     3.4%                  6.8%                7-10%                                      6.8%              7.9%              8-11%
                                     3.3%                  6.3%                                                           6.6%              7.7%
                                  Q2 FY 15              Q2 FY 16                                                        Q2 FY 15          Q2 FY 16

 • Double digit order growth in Europe/CAME and Asia/                                     • Order growth in Germany and Middle East, weaker
   Australia offset by Americas due to tough comparables                                    demand from China
 • Profitability improvements in solutions, transformer and                               • Larger share of high margin product and service business
   high voltage products
 1) Comparable, i.e. adjusted for currency translation and portfolio effects              x.x%    Margin as reported               x.x%     Margin excl. severance
Unrestricted © Siemens AG 2016
Page 18                New York, June 1, 2016                                                                                             Bernstein Strategic Decisions Conference
DF: Top line flat – Bottom line top
PD: Structural challenges addressed for long term recovery

   Digital Factory (DF)                                                                   Process Industries and Drives (PD)
                   Orders                                         Revenue                                 Orders                                     Revenue
 €bn                                                                                      €bn

                     +1%1)                                           +0%1)                                  -2%1)                                       -3%1)
            2.6                   2.6                       2.4                   2.4              2.4                   2.3                   2.2                   2.1

        Q2 FY 15              Q2 FY 16                 Q2 FY 15                Q2 FY 16          Q2 FY 15              Q2 FY 16            Q2 FY 15              Q2 FY 16

                                      Profit & Margin                                                                      Profit & Margin
 €m                                                                            Target     €m                                                                    Target
                                    343                   363                  margin                                     103                                   margin
                                                                                                                                             89
                                  14.5%                  15.5%                 14-20%                                     4.9%              4.5%                8-12%
                                  14.1%                  15.1%                                                            4.6%              4.1%

                                Q2 FY 15               Q2 FY 16                                                         Q2 FY 15          Q2 FY 16

 • Top line growth in the U. S. more than offset by lower                                 • Ongoing weak demand in commodity-related industries
   volume in China and Germany                                                            • Growth in wind power component business
 • Profit increase mainly driven by Factory Automation                                    • Structural challenges weigh on profit

 1) Comparable, i.e. adjusted for currency translation and portfolio effects              x.x%    Margin as reported               x.x%     Margin excl. severance
Unrestricted © Siemens AG 2016
Page 19                New York, June 1, 2016                                                                                             Bernstein Strategic Decisions Conference
MO: Stringent execution secures leading margins in the sector
HC: Consistently strong performer in the market

   Mobility (MO)                                                                          Healthcare (HC)
                   Orders                                         Revenue                                 Orders                                     Revenue
 €bn                                                                                      €bn

                     -50%1)                                                                                 +2%1)                                      +5%1)
                                                                     +6%1)
            3.8                                                                                    3.2                   3.2                   3.2                   3.3
                                  1.8                       1.8                   1.9

        Q2 FY 15              Q2 FY 16                 Q2 FY 15                Q2 FY 16          Q2 FY 15              Q2 FY 16            Q2 FY 15            Q2 FY 16

                                  Profit & Margin                                                                          Profit & Margin
 €m                                                                            Target     €m                                                 555              Target
                                   157                                                                                    526
                                                         153                   margin                                                                         margin

                                  8.7%                   8.2%                  6-9%                                      16.9%             17.2%             15-19%
                                  8.6%                   8.0%                                                            16.4%             16.7%

                                Q2 FY 15              Q2 FY 16                                                          Q2 FY 15          Q2 FY 16

 • Orders down on tough comparables                                                       • Clear order and revenue growth in the U.S.
 • Profitable revenue growth driven by stringent backlog                                  • Revenue increase and strong earnings mainly driven by
   execution of large projects                                                              Diagnostic Imaging

 1) Comparable, i.e. adjusted for currency translation and portfolio effects              x.x%    Margin as reported               x.x%     Margin excl. severance
Unrestricted © Siemens AG 2016
Page 20                New York, June 1, 2016                                                                                             Bernstein Strategic Decisions Conference
Below Industrial Business: Strong results from SFS,
D/O-gain from sale of remaining financial assets from hearing aid business

 Below Industrial Business (Q2 FY 2016)                                                Expectations for H2 FY 2016
 in €m                                                                                 • SFS: H2 in line with prior year
                      -99
                              22
                                                                                       • CMPA: Negative impact H2 smaller than prior year,
     2,115 226                        -141                                               however, volatility remains
                                             -167   -51                                • SRE: H2 in line with prior year dependent on disposal
                     Therein:
                     Negative effect                                                     gains
                     from ARO Hanau                       -510
                     and Primetals JV                                    86   1,480    • Corporate Items: H2 in line with prior year
                                                                 1,394

               Therein:
                                                                                       • Pension: ~-€125m per quarter
               €92m effect from an                                                     • PPA: H2 in line with H1
               at-equity investment
                                                    Tax rate
                                                    @27%              Therein:         • Elimination, Corporate Treasury, Other:
                                                                      Sivantos
                                                                      €60m
                                                                                         H2 in line with prior year, including higher interest
                                                                                         expenses
                                                                                       • Tax: Expect 26 - 30% for FY 2016

          IB   SFS CMPA SRE           Corp. PPA Elim. Tax         Inc. Disc. Net
                                                                                       • Discont. Operations: Limited impact in H2
                                      Items      Corp.           Cont. Ops. Income
                                      & Pen.    Treas.,          Ops
                                                                              all in
                                                Other

Unrestricted © Siemens AG 2016
Page 21               New York, June 1, 2016                                                                               Bernstein Strategic Decisions Conference
Financial calendar

                    June 1, 2016
                    Bernstein Conference (New York)
                    June 9, 2016
                    JP Morgan Conference (London)
 June
                    June 14, 2016
                    Exane Conference (Paris)
                    June 28 – 29, 2016
                    Capital Market Day “Energy and Oil & Gas” (Houston)

 July /             August 4, 2016
 August             Q3-Earnings Release

Unrestricted © Siemens AG 2016
Page 22            New York, June 1, 2016                                 Bernstein Strategic Decisions Conference
Siemens Investor Relations contacts

                                            Investor Relations
                                            Internet:     www.siemens.com/investorrelations

                                            Email:        investorrelations@siemens.com

                                            IR-Hotline:   +49 89 636-32474

                                            Fax:          +49 89 636-32830

Unrestricted © Siemens AG 2016
Page 23            New York, June 1, 2016                                                 Bernstein Strategic Decisions Conference
You can also read