CIBC 2018 Whistler Institutional Investor Conference - Jan 25-26 2018 - Parkland Fuel Corporation
←
→
Page content transcription
If your browser does not render page correctly, please read the page content below

CIBC 2018 Whistler Institutional
                     Investor Conference
TSX: PKI                         Jan 25-26 2018
FORWARD LOOKING STATEMENT DISCLAIMER &
NOTE ON NON GAAP MEASURES
Certain information included herein is forward-looking. Many of these forward looking statements can be identified by words such as “believe”, “expects”, “expected”, “will”, “intends”, “projects”, “projected”,“anticipates”,
“estimates”, “continues”, "objective" or similar words and include, but are not limited to, statements regarding Parkland’s expectation of its future financial position, business and growth strategies and objectives, sources of
growth, capital expenditures, financial results, synergies expectations and/or targets, future acquisitions and the efficiencies to be derived therefrom, Parkland's leverage pro forma the CCL Transaction (as defined herein), the
contribution to EBITDA and/or Adjusted EBITDA and/or Normalized EBITDA (as defined herein) from the CCL Transaction and/or the CST Transaction (as defined herein), the pro forma site counts, volumes, and gross margins
expected to be derived from the CCL Transaction and, where applicable, the CST Transaction. Unless otherwise stated or the context dictates otherwise, the financial outlook and forward looking metrics contained in this
presentation exclude potential import/export synergies and are based on the following assumptions, as applicable, including but not limited to: (i) Parkland’s ability to continue securing sufficient supply of crude oil, including
sufficient access to linespace on the Trans Mountain pipeline; (ii) refining and marketing margins in Metro Vancouver, Vancouver Island, and the BC Interior remaining consistent with historic norms; (iii) conducting the 2018
Burnaby Refinery (as defined herein) turnaround as planned in Q1 2018; (iv) maintaining the assets within the forecasted budget for capital expenditures, particularly those relating to the Burnaby Refinery; (v) operating the
Burnaby Refinery with no unplanned extended outage; (vi) operating the Burnaby Refinery at a utilization rate within historic norms, including in respect of fluctuations of refining gross margins, and planned maintenance downtime
andassociated expenses. Parkland believes the expectations reflected in such forward-looking statements are reasonable but no assurance can be given that these expectations will prove to be correct and such forward looking
statements should not be unduly relied upon. The forward-looking statements contained herein are based upon certain assumptions and factors including, without limitation: historical trends, current and future economic and
financial conditions, and expected future developments. Parkland believes such assumptions and factors are reasonably accurate at the time of preparing this presentation. However, forward-looking statements are not guarantees
of future performance and involve a number of risks and uncertainties, some of which are described in Parkland’s annual information form and other continuous disclosure documents. Such forward-looking statements necessarily
involve known and unknown risks and uncertainties and other factors, which may cause Parkland’s actual performance and financial results in future periods to differ materially from any projections of future performance or
results expressed or implied by such forward looking statements. Such factors include, but are not limited to, risks associated with: the failure to achieve the anticipated benefits of acquisitions, including the acquisition of
Chevron Canada R&M ULC (the "CCL Transaction") of which the assets include: i) 129 Chevron branded retail service stations, ii) 37 cardlock locations, iii) a wholesale aviation business serving the Vancouver International
Airport, and iv) terminals located in Burnaby, Hatch Point, and Port Hardy (collectively, the “Marketing Business”) which are integrated with and supported by a refinery in Burnaby, British Columbia (the “Burnaby Refinery” and
together with the Marketing Business, the “Acquired Business”); the acquisition of the majority of the Canadian assets of CST Brands, Inc. (“CST”) from Alimentation Couche-Tard Inc. (the “CST Transaction”); the operationsof
the Burnaby Refinery assets including compliance with all necessary regulations; competitive action by other companies; refining and marketing margins; the ability to cost-effectively secure sufficient supply of crude oil and other
raw materials, including sufficient access to linespace on the Trans Mountain pipeline; the ability of suppliers to meet commitments; the ability to conduct the 2018 Burnaby Refinery turnaround as planned in Q1 2018; the ability
of management to maintain the assets within the forecasted budget for capital expenditures, particularly those relating to the Burnaby Refinery; the ability to maintain productive relationships with the labour unions (Unifor and
Teamsters) that represent the majority of the employees at the Burnaby Refinery; failure to meet financial, operational and strategic objectives and plans; failure to achieve expected synergies; general economic, market and
business conditions; industry capacity, failure to realize anticipated synergies from CST Transaction and/or CCL Transaction; the operations of Parkland’s assets, actions by governmental authorities and other regulators including
increases in taxes; changes and developments in environmental and other regulations; and other factors, many of which are beyond the control of Parkland. If Parkland is unable to complete the CCL Transaction there could be a
material adverse impact on Parkland and on the value of its securities. Readers are directed to, and are encouraged to read, Parkland’s management discussion and analysis for the six-month period ended September 30, 2017
(the “Q3 MD&A”), and year ended December 31, 2016 (the “Annual MD&A”) including the disclosure contained under the heading “Risk Factors” therein. The Q3 MD&A is available by accessing Parkland’s profile on SEDAR at
www.sedar.com and such information is incorporated by reference herein. Any forward-looking statements are made as of the date hereof and Parkland does not undertake any obligation, except as required under applicable law,
to publicly update or revise such statements to reflect new information, subsequent or otherwise. The forward-looking statements contained in this presentation are expressly qualified by this cautionary statement. Additionally,
readers are directed to, and encouraged to read, the Adjusted EBITDA section of Parkland’s press release dated November 2, 2017 and the 2017 Adjusted EBITDA Guidance Range section of Parkland’s press release dated
November 2, 2017. This presentation refers to certain financial measures that are not determined in accordance with International Financial Reporting Standards (“IFRS”). Distributable Cash Flow, Distributable cash flow per
share, Payout Ratio, Earnings Per Share, Normalized EBITDA, Normalized Run-rate EBITDA, Senior Funded Debt and Total Funded Debt to Credit Facility EBITDA are not measures recognized under IFRS and do not have
standardized meanings prescribed by IFRS. Adjusted EBITDA is a measure of segment profit. See Section 12 of the Annual MD&A and Note 24 of the Annual Consolidated Financial Statements for a reconciliation of these
measures of segment profit. Normalized EBITDA is management’s estimate of the annualized five-year average EBITDA of the Acquired Business post-2018 turnaround, based on the annualized average historical EBITDA of the
Acquired EBITDAfrom 2012-2016 and is subject to the material factors and assumptions noted above as well as management’s assumptions regarding: i) crude oil costs and refined product pricing for the future period (refined
product pricing is driven by refined product supply and demand in Metro Vancouver); and ii) expenses in connection with routine turnarounds temporarily increasing operating expenses and decreasing throughput and revenue.
Management considers these to be important supplemental measures of Parkland’s performance and believes these measures are frequently used by securities analysts, investors and other interested parties in the evaluation of
companies in its industries. Normalized EBITDA in respect of the assets acquired in the CCL Transaction has been determined in a manner consistent with the manner in which Parkland determines EBITDA for reporting purposes
over the periods referred to. See ‘‘Adjusted EBITDA” in Parkland’s Annual MD&A for a reconciliation of Adjusted EBITDA to net earnings. Distributable cash flow is used to assess the level of cash flow generated from ongoing
operations and to evaluate the adequacy of internally generated cash flow to fund dividends. See ‘‘Distributable Cash Flow” in Parkland’s Annual MD&A for a reconciliation of distributable cash flow to cash flow from operating
activities, the IFRS measure most directly comparable to distributable cash flow. See “Non-GAAP financial measures, reconciliations and advisories” section of the Annual MD&A. Investors are encouraged to evaluate each
adjustment and the reasons Parkland considers it appropriate for supplemental analysis. Investors are cautioned, however, that these measures should not be construed as an alternative to net income determined in accordance
with IFRS as an indication of Parkland’s performance. The financial measures that are not determined in accordance with IFRS in this presentation are expressly qualified by this cautionary statement. Additionally, the estimated
annual Adjusted EBITDA contribution from the assets Parkland will acquire pursuant to the CCL Transaction and/or business acquired in the CST Transaction is based on the financial statements of CCL and CST respectively,
which were prepared in accordance with United States (U.S.) generally accepted accounting principles (U.S. GAAP) and converted to Canadian dollars at averaged historical exchange rates on a quarterlybasis.

TSX: PKI                                                                                                          2

ONE OF NORTH AMERICA’S FASTEST GROWING
Who We Are:   MARKETERS OF PETROLEUM PRODUCTS

                        Annualized Metrics:
                        (Pro Forma CST & Chevron)   (3,4)
                                                            1,841
                                                            Gas Stations

                                                            16.9 billion litres
                                                            Annual Volume

                                                            $660 million
                                                            EBITDA
                                                            (Estimated Normalized Adjusted)

TSX: PKI                 3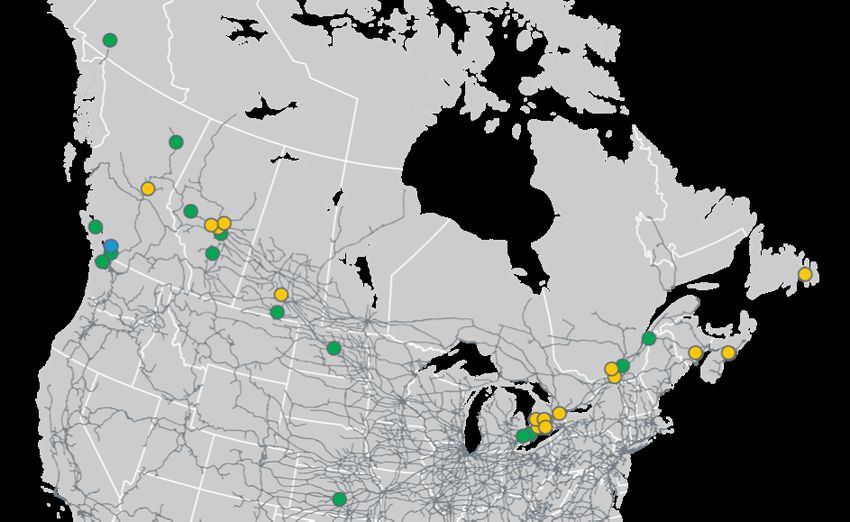
How We Did It                           PARKLAND CONTINUES TO BENEFIT FROM STABLE,
                                        DIVERSE AND GROWING ADJUSTED EBITDA

 $660            million4                           230 (4)
                                                                     43 (4)          ~660 (4)     ProForma Contributions

 Annualized Adjusted EBITDA                                                                         Division    EBITDA

 C$ millions
                                                                                                     Retail     50-55%
                                     25 (4)
                    110   (4)
                                                                                                   Supply &
                                                                                                                35-40%
                                                                                                   Wholesale
       254 (4)
                                                                                                   Commercial   5-10%

                                                                                                    Parkland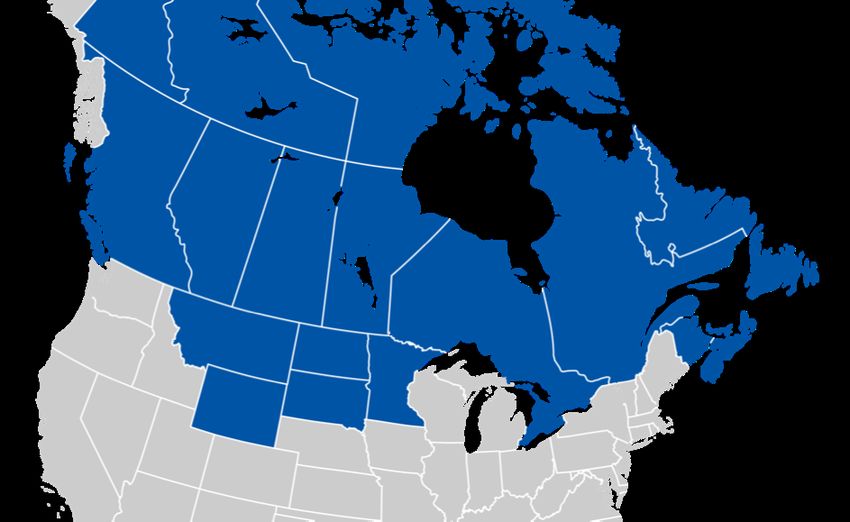
Who We Are:                       OUR SUPPLY AND LOGISTICAL CAPABILITIES ADD
                                  IMMEDIATE VALUE TO THE ASSETS WE ACQUIRE

           SUPPLY                       LOGISTICS                 MARKETING

       REFINING                          THIRD PARTY
                                                                   RETAIL GAS
      PARTNERS                            TRUCKING
                                                                    STATIONS

                     MARINE
                   TERMINALS

                                                 DISTRIBUTION
       IMPORTERS                                                         WHOLESALE
                                                  TERMINALS

                   PKI REFINERY

         O&G                                                        COMMERCIAL
      PRODUCERS                                RAIL                  DELIVERY

TSX: PKI                                         5
A PLATFORM THAT SOURCES AND MOVES PETROLEUM Supply Network: PRODUCTS THROUGHOUT CANADA AND THE UNITED STATES Strong North American supply / logistical network Relationships with Canadian and US Refiners Import and Export Capabilities TSX: PKI 6
Marketing:                             DISTRIBUTION CHANNELS THAT SELL THE PETROLEUM
                                        PRODUCTS PRODUCED BY REFINERS AND PRODUCERS

Performance (TTM):
Retail Gas   Volume    4.4 BL     38%
 Stations
             EBITDA5   $169.9 M   49%

Commercial   Volume    1.7 BL     15%
 Delivery
             EBITDA5   $58.4 M    17%

 Parkland    Volume    0.9 BL     8%
   USA
             EBITDA5   $16.6 M    5%

Wholesale    Volume    4.6 BL     39%

             EBITDA5   $99.4 M    29%

 TSX: PKI                                           7
Retail Gas THE LARGEST FUEL MARKETER AND SECOND LARGEST
CONVENIENCE STORE OPERATOR IN CANADA BY SITE3
1,841 Gas Stations 3
Brand Company Dealer Total
144 494 638
71 511 582
90 104 194
1613 17 1783
117 35 152
1 67 68
Other 11 18 29
TSX: PKI 8WE DELIVER PROPANE, DIESEL AND OTHER PETROLEUM
Commercial PRODUCTS TO COMMERCIAL CUSTOMERS AND MORE
THAN 150,000 HOMES
~300
Branches & Cardlocks
Strong Regional
Brands
More than 150,000
residential customers
TSX: PKI 9Results
Q3 2017
TSX: PKI 10PARKLAND ACHIEVES RECORD ADJUSTED EBITDA DRIVEN
Q3 2017 Results BY CST AND COMPLETES CHEVRON ACQUISITION EARLIER
THAN EXPECTED
Adjusted EBITDA5:
$96 Million end
e
m ?
a
el
s
u in e x c
Volume Growth: y o
w ill hart
n, c
34% Be erfall
wa
t
Same C-Store Sales Growth:
4.1%
PRIVATE LABEL BRAND “59TH STREET FOOD CO” DEVELOPED FOR C-STORES
LAUNCHED Q4 2017
TSX: PKI 11ACQUISITIONS AND ORGANIC GROWTH HAVE DRIVEN
Q3 2017 Results HIGHER VOLUMES AND ADJUSTED EBITDA
Our Growth Story Volume3 Adjusted EBITDA3,4,5
(Billions of Litres) (CAD $ millions)
• Continued organic 16.9 $660
growth in base
business 9.6
10.4
11.7
8.9
• New volume from 6.7 $254
$297
$215
CST acquisition 4.2
$200 $207
$183
• Acquisition synergies
are on track 2012 2013 2014 2015 2016 TTM Pro
forma
2012 2013 2014 2015 2016 TTM Pro
forma
PARKLAND BENEFITTED FROM REFINER MARGINS
UNTIL THE END OF 2013 THROUGH A SUPPLY CONTRACT
TSX: PKI 12ACQUISITIONS AND ORGANIC GROWTH WILL DRIVE
Q3 2017 Results MEANINGFUL CASH FLOWS GOING FORWARD
Adjusted Distributable Cash Adjusted Pay Out Ratio Total Funded Debt : Credit
Flow per Share Facility EBITDA3,4,6
(Dollars) 4, 8 (Dollars per Share) 4, 8
$2.80
3.50
70% 71% 71%
$1.93 $2.00 65%
$1.79
$1.62 $1.58 $1.60 52% 51% 1.94 2.02 2.01
42%
1.43
1.22
0.85
2012 2013 2014 2015 2016 TTM Pro 2012 2013 2014 2015 2016 TTM Pro 2012 2013 2014 2015 2016 TTM Pro
forma forma forma
TOTAL FUNDED DEBT : CREDIT FACILITY EBITDA FORECAST TO INCREASE TO 3.7 IN 2018
AND THEN DROP TO BELOW 3.0 IN 2019.
TSX: PKI 13Our Strategy TSX: PKI 14
Our Strategy:                   TO BUILD A SUPPLY, LOGISTICAL AND MARKETING
                                ADVANTAGE THAT CANNOT BE REPLICATED

  GROW ORGANICALLY                                        SUPPLY ADVANTAGE
           3 – 5% growth p.a.                              Make benefit outpace volume
                                      ENABLING                       growth
                                         OUR
                                      PEOPLE TO
                                       SUCCEED

                                ACQUIRE PRUDENTLY
                                      Achieve synergies

TSX: PKI                                   15
GROW EARNINGS FASTER THAN INDUSTRY AVERAGE
Organic Growth: THROUGH FUEL AND NON-FUEL INITIATIVES
Retail Commercial WS&D
• Opportunity to • Expand import –
significantly grow our export capability
existing 450 ML of
Fuel • Invest in new locations
delivered propane • Expand number of
terminal and supply
• National card-lock points Driving
Earnings
• Private Label
• Routing optimization
Growth
for trucks
Non • Loyalty
• N/A
Fuel
• Broaden efficiency
• On the Run
across network
TSX: PKI 16Organic Growth RETAIL PRIVATE LABEL PROGRAM ON CONVENIENCE
STORE CONSUMABLES AND MERCHANDISE
Retail Non-Fuel
Achieve
margin lift
with private
label c-store
products
TSX: PKI 1710 BILLION LITRES IN ANNUALIZED
Acquisitions VOLUME ADDED SINCE 2013
16
14
Volume (Billions of Litres)
12
10
8
6
4
2 Parkland USA
0
2007 2008 2009 2010 2011 2012 2013 2014 2015 2016 TTM Pro Forma
TSX: PKI 18Pioneer PIONEER INCREASED PARKLAND’S PRESENCE IN THE
ONTARIO MARKETPLACE PROVIDING CRITICAL SCALE
Acquisition Metrics:
Closed: June 2015
Corporate Retail Sites: 152
Dealer Retail Sites: 241
Card-lock Sites: 0
Commercial Sites: 0
Purchase Price: $378 M
Volume: 2 BL
Acquired EBITDA: $55 M
Synergy Estimate 4: ~$11M
SYNERGIES ACHIEVED >30% OF ACQUIRED EBITDA
TSX: PKI 19ADDING THE STRENGTH OF THE
CST ULTRAMAR BRAND
Acquisition Metrics:
Closed: June 2017
Corporate Retail Sites: 159
Dealer Retail Sites: 495
Card-lock Sites: 73
Commercial Sites: 30
Purchase Price: $975 M
Volume: 3.5 BL
Acquired EBITDA: $110 M
Synergy Estimate 4: $25 M
CST ADDED MEANINGFUL SCALE AND
THE OPERATIONAL PLATFORM FOR ENTERING QUEBEC
TSX: PKI 20Chevron ADDING SUPPLY STRENGTH AND THE PREMIER BC RETAIL
GASOLINE BRAND WITH 17-20% PREMIUM FUEL SALES
Acquisition Metrics:
Closed: Oct 2017
Corporate Retail Sites: 129
Dealer Retail Sites: -
Card-lock Sites: 37
Commercial Sites: 0
Purchase Price: US$1.1 B
Volume: 2.5 BL
Acquired EBITDA: $ 230 M
Synergy Estimate 4: $ 35-50 M
THE DEAL INCLUDED THE REAL ESTATE FOR 91% OF THE RETAIL SITES
TSX: PKI 21Chevron CHEVRON’S BURNABY REFINERY STRENGTHENS OUR
Refinery: SUPPLY IN THE PACIFIC NORTHWEST
Volume committed to
85% the Chevron network
Premium sales in
17-20% Chevron network
driven by 94 Octane
High value products:
90% gasoline, diesel and
jet fuel
Low complexity
6-8 week turnaround
scheduled for February 1
TSX: PKI 22Thank You! TSX: PKI 23
Additional Notes
1. See the Additional Guidance Considerations section of Parkland’s press release dated November 2, 2017
2. Includes Q3 2017 TTM volumes for Parkland Fuel Corporation.
3. Acquisition of all the shares of Chevron Canada R&M ULC from Chevron Canada Limited (“CCL”) closed October 1, 2017.
   Acquisition of the majority of the Canadian business and assets of CST Brands, Inc. from Couche-Tarde Inc. closed on
   June 28, 2017.
4. Normalized EBITDA includes: 2016 Adjusted EBITDA (C$254 million) + the mid-point of management's guidance range of
   Adjusted EBITDA contribution from the CST Transaction (C$110 million) + management estimates of the anticipated run-rate
   synergies from the CST Transaction (C$25 million) + management estimates of Normalized EBITDA from the CCL
   Transaction (C$230 million) + management estimates of the mid-point of anticipated run-rate synergies from the CCL
   Transaction (C$43 million).
5. All EBITDA references, or when EBITDA is used in a calculation are to Adjusted EBITDA. Please refer to our most recent
   MD&A for more information.
6. The Total Funded Debt to Credit Facility EBITDA Ratio is a non-GAAP financial measure. Please refer to our most recent
   MD&A for more information
7. Non tobacco & lottery SKUs
8. Adjusted Distributable Cash Flow per Share and Payout Ratio based on management estimate of Normalized EBITDA for the
   CCL Transaction

TSX: PKI                                                      24
You can also read