Allscripts Healthcare Solutions Investor Presentation - J.P. Morgan 2018 Healthcare Conference | January 9, 2018

Page created by Tyler Buchanan
 
CONTINUE READING
Allscripts Healthcare Solutions Investor Presentation - J.P. Morgan 2018 Healthcare Conference | January 9, 2018
J.P. Morgan 2018 Healthcare Conference | January 9, 2018

Allscripts Healthcare Solutions
Investor Presentation
Allscripts Healthcare Solutions Investor Presentation - J.P. Morgan 2018 Healthcare Conference | January 9, 2018
Disclaimer
  This presentation contains forward-looking statements within the meaning of the Private Securities Litigation Reform Act of 1995, including the
  statements under “Affirming 2017 Outlook”. These forward-looking statements are based on the current beliefs and expectations of Allscripts
  management, only speak as of the date that they are made (or any other specified date), and are subject to significant risks and uncertainties.
  Such statements can be identified by the use of words such as “future,” “anticipates,” “believes,” “estimates,” “expects,” “intends,” “plans,”
  “predicts,” “will,” “would,” “could,” “can,” “may,” and similar terms. Actual results could differ significantly from those set forth in the forward-
  looking statements and reported results should not be considered an indication of future performance. Certain factors that could cause Allscripts
  actual results to differ materially from those described in the forward-looking statements include, but are not limited to: the expected financial
  contribution and results of the Netsmart joint business entity (including consolidation for financial reporting purposes), the provider/patient
  solutions business acquired from NantHealth, and the hospital and health systems business acquired from McKesson Corporation (the “Enterprise
  Information Solutions Business”); the timing and ultimate closing of the Practice Fusion acquisition; the successful integration of businesses acquired
  by Allscripts; the anticipated and unanticipated expenses and liabilities related to the businesses acquired by Allscripts; Allscripts failure to
  compete successfully; consolidation in Allscripts industry; current and future laws, regulations and industry initiatives; increased government
  involvement in Allscripts industry; the failure of markets in which Allscripts operates to develop as quickly as expected; Allscripts or its customers’
  failure to see the benefits of government programs; changes in interoperability or other regulatory standards; the effects of the realignment of
  Allscripts sales, services and support organizations; market acceptance of Allscripts products and services; the unpredictability of the sales and
  implementation cycles for Allscripts products and services; Allscripts ability to manage future growth; Allscripts ability to introduce new products
  and services; Allscripts ability to establish and maintain strategic relationships; risks related to the acquisition of new companies or technologies;
  the performance of Allscripts products; Allscripts ability to protect its intellectual property rights; the outcome of legal proceedings involving
  Allscripts; Allscripts ability to hire, retain and motivate key personnel; performance by Allscripts content and service providers; liability for use of
  content; security breaches; price reductions; Allscripts ability to license and integrate third party technologies; Allscripts ability to maintain or
  expand its business with existing customers; risks related to international operations; changes in tax rates or laws; business disruptions; Allscripts
  ability to maintain proper and effective internal controls; and asset and long-term investment impairment charges. Additional information about
  these and other risks, uncertainties, and factors affecting Allscripts business is contained in Allscripts filings with the Securities and Exchange
  Commission, including under the caption “Risk Factors” in the most recent Allscripts Annual Report on Form 10-K and subsequent Form 10-Qs.
  Allscripts does not undertake to update forward-looking statements to reflect changed assumptions, the impact of circumstances or events that
  may arise after the date of the forward-looking statements, or other changes in its business, financial condition or operating results over time.

Copyright © 2018 Allscripts Healthcare Solutions, Inc.                                                                                                       2
Allscripts Healthcare Solutions Investor Presentation - J.P. Morgan 2018 Healthcare Conference | January 9, 2018
Non-GAAP Financial Measures
  This presentation includes references to non-GAAP revenue, gross profit, gross margin, and Adjusted EBITDA, which are considered non-GAAP financial measures under
  Section 101 of Regulation G under the Securities Exchange Act of 1934, as amended. Each of these measures adjusts for certain items and are not considered financial
  measures under generally accepted accounting principles in the United States (“GAAP”).

  •   Non-GAAP revenue consists of GAAP revenue and adds back deferred revenue from the Netsmart transaction that is eliminated for GAAP purposes due to purchase
      accounting adjustments.
  •   Non-GAAP gross profit consists of GAAP gross profit, as reported, and excludes acquisition-related deferred revenue adjustments, acquisition-related amortization,
      stock-based compensation expense and transaction-related and other costs.
  •   Non-GAAP gross margin consists of non-GAAP gross profit as a percentage of GAAP revenue in the applicable period, as defined above.
  •   Adjusted EBITDA is a non-GAAP measure and consists of GAAP net income (loss) as reported and adjusts for: acquisition-related deferred revenue adjustments;
      depreciation and amortization; stock-based compensation expense; transaction-related and other costs; non-cash asset impairment charges; interest expense and
      other, net; equity in net earnings of unconsolidated investments; and tax provision (benefit).

  Management also believes that non-GAAP measures provide useful supplemental information to management and investors regarding the underlying performance of
  Allscripts business operations. Acquisition accounting adjustments made in accordance with GAAP can make it difficult to make meaningful comparisons of the underlying
  operations of the business without considering the non-GAAP adjustments provided and discussed herein. Management also uses this information internally for forecasting
  and budgeting, as it believes that these measures are indicative of core operating results. In addition, management may use non-GAAP measures to measure achievement
  under Allscripts stock and cash incentive compensation plans. Note, however, that non-GAAP revenue, gross profit, and gross margin are performance measures only, and
  they do not provide any measure of cash flow or liquidity. Non-GAAP financial measures are not in accordance with, or an alternative for, measures of financial
  performance prepared in accordance with GAAP and may be different from non-GAAP measures used by other companies. Non-GAAP measures have limitations in that
  they do not reflect all of the amounts associated with Allscripts results of operations as determined in accordance with GAAP. Investors and potential investors are
  encouraged to review the reconciliation of non-GAAP financial measures with GAAP financial measures contained in the Appendix to this presentation. For the purpose
  of providing financial guidance, the company does not reconcile non-GAAP revenue, non-GAAP earnings, Adjusted net EBITDA or non-GAAP earnings per share guidance
  to the corresponding GAAP financial measures. Allscripts does not provide guidance for the various reconciling items since certain items that impact GAAP revenue and
  net income are either outside of its control and/or cannot be reasonably predicted.                      These are available on Allscripts investor relations website
  (http://www.investor.Allscripts.com).

Copyright © 2018 Allscripts Healthcare Solutions, Inc.                                                                                                                      3
Allscripts Healthcare Solutions Investor Presentation - J.P. Morgan 2018 Healthcare Conference | January 9, 2018
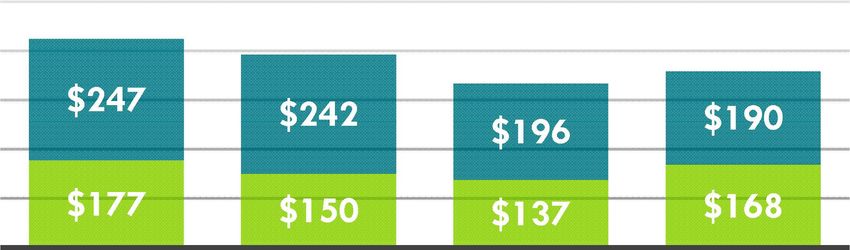
Investment Considerations
  1.            Allscripts offers a robust and diversified solutions portfolio

  2.            Supported by a high recurring revenue model

  3.            Significant operating leverage

  4.            Double digit non-GAAP earnings growth and strong free cash flow

  5.            Secular shift to value-based care drives global investment in IT

              We enable providers to optimize value at the point of care
Copyright © 2018 Allscripts Healthcare Solutions, Inc.                             4
Allscripts Healthcare Solutions Investor Presentation - J.P. Morgan 2018 Healthcare Conference | January 9, 2018
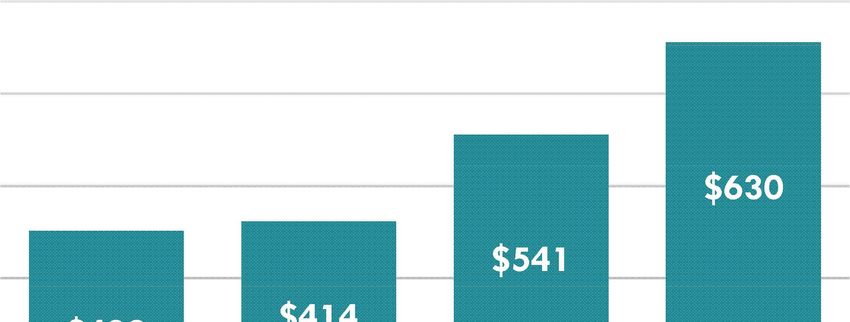
A Global Leader in Healthcare Technology

                         Our Company                                                                                                Our Team

                                              NASDAQ: MDRX
                                                                                                                                       ~8,900 team associates globally
                                              Public since 1999

                                       Global HQ: Chicago, IL                                                                               Veteran executive leadership

                                                                                                                                          Clients, team members in 13
                                Non-GAAP Revenue1: ~$2.2B                                                                               countries incl. Australia, Canada,
                                     ~77% recurring                                                                                                 Israel & UK

1Annualized   2017 non-GAAP revenue based on mid-point of calculated Q4 2017 guidance, multiplied by four, to arrive at full year revenue (to be inclusive of the Enterprise Information Solutions business) plus pro forma Practice Fusion

 Copyright © 2018 Allscripts Healthcare Solutions, Inc.                                                                                                                                                                                       5
Allscripts Healthcare Solutions Investor Presentation - J.P. Morgan 2018 Healthcare Conference | January 9, 2018
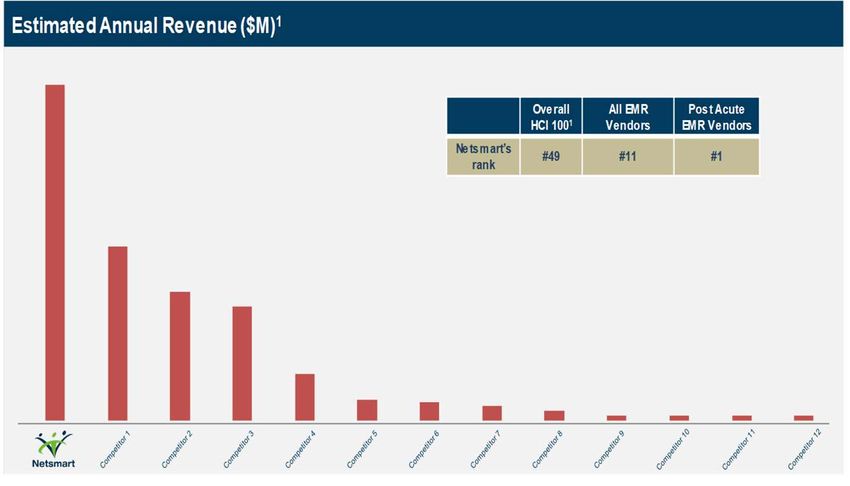
A Complete and Diverse Portfolio

           Precision Medicine &                          Population Health
            Consumer Solutions                           Management
            Integrated, actionable genomic               CareInMotion™ addresses every
         information delivered directly into             element of the population health
                          clinical workflow.             equation.

                               Electronic                Financial
                           Health Record                 Management
     The power of Allscripts EHRs extends                Management and operational
          across the continuum, connecting               efficiency.
                   healthcare communities.

Copyright © 2018 Allscripts Healthcare Solutions, Inc.                                      6
Allscripts Healthcare Solutions Investor Presentation - J.P. Morgan 2018 Healthcare Conference | January 9, 2018
Breadth and Network Connectivity

                   3,400                                 75K+                        3.1B+
                                                                                     OPEN API
                   HOSPITALS                             PHYSICIAN PRACTICES
                                                         Including Practice Fusion   DATA SHARES

                  14M+                                   100K+                       13M+
                  COORDINATED COMMUNITY                  COORDINATED COMMUNITY
                                                                                     CONNECTED CONSUMERS
                  CARE REFERRALS                         CARE ORGANIZATIONS

Copyright © 2018 Allscripts Healthcare Solutions, Inc.                                                     7
Allscripts Healthcare Solutions Investor Presentation - J.P. Morgan 2018 Healthcare Conference | January 9, 2018
Industry & Innovation Recognition

   •       2017
           #1 Population Health
                                                         •   Peer60 2016:
           Management Solution:                              Mindshare Leader in
           for Top Core EHR                                  Revenue Cycle         •   2015 Perfect Scores:
   •       2017,2016, 2015, 2014                             Management                Best practices for
           #1 Inpatient EHR: Large                                                     User-Centered Design
           Hospitals & Academic Medical                  •   Peer60 2016:              from the American
           Centers (+200 beds)                               Mindshare Leader in       Medical Association and
   •       2016, 2015, 2014 Top                              Patient Engagement
           Ambulatory EHR: Large Group
                                                                                       MedStar Health
           Practices

Copyright © 2018 Allscripts Healthcare Solutions, Inc.                                                           8
Growth Opportunity
Future Growth Streams

           Organic growth                                Post-acute    Growth as
            in traditional                                growth       an industry
               markets                                                consolidator

            Our unique growth opportunities—unmatched by any HIT provider

Copyright © 2018 Allscripts Healthcare Solutions, Inc.                               10
Organic growth in traditional healthcare

  Recurring Services                                     Value-based Care Tools                Global Markets
  •   Professional Services                              • Connects & aggregates               • Outstanding reputation and
  •   Hosting                                              community data to create              presence in English speaking
  •   Managed Services                                     harmonized view of patient            countries
  •   Revenue Cycle                                      • Care coordination sets clinical     • Leverage single Sunrise™
      Management Services                                  interventions into action             platform
                                                         • Financial performance               • Complete solution:
                                                           management & decision support         clinical/financial + value-
                                                         • Precision Medicine                    based care
                                                         • Comprehensive solutions             • U.K., Australia, others lag in
                                                           including risk analytics, content     healthcare digital automation
                                                           and service offerings

Copyright © 2018 Allscripts Healthcare Solutions, Inc.                                                                            11
Post-acute growth -

Largest Provider
Netsmart the largest provider of
post-acute medical/behavioral
digital solutions

Chronic Illness
Chronic illness are 2-3x more
costly with behavioral
comorbidity

                              Post-acute care integration critical for value-based care models
Copyright © 2018 Allscripts Healthcare Solutions, Inc.                                           12
Growth as an industry consolidator
Revenue Based HIT Vendor Share
                           NO.          VENDOR                                                            2016 REVENUE (000s)                                % SHARE
                           1            Cerner                                                                        $4,800                                  36.42%
                           2            Epic*                                                                       ~ $2,700                                  20.49%
                           3            Allscripts **                                                                 $2,200                                  16.69%
                           4            athenahealth                                                                                         $1,100             8.35%
                           5            NextGen                                                                                                 $492            3.73%
                           6            GE                                                                                                      $475            3.60%
                           7            MEDITECH                                                                                                $462            3.51%
                           8            eClinicalWorks                                                                                          $444            3.37%
                           9            Greenway                                                                                                $350            2.66%
                           10           MEDHOST                                                                                                 $155            1.18%
Source: https://www.healthcare-informatics.com/hci100/2017-hci-100-list
• * Approximate revenue, numbers are not publicly available
• ** 2017 Annualized Revenue, assuming Q4’17 midpoint of guidance (to be inclusive of the Enterprise Information Solutions business), plus Practice Fusion

 Copyright © 2018 Allscripts Healthcare Solutions, Inc.                                                                                                                 13
Growth as an industry consolidator

   Enterprise Information Solutions                      Practice Fusion Transaction
   • Strengthens Allscripts community hospital           • Expands Allscripts addressable market
     offering (Paragon)                                  • Expands Allscripts market leadership in
   • Doubles Allscripts base of core EHR and               Payer & Life Sciences
     RCMS hospitals                                      • Allscripts to become the largest EHR
   • Adds incremental, high-margin ancillary               provider to physicians *
     solutions                                           • Cloud based technology
   • Opens incremental cross-selling                     • Attractive valuation; expect to be
     opportunities                                         accretive in year 1
   • Attractive valuation; expect to be
     accretive in year 1
   *   Source: SK&A market share analysis March, 2017

Copyright © 2018 Allscripts Healthcare Solutions, Inc.                                               14
Financial Model
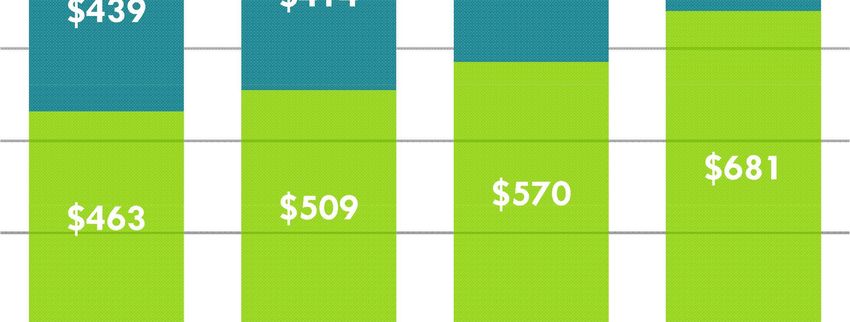
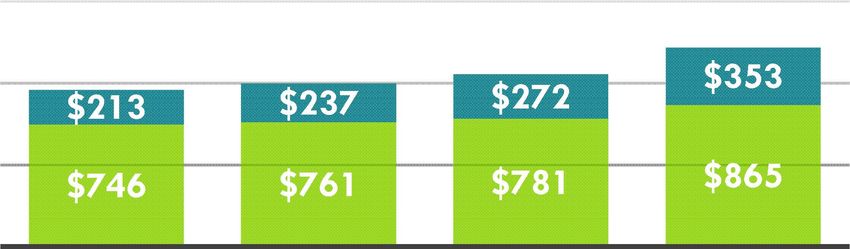
Strong Annual Sales Trends                                                                                   Recurring Revenue

                                                                                                                                            $353
                                     Bookings                                                         $213       $237         $272

                                                                                                      $746       $761         $781          $865

                                                                                                      2013       2014        2015          2016
                                                                      $630                               SW - Recurring    Services - Recurring
                                                         $541
               $439                 $414
                                                                                                      Non-Recurring Revenue

                                                                      $681                            $247
                                    $509                 $570                                                    $242                       $190
               $463                                                                                                           $196
                                                                                                      $177       $150         $137          $168

               2013                 2014                 2015         2016                            2013       2014        2015          2016
                               Software             Client Services                                   SW - Non-Recurring   Services - Non-Recurring
  Dollars in millions. See reconciliation of non-GAAP metrics in the appendix of this presentation.

Copyright © 2018 Allscripts Healthcare Solutions, Inc.                                                                                                16
Expanding Margins
                       Gross Profit & Margin                                                                 Adjusted EBITDA & Margin
       $800                                                                60%                        $350                                            50%

       $700                                                                58%                                                                        45%
                                                                                                      $300
                                                                           56%                                                                        40%
       $600
                                                                           54%                        $250                                            35%
       $500                                                                52%                                                                        30%
                                                                                                      $200
       $400                                                                50%                                                                        25%
                                                                           48%                        $150                                            20%
       $300
                                                                           46%                        $100                                            15%
       $200
                                                                           44%                                                                        10%
       $100                                                                                           $50
                                                                           42%                                                                        5%
           $0                                                              40%                         $0                                             0%
                      2013             2014              2015     2016                                         2013      2014    2015     2016
                     Software                 Services          Gross Margin                                   Adjusted EBITDA    Adj. EBITDA % Rev

  Dollars in millions. See reconciliation of non-GAAP metrics in the appendix of this presentation.

Copyright © 2018 Allscripts Healthcare Solutions, Inc.                                                                                                      17
Results: Nine Months Ending 9/30/17
                     Bookings                                                    $997M                            10%
                     Backlog                                                        $4.1B                         5%
                     Non-GAAP Revenue                                               $1.3B                         13%

                                                         $297M
                 Recurring                                                                                              Software
                 Revenue
                                                                                                      $446M             Revenue
                 Non-Recurring                                                                                          Services
                 Revenue                                    $997M                                         $848M         Revenue

  Dollars in millions. See reconciliation of non-GAAP metrics in the appendix of this presentation.

Copyright © 2018 Allscripts Healthcare Solutions, Inc.                                                                             18
Strong Cash Generation Enabling
    Balanced Approach to Value Creation
              1.          Invest to accelerate growth
                           • Continue to innovate across our growth pillars
                           • Gross R&D spend
                                +15% 9.30.17 YTD 2017
                                ~16% of non-GAAP revenue1
              2.          M&A
                          • Broaden portfolio with opportunistic M&A
                              – Enterprise Information Solutions (new core segment – small hospitals)
                              – Practice Fusion (expand addressable market)
                              – Core Medical Solutions (global – new geography)
                              – Careport (value-based care innovation)
              3.          Share repurchase
                          • $176M remaining under current authorization through 2019
                          • In 2016, repurchases totaled $121M
                          • 2017 YTD (through 9.30.17) repurchased 1.0 million shares for $12.1 million
              4.          Maintain balance sheet flexibility
1Annualized   2017 non-GAAP revenue based on mid-point of calculated Q4 2017 guidance, multiplied by four, to arrive at full year revenue (to be inclusive of the Enterprise Information Solutions business) plus pro forma Practice Fusion

 Copyright © 2018 Allscripts Healthcare Solutions, Inc.                                                                                                                                                                                       19
Affirming 2017 Outlook:

• Non-GAAP revenue at high end of $1.79 billion and $1.82 billion

• Adjusted EBITDA at high end of $345 million and $365 million, consisting of:

• Non-GAAP earnings per share growth of between 10 to 15 percent ($0.61-$0.63)

   Note: Based on original disclosure of November 2, 2017.

 Copyright © 2018 Allscripts Healthcare Solutions, Inc.                          20
J.P. Morgan 2018 Healthcare Conference | January 9, 2018

Allscripts Healthcare Solutions
Investor Presentation
Appendix: Non-GAAP Reconciliations
Reconciliations: Rec/Non-Rec and SW/Services
                                                                           Allscripts Healthcare Solutions, Inc.
                                                                            Non-GAAP Financial Information
                                                                                       (In millions)
                                                                                        (unaudited)

                                                                                                      2013         2014     2015      2016
                                              Non-GAAP Revenue                                        Total        Total    Total     Total

                                              Software Delivery, Support & Maintenance
                                              Recurring revenue                                       745.6        760.8   781.0      864.7
                                              Non-recurring revenue                                   176.7        150.1   137.4      168.2
                                              Total Software Delivery, Support & Maintenance          922.3        910.9   918.4     1,032.9

                                              Client Services
                                              Recurring revenue                                       213.1        236.5   271.8     352.5
                                              Non-recurring revenue                                   247.4        242.2   196.2     190.3
                                              Total Client Services                                   460.5        478.7   468.0     542.8

                                              Total non-GAAP re venue                                1,382.8   1,389.5     1,386.4   1,575.7

                                              Acquisition-related deferred revenue adjustments         9.8         11.6     0.0       25.8

                                              Total revenue, as reported                             1,373.0   1,377.9     1,386.4   1,549.9

Copyright © 2018 Allscripts Healthcare Solutions, Inc.                                                                                         23
Reconciliations: Adjusted EBITDA & Margins (‘15-16)
                                                                                                Al lscripts Heal thcare Sol uti ons, Inc.
                                                                                        Non-GAAP Fi nancial Information - Adjuste d EBITDA
                                                                                                     (In millions, except percent ages)
                                                                                                                (Unaudited)

                                                                                                                                                 Year Ended De ce mbe r 31,
                                                                                                                                                  2016              2015
                                                     T otal revenue, as reported                                                                   $1,549.9               $1,386.4
                                                         Acquisition-relat ed deferred revenue adjustments                                              25.8                   -
                                                     Total non-GAAP reve nue                                                                       $1,575.7               $1,386.4

                                                     Net income (loss), as reported                                                                      3.0                 ($2.0)

                                                         Acquisition-relat ed deferred revenue adjustments                                              25.8                   -
                                                         Depreciat ion and amort izat ion                                                              172.4                 161.0
                                                         Stock-based compensation expense                                                               44.2                  36.6
                                                         Non-recurring expenses and transaction-related costs                                           13.4                  23.4
                                                         Non-cash asset impairment charges                                                               4.7                   1.5
                                                         Interest expense and other, net (a)                                                            50.5                  17.4
                                                         Equity in net earnings of unconsolidated investments                                            7.5                   2.1
                                                         T ax (benefit)/provision                                                                      (17.8)                  2.6
                                                     Adjuste d EBITDA                                                                                 $303.7                $242.6

                                                         Adjusted EBITDA margin (b)                                                                     19%                   17%

                                                     (a) Interest expense and other, net has been adjusted from t he amount s presented in the stat ements of operations in order to
                                                     remove t he amortization of the fair value of the cash conversion option embedded in the 1.25% Cash Convertible Notes and
                                                     deferred debt issuance costs from interest expense since such amortization is also included in depreciation and amortization.

                                                     (b) Adjusted EBIT DA margin is calculated by dividing adjust ed EBIT DA by non-GAAP revenue.

Copyright © 2018 Allscripts Healthcare Solutions, Inc.                                                                                                                                 24
Reconciliations: Adjusted EBITDA & Margins (‘13-14)                                   Allscripts He althcare Soluti ons, Inc.
                                                                                 Non-GAAP Financial Information - Adjusted EBITDA
                                                                                            (In millions, except percentages)
                                                                                                        (Unaudited)

                                                                                                                                Year Ended Dece mbe r 31,
                                                                                                                                2014                 2013
                                                         T otal revenue, as reported                                              $1,377.9             $1,373.1
                                                           Deferred revenue and other adjust ments                                      11.6                  9.8
                                                         Total non-GAAP revenue                                                   $1,389.5             $1,382.9

                                                         Net loss, as reported                                                      ($66.5)             ($104.0)

                                                           Deferred revenue and other adjust ments                                      11.6                  9.8
                                                           Depreciat ion and amortization                                              174.3                178.8
                                                           Stock-based compensation expense                                             39.3                 37.0
                                                           Non-recurring expenses and transaction-related costs (a)                     24.2                 71.5
                                                           Non-cash asset impairment charges                                             2.4                 11.5
                                                           Interest expense and ot her income net (b)                                   15.3                 19.5
                                                           T ax provision/(benefit)                                                     (1.6)               (44.3)

                                                         Adjusted EBITDA                                                            $199.0               $179.8

                                                            Adjusted EBITDA m argin (c)                                                 14%                  13%

                                                         (a) Depreciation expense t otaling $0.0 million and $1.3 million has been excluded from non-recurring
                                                         expenses for the three months ended December 31, 2014 and 2013, respectively, and $0.9 million and
                                                         $2.5 million for the year ended December 31, 2014 and 2013, respect ively, since these amounts are also
                                                         included in depreciation and amortization.
                                                         (b) Interest expense (income) and other (income) expense has been adjust ed from the amount s present ed
                                                         in t he statements of operat ions in order to remove t he amortization of the fair value of the cash
                                                         conversion option embedded in the 1.25% Cash Convertible Notes and deferred debt issuance cost s from
                                                         interest expense since such amort izat ion is also included in depreciation and amort ization.
                                                         (c) Adjust ed EBIT DA margin is calculated by dividing adjusted EBIT DA by total non-GAAP revenue.

Copyright © 2018 Allscripts Healthcare Solutions, Inc.                                                                                                               25
Reconciliations: Non-GAAP Gross Profit and Margin
                                        Allscripts Healthcare Solutions, Inc.                                                     Allscripts Healthcare Solutions, Inc.
                                         Non-GAAP Financial Information
                                                                                                                                    Non-GAAP Financial Information
                                                     (In millions)
                                                     (unaudited)                                                                              (In millions)
                                                                                                                                               (unaudited)
                                                                       2013     2014    2015     2016                                                        2013       2014    2015    2016
                                                                       Total    Total   Total    Total                                                       Total      Total   Total   Total
          Software Delive ry, Support & Maintenance
                                                                                                          Total non-GAAP gross margin                        43.6%      43.7%   45.0%   47.7%
          Reve nue, as reported                                        918.7    907.3   918.4   1,012.4
          Acquisition-related deferred revenue and other adjustments    3.6      3.6     0.0      20.5
          Total non-GAAP revenue                                       922.3    910.9   918.4   1,032.9

          Gross profit, as reported                                    508.0    513.0   544.4   599.5
          Acquisition-related deferred revenue and other adjustments    3.6      3.6     0.0     20.5
          Acquisition-related amortization                              41.1     35.1    35.1    45.3
          Stock-based compensation expense                              1.7      1.5     4.2     4.3
          Non-recurring expenses and transaction-related costs          12.2     3.5     0.0     0.0
          Non-GAAP gross profit                                        566.6    556.6   583.7   669.6

          Client Services

          Reve nue, as reported                                        454.4    470.5   468.0   537.5
          Acquisition-related deferred revenue and other adjustments    6.1      8.1     0.0     5.3
          Total non-GAAP revenue                                       460.5    478.6   468.0   542.8

          Gross profit, as reported                                    26.4     33.1    36.2     71.5
          Acquisition-related deferred revenue and other adjustments   6.1      8.1     0.0      5.3
          Stock-based compensation expense                             3.9      4.4     4.5      4.5
          Non-recurring expenses and transaction-related costs         0.0      5.0     0.0      0.6
          Non-GAAP gross profit                                        36.5     50.6    40.7     81.9

Copyright © 2018 Allscripts Healthcare Solutions, Inc.                                                                                                                                          26
Reconciliations: Rec/Non-Rec and SW/Services
                                                                      Allscripts Healthcare Solutions, Inc.
                                                                       Non-GAAP Financial Information
                                                                                   (In millions)
                                                                                   (unaudited)
                                                                                                               YTD
                                                                                                              9.30.17
                                                         Non-GAAP Revenue                                      Total

                                                         Software Delivery, Support & Maintenance
                                                         Recurring revenue                                    696.4
                                                         Non-recurring revenue                                151.7
                                                         Total Software Delivery, Support & Maintenance       848.1

                                                         Client Services
                                                         Recurring revenue                                    300.6
                                                         Non-recurring revenue                                145.3
                                                         Total Client Services                                445.9

                                                         Total non-GAAP revenue                               1,294.0

                                                         Acquisition-related deferred revenue adjustments      5.0

                                                         Total revenue, as reported                           1,289.0

Copyright © 2018 Allscripts Healthcare Solutions, Inc.                                                                  27
You can also read